Early Prediction of Long-Term Response to Cabergoline in
Patients with Macroprolactinomas
Youngki Lee1, Cheol Ryong Ku1, Eui-Hyun Kim2, Jae Won Hong3, Eun Jig Lee1, Sun Ho Kim2
1Division of Endocrinology, Department of Internal Medicine, 2Department of Neurosurgery, Yonsei University College of
Medicine, Seoul; 3Department of Internal Medicine, Inje University Ilsan Paik Hospital, Inje University College of Medicine,
Goyang, Korea
Background: Cabergoline is typically effective for treating prolactinomas; however, some patients display cabergoline resis-tance, and the early characteristics of these patients remain unclear. We analyzed early indicators predicting long-term response to cabergoline.
Methods: We retrospectively reviewed the cases of 44 patients with macroprolactinomas who received cabergoline as first-line treatment; the patients were followed for a median of 16 months. The influence of various clinical parameters on outcomes was evaluated.
Results: Forty patients (90.9%) were treated medically and displayed tumor volume reduction (TVR) of 74.7%, a prolactin nor-malization (NP) rate of 81.8%, and a complete response (CR; TVR >50% with NP, without surgery) rate of 70.5%. Most patients (93.1%) with TVR ≥25% and NP at 3 months eventually achieved CR, whereas only 50% of patients with TVR ≥25% without NP and no patients with TVR <25% achieved CR. TVR at 3 months was strongly correlated with final TVR (R=0.785). Patients with large macroadenomas exhibited a low NP rate at 3 months, but eventually achieved TVR and NP rates similar to those of pa-tients with smaller tumors. Surgery independently reduced the final dose of cabergoline (β=−1.181 mg/week), and two of four patients who underwent surgery were able to discontinue cabergoline.
Conclusion: Determining cabergoline response using TVR and NP 3 months after treatment is useful for predicting later out-comes. However, further cabergoline administration should be considered for patients with TVR >25% at 3 months without NP, particularly those with huge prolactinomas, because a delayed response may be achieved. As surgery can reduce the cabergoline dose necessary for successful disease control, it should be considered for cabergoline-resistant patients.
Keywords: Cabergoline; Dopamine; Prolactinoma; Hyperprolactinemia
INTRODUCTION
Prolactinomas are the most frequent functioning pituitary ade-nomas, comprising approximately 40% of pituitary tumors
[1,2]. Their prevalence in the general adult population has been reported to range from 100 to 625 cases per million peo-ple [3,4]. Prolactinomas cause symptoms via two mechanisms, hormonal effects via hyperprolactinemia and mass effects via
pISSN 2093-596X · eISSN 2093-5978
Article
Received: 29 October 2013, Revised: 27 December 2013, Accepted: 21 January 2014
Corresponding author: Jae Won Hong
Department of Internal Medicine, Inje University Ilsan Paik Hospital, Inje University College of Medicine, 170 Juhwa-ro, Ilsanseo-gu, Goyang 411-706, Korea
Tel: +82-31-910-7790, Fax: +82-31-910-7914, E-mail: hjwcarrot@paik.ac.kr
Copyright © 2014 Korean Endocrine Society
This is an Open Access article distributed under the terms of the Creative Com-mons Attribution Non-Commercial License (http://creativecomCom-mons.org/ licenses/by-nc/3.0/) which permits unrestricted non-commercial use, distribu-tion, and reproduction in any medium, provided the original work is properly cited.
tumor expansion [1,5]. Hyperprolactinemia causes sexual and gonadal dysfunction, such as decreased libido, amenorrhea, erectile disorder, and infertility, as well as galactorrhea. Mass effects in patients with macroadenomas include bilateral hemi-anopsia, headache, hypopituitarism, and cranial neuropathy. Dopamine agonists (DAs) are well-established first-line treatments for prolactinomas that can induce tumor shrinkage and normalization of prolactin (PRL) levels (NP) [1,5]. These agonists include bromocriptine, pergolide, cabergoline (CAB), and quinagolide, but only bromocriptine and CAB are current-ly available in Korea. Bromocriptine, which was introduced clinically in the 1980s, is a traditional drug for the treatment of prolactinomas [1,6]. However, CAB, which was introduced more recently, is used more commonly than bromocriptine. CAB is a selective agonist of the D2 receptor, which is related to the resolution of hyperprolactinemia, contrary to bromocrip-tine, which has partial affinity for the D1 receptor and affinity for the D2 receptor [6]. This agent has superior tolerability and convenience for patients, as well as higher rates of tumor shrinkage and control of hyperprolactinemia compared with bromocriptine [7,8]. It has also been shown to be effective in patients with bromocriptine-intolerant or bromocriptine-resis-tant prolactinomas [9,10].
However, a considerable proportion of patients display re-sistance to CAB. CAB treatment was reported to induce NP and successful tumor reduction in 61% to 92% and 55% to 100% of patients with prolactinomas, respectively [1]. Molitch [11] defined pharmacologic resistance in prolactinoma as a failure to achieve NP and/or to decrease tumor size by ≥50%, and described the rate of CAB resistance as 10% to 15% in terms of PRL levels and tumor size. The treatment of patients with CAB resistance remains challenging, although a few arti-cles have suggested that surgical debulking or high-dose CAB therapy can be helpful for patients with resistance to DAs [12-15]. In addition, it is unclear how these patients can be identi-fied early in the course of treatment.
A few years ago, we reported the long-term outcomes of pa-tients with invasive prolactinomas who were treated with bro-mocriptine [16]. We documented that patients who achieved a tumor volume reduction (TVR) of at least 25% with NP at 3 months had a high probability of achieving a long-term com-plete response (CR), defined as a TVR of at least 50% with sustained NP. However, patients who were treated with CAB as a first-line therapy could not be included because CAB was a newly introduced and expensive drug in Korea at that time. In this study, we describe the results of CAB administration
as a first-line treatment for 44 patients with macroprolactino-mas who were followed for a median of 16 months. To identi-fy early predictors of long-term response to CAB, we analyzed the influence of initial clinical parameters and early response to CAB on later outcomes. We also evaluated which treatment factors could affect the patient outcomes.
METHODS
PatientsWe conducted a 6-year retrospective study of patients with macroprolactinomas who were treated with CAB as a primary drug at Severance Hospital, Seoul, Korea between 2008 and 2013. Macroprolactinoma was defined as (1) a PRL level of at least 150 ng/mL and (2) a maximal diameter of at least 1 cm on baseline magnetic resonance imaging (MRI) scans of the sellar area. To evaluate the relationship between early and late parameters, the following additional inclusion criteria were applied: (1) a full dataset of pituitary hormone assays (includ-ing PRL) and sella MRI at baseline, (2) follow-up PRL assay and MRI after 3 months of CAB treatment, and (3) total fol-low-up duration of at least 12 months.
Treatment and response assessment
In all cases, oral CAB was started at a low dose (1 to 1.5 mg/ wk), and the dosage was gradually increased to 1.5 to 4 mg/ wk within 2 to 4 weeks. The increased dose was maintained for 3 months after treatment initiation to ensure a sufficient period of exposure to CAB. Evaluations of response occurred after 3 months, and the dose of CAB and interval of follow-up were continuously adjusted in consideration of response, toler-ance, and other clinical indicators. For patients with good re-sponse and tolerance, reduction of CAB dose was carefully at-tempted with a relatively long interval of follow-up. For pa-tients with poor response, a higher dose of CAB and a short interval of follow-up were employed. Because the follow-up intervals and treatment durations of the patients varied, three representative time points of response assessment were retro-spectively defined as follows: early assessment, when the first sella MRI and PRL assay were performed after 3 months of CAB treatment; late assessment, when the first sella MRI and PRL assay were performed 12 to 24 months after treatment; and last assessment, when the last sella MRI and PRL assay were performed. Tumor volume was calculated according to Di Chiro and Nelson’s formula: volume=height×length× width×π/6 [17]. The degree of response was assessed using
TVR and NP. When evaluating the relationship between early response and later outcomes, we used group criteria according to the early response to CAB, as suggested in our previous ar-ticle [16]: group 1, TVR ≥25% with NP; group 2, TVR ≥ 25% without NP; group 3, TVR <25% with NP; and group 4, TVR <25% without NP [16]. A successful response at the late or last assessment was defined as follows: volume response, TVR ≥50% without surgery; PRL response, NP without sur-gery; and CR, volume response with PRL response.
PRL assays
Serum PRL levels were measured via chemiluminescence im-munoassay using commercial kits (Beckman Coulter, Brea, CA, USA). The within-run and total coefficients of variation for PRL concentrations were 3.66% and 3.77%, respectively. PRL levels <15 ng/mL for males and <25 ng/mL for females were regarded as normal. If serum PRL levels were normal or mildly elevated, PRL was measured again in diluted serum samples to exclude the hook effect, which can cause falsely low results [18,19].
Statistical analysis
Data were presented as the median (interquartile range) or the mean±SD. The relationship between early response and late or last response was analyzed using the Pearson correlation coefficient and multiple linear regression tests. The Student t test, Kruskal-Wallis test, Mann-Whitney U test, and Fisher ex-act test were used to compare multiple groups. The relation-ship between tumor volume or PRL levels at baseline and TVR, PRL levels, or the maintained dose of CAB after treat-ment was analyzed using the Spearman correlation coefficient. Statistical analyses were performed using SPSS version 20 (IBM Co., Armonk, NY, USA). Values of P<0.05 were con-sidered statistically significant.
RESULTS
Baseline characteristics and overall treatment outcomes
Of 66 patients with macroprolactinomas who were treated with CAB as a primary drug during the study period, 47 pa-tients were followed for at least 1 year from the initial admin-istration of CAB to the end of the data collection. One patient was lost to follow-up before 12 months, and two female pa-tients who became pregnant less than 12 months into CAB treatment were also excluded because CAB had to be discon-tinued irrespective of tumor size and PRL level. Finally, in
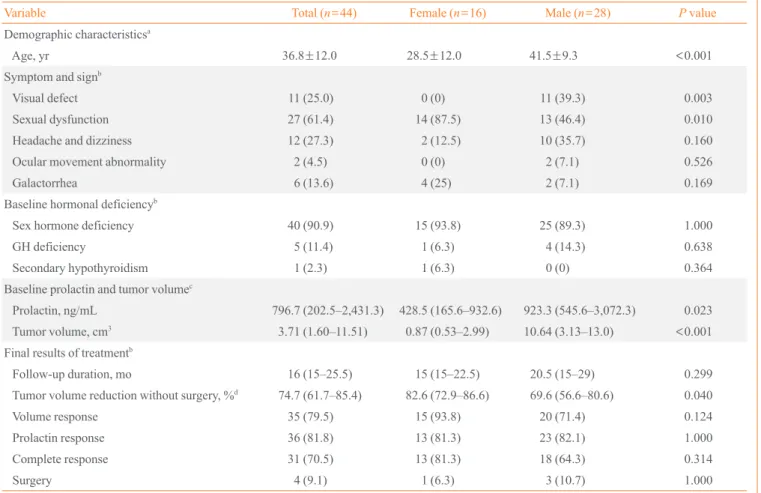
to-tal, 44 patients, including 28 males (63.6%), were included in the study (Tables 1, 2). The mean age of the patients was 36.8 years, and the median follow-up duration was 16 months (in-terquartile range, 15 to 25.5). Eleven patients (25%) had visual field defects, and 28 patients (61.4%) complained of sexual dysfunction including impotence, oligomenorrhea/amenor-rhea, and/or infertility. The patients also complained of head-ache and dizziness (n=12, 27.3%), ocular movement abnor-malities (n=2, 4.5%), and galactorrhea (n=6, 13.6%). The me-dian PRL level and meme-dian tumor volume were 796.7 ng/dL (range, 202.5 to 2,431.3) and 3.71 cm3 (range, 1.60 to 11.51),
respectively. Tumor invasion of the cavernous sinus was noted in 20 patients (45.5%). Most patients (n=40, 90.9%) displayed sex hormone deficiency, defined as a testosterone level below the lower limit of the normal population for males, oligomen-orrhea/amenorrhea in premenopausal females, and an inappro-priately low gonadotropin level in postmenopausal females. Five patients (11.4%) displayed growth hormone (GH) defi-ciency, defined as a lower serum insulin-like growth factor 1 (IGF-1) level than the age- and sex-specific lower limit of the normal population, whereas secondary hypothyroidism and adrenal insufficiency were found in one patient and zero tients, respectively. Compared with female patients, male pa-tients were older (41.5 years vs. 28.5 years, P<0.001), less likely to complain of sexual dysfunction (46.4% vs. 87.5%, P= 0.010), and more likely to have a visual field defect (39.3% vs. 0%, P=0.003), and they displayed higher tumor volume (10.64 cm3 vs. 0.87 cm3, P<0.001) and PRL level (923.3 ng/mL
vs.428.5 ng/mL, P=0.023).
At the last assessment, a volume response, PRL response, and CR were achieved by 35 (79.5%), 36 (81.8%), and 31 pa-tients (70.5%), respectively (Table 1). Two papa-tients who ex-hibited transient mild PRL elevation (patients no. 18 and 24, who had PRL levels of 52.3 and 33.6 ng/mL, respectively) showed very poor drug compliance at the last assessment, but were regarded as having achieved a PRL response. Four pa-tients (9.1%) underwent surgery in their treatment courses, and the median TVR of the patients who did not undergo sur-gery was 74.7% (range, 61.7 to 85.4).
Influence of baseline tumor burden on outcomes
Neither the baseline tumor volume nor PRL level were direct-ly correlated with TVR or PRL level at the eardirect-ly, late, and last assessments (Spearman correlation coefficients, all P>0.05). However, six patients with large tumors (larger group), whose baseline tumor volume exceeded 18 cm3 and whose PRL level
exceeded 2,000 ng/mL, displayed higher PRL levels than pa-tients with smaller tumors (smaller group) 3 months after treatment (22.9 ng/mL vs. 1.6 ng/mL, P=0.043) (Fig. 1A). In-terestingly, these differences in PRL levels between groups lost their statistical significance at 9 months (Fig. 1A), and the TVR of patients who did and did not undergo surgery did not vary between the groups during the entire treatment course (Fig. 1B).
Relationships between early response and late or last response
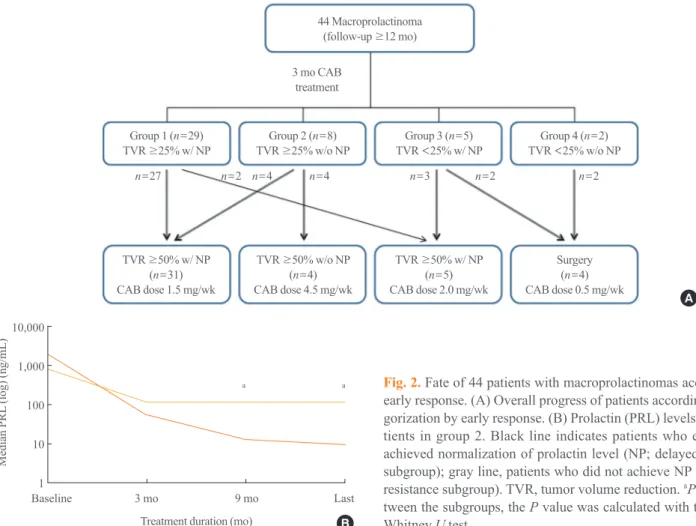
To assess the influence of early response on late or last re-sponse, we primarily categorized patients into four groups ac-cording to their early responses to CAB. Of the total 44 pa-tients, 29 patients were included in group 1 (TVR ≥25% with NP), eight in group 2 (TVR ≥25% without NP), five in group
3 (TVR <25% with NP), and two in group 4 (TVR <25% without NP) (Fig. 2A). Most patients in group 1 (93.1%) achieved a CR as expected, but two patients (6.9%) did not achieve TVR ≥50% until the last assessment. Four of eight patients (50%) in group 2 eventually achieved a CR, whereas no patients in groups 3 and 4 achieved a CR. The proportion of CRs significantly differed between the groups (group 1 vs. 2 vs. 3 vs. 4; 93.1% vs. 50% vs. 0% vs. 0%; P<0.001). The last maintenance dose of CAB differed according to the last responses (CR vs. volume response without NP vs. PRL re-sponse without TVR ≥50% vs. surgery; 1.5 mg/wk (range, 1.0 to 2.0) vs. 4.5 mg/wk (range, 2.75 to 4.5) vs. 2.0 mg/wk (range, 1.0 to 2.0) vs. 0.5 mg/wk (range, 0.0 to 0.7); overall
P=0.006), but no differences were observed between the four
groups according to early responses (P=0.109).
We conducted further analysis of change in PRL levels to
Table 1. Summary of 44 Patients with Macroprolactinomas
Variable Total (n=44) Female (n=16) Male (n=28) P value
Demographic characteristicsa
Age, yr 36.8±12.0 28.5±12.0 41.5±9.3 <0.001 Symptom and signb
Visual defect 11 (25.0) 0 (0) 11 (39.3) 0.003
Sexual dysfunction 27 (61.4) 14 (87.5) 13 (46.4) 0.010
Headache and dizziness 12 (27.3) 2 (12.5) 10 (35.7) 0.160
Ocular movement abnormality 2 (4.5) 0 (0) 2 (7.1) 0.526
Galactorrhea 6 (13.6) 4 (25) 2 (7.1) 0.169
Baseline hormonal deficiencyb
Sex hormone deficiency 40 (90.9) 15 (93.8) 25 (89.3) 1.000
GH deficiency 5 (11.4) 1 (6.3) 4 (14.3) 0.638
Secondary hypothyroidism 1 (2.3) 1 (6.3) 0 (0) 0.364
Baseline prolactin and tumor volumec
Prolactin, ng/mL 796.7 (202.5–2,431.3) 428.5 (165.6–932.6) 923.3 (545.6–3,072.3) 0.023 Tumor volume, cm3 3.71 (1.60–11.51) 0.87 (0.53–2.99) 10.64 (3.13–13.0) <0.001 Final results of treatmentb
Follow-up duration, mo 16 (15–25.5) 15 (15–22.5) 20.5 (15–29) 0.299 Tumor volume reduction without surgery, %d 74.7 (61.7–85.4) 82.6 (72.9–86.6) 69.6 (56.6–80.6) 0.040
Volume response 35 (79.5) 15 (93.8) 20 (71.4) 0.124
Prolactin response 36 (81.8) 13 (81.3) 23 (82.1) 1.000
Complete response 31 (70.5) 13 (81.3) 18 (64.3) 0.314
Surgery 4 (9.1) 1 (6.3) 3 (10.7) 1.000
Values are expressed as mean±SD, number (%), or median (interquartile range). GH, growth hormone.
aThe Student t test was used for parametric and nonparametric analyses, respectively; bThe Fisher exact test was used for categorical data analyses; cThe Mann-Whitney U test was used for parametric and nonparametric analyses, respectively; dPatients who underwent surgery before the final as-sessment were excluded.
Table 2.
Forty-Four Patients with Macroprolactinomas
Patient no.
Group
Age, yr
Sex
Cavernous sinus invasion
Baseline
Post-Tx 3 mo
Post-Tx 12 mo
(first follow-up after 12 mo)
Post-Tx last CAB dose, mg/wk Tumor volume, cm 3 Prolactin, ng/mL Tumor volume, cm 3 (TVR, %) Prolactin, ng/mL Tumor volume, cm 3 (TVR, %) Prolactin, ng/mL Follow-up, mo Tumor volume, cm 3 (TVR, %) Prolactin, ng/mL Follow- up, mo Peak Last 1 1 48.1 M Ye s 44.56 5,280 22.77 (48.9) 4 12.7 (71.5) 4 15 As left 3 3 2 1 33.6 M Ye s 25.16 3,268 11.57 (54) 0.7 7.62 (69.7) 0.5 15 As left 3 2 3 1 30.4 M Ye s 14.31 623 5.21 (63.6) < 1 2.19 (84.7) 0.21 21 2.04 (85.7) < 0.25 64 1.5 0.5 4 1 39 M Ye s 13.66 3,789.60 10.19 (25.4) 1.1 8.55 (37.4) 0.5 15 As left 3 2 5 1 42.3 M No 11.86 1,475.50 8.06 (32) 3.4 4.84 (59.2) 1.1 22 As left 3 2 6 1 53.7 M Ye s 11.8 3,326 7.49 (36.5) 0.7 3.67 (68.9) 0.3 21 As left 3 3 7 1 25.4 M No 10.95 795.56 4.35 (60.3) 0.8 0.52 (95.3) 0.8 20 As left 2 0.7 8 1 49.6 M Ye s 10.74 2,844.10 4.24 (60.5) 1.4 3.84 (64.2) 0.7 15 As lef 3 2 9 1 48 M No 10.54 904.4 6.88 (34.7) 8.6 4.9 (53.5) 8.1 21 5.67 (46.2) 11 33 3 1 10 1 41 M No 10.15 148.5 3.9 (61.6) 0.4 3.22 (68.3) 1.7 22 As lef 3 2 11 1 35.7 M Ye s 9.22 942.2 5.16 (44) 1.8 4 (56.6) 2.1 12 As lef 2 3 12 1 45 M Ye s 9.2 799.67 4.98 (45.9) 0.5 3.09 (66.4) 0.5 25 As lef 3 2 13 1 42.9 M No 8.34 628.3 5.32 (36.2) 0.8 4.58 (45.1) 0.3 12 1.97 76.4 34 3 0.5 14 1 16.6 F No 7.04 3,982.10 2.69 (61.8) 1.2 1.14 (83.8) 0.8 21 As lef 3 2 15 1 49.3 F Ye s 3.72 894.7 2.73 (26.6) 18.1 1.84 (50.5) 16.1 21 As lef 3 2 16 1 48.4 M No 3.6 797.8 2.18 (39.4) 6.2 1.76 (51.1) 0.8 15 As lef 3 2 17 1 43.6 M No 2.8 651.6 0.52 (81.4) 4.1 0.35 (87.5) 3.4 15 0.33 (88.2) 5.1 27 3 1 18 1 21 F Ye s 2.29 1,271 1.21 (47.2) 7.73 0.77 (66.4) 3.99 15 0.64 (72.1) 52.3 48 1.75 1 19 1 64.9 M Ye s 2.1 1 1,501.30 1 (52.6) < 0.25 0.46 (78.2) < 0.25 15 As lef 3 1.5 20 1 24.2 F No 1.51 614.8 0.41 (72.8) 0.8 0.19 (87.4) 0.4 15 As lef 3 0.5 21 1 15.6 F No 0.93 197 0.33 (64.5) 2.21 0.14 (84.9) 2.74 16 0.13 (86) 1.2 59 2 1 22 1 26.1 F No 0.8 501 0.27 (66.3) 1.2 0.12 (85) 0.6 15 As lef 3 1 23 1 21.1 F No 0.78 356 0.44 (43.6) 2.4 0.23 (70.5) 1.5 15 As lef 3 1 24 1 22.6 F No 0.69 168.1 0.38 (44.9) 0.7 0.12 (82.6) 33.6 15 As lef 3 1
Table 2. Continued Patient no. Group Age, yr Sex
Cavernous sinus invasion
Baseline
Post-Tx 3 mo
Post-Tx 12 mo
(first follow-up after 12 mo)
Post-Tx last CAB dose, mg/wk Tumor volume, cm 3 Prolactin, ng/mL Tumor volume, cm 3 (TVR, %) Prolactin, ng/mL Tumor volume, cm 3 (TVR, %) Prolactin, ng/mL Follow-up, mo Tumor volume, cm 3 (TVR, %) Prolactin, ng/mL Follow- up, mo Peak Last 25 1 38.3 M No 0.65 131.9 0.19 (70.8) 1.2 0.07 (89.2) 1.2 15 As lef 3 2 26 1 46.3 F No 0.54 156.92 0.28 (48.1) 0.7 0.12 (77.8) 0.4 15 As lef 1 0.7 27 1 32.6 F No 0.52 163 0.25 (51.9) 8.3 0.25 (51.9) 8.9 15 As lef 2 1.5 28 1 27.1 F No 0.43 159.3 0.12 (72.1) 0.4 0.06 (86) 0.3 15 As lef 2 0.5 29 1 26 F No 0.36 151.1 1 0.25 (30.6) 0.4 0.16 (55.6) < 0.25 12 0.03 (91.7) 0.3 24 2 0.25 30 2 27.5 M Ye s 89.96 13,096.40 27.01 (70) 734.9 21.96 (75.6) 423.7 15 As lef 4.5 4.5 31 2 45.3 M Ye s 20.44 8,759 10.04 (50.9) 57.5 2.72 (86.7) 19.5 21 2.42 (88.2) 11.5 32 3 2 32 2 35 M Ye s 19.65 2,876.50 6.63 (66.3) 22.78 3.67 (81.3) 13.9 16 3.24 (83.5) 8.1 41 3 2 33 2 55.1 F Ye s 5.87 1,018.20 2.16 (63.2) 58.7 1.03 (82.5) 5.1 14 As lef 2 1 34 2 33.1 F No 3.69 970.4 1.18 (68) 32.15 0.55 (85.1) 28.05 15 0.43 (88.3) 47.7 26 2 1 35 2 39.9 M No 3.45 468.2 1.29 (62.6) 189.6 0.99 (71.3) 196.3 15 As lef 4.5 4.5 36 2 16.5 F Ye s 2.28 656.5 1.09 (52.2) 33.5 0.6 (73.7) 29.9 15 As lef 4.5 4.5 37 2 31.5 M No 2.22 176.2 1 (55) 17 0.43 (80.6) 12.3 21 As lef 3 1 38 3 27.5 M No 17.67 2042 18.36 ( –3.9) 0.6 0 (100) a 2.2 a 15 0 (100) a 7.9 a 32 3 0.7 39 3 37.4 M Ye s 11.21 4,256 10.03 (10.5) 5.8 6.81 (39.3) 8.7 18 6.79 (39.4) 8.1 31 3 3 40 3 37.3 M No 2.27 207.9 1.93 (15) 2.6 1.46 (35.7) 2.8 15 As lef 3 2 41 3 56.6 M Ye s 1.68 165.3 1.54 (8.3) 0.5 1.26 (25) 0.6 21 As lef 2 0.5 42 3 22.5 F No 0.35 196.3 0.33 (5.7) 6.7 0 (100) a 15.3 a 15 As lef 3 0 43 4 51.4 M Ye s 22.06 2,820.50 17.19 (22.1) 23.1 0 (100) a 13.2 a 15 As lef 3 0 44 4 42.2 M Ye s 2.34 317.1 2.39 ( –2.1) 58.2 2.42 ( –3.4) 699.4 15 Uncertain a,b 393.8a 17 3 1 Tx, treatment;
TVR, tumor volume reduction; CAB, caber
goline; M, male; F
, female.
aSur
gery was performed before measuring other variables;
identify the distinguishing characteristics of the patients in group 2 that eventually achieved a CR (Fig. 2B). Of the four patients who achieved NP, three patients displayed normal
PRL levels at 6 to 9 months (patients no. 32, 33, and 37). The remaining patient, who had a giant prolactinoma (patient no. 31; maximum tumor diameter 4.8 cm, tumor volume 20.4 cm3,
Fig. 1. Changes in prolactin (PRL) levels and tumor volume reduction (TVR) in two groups according to baseline tumor volume. Black lines indicate patients with larger tumors (larger group); gray lines, patients with smaller tumors (smaller group). The cutoff between the
two groups was a baseline tumor volume of 18 cm3. Each P value between the groups was calculated at each time point with the
Mann-Whitney U test. At each time point, the patients who underwent surgery before the assessment were excluded. (A) Changes in median PRL levels. (B) Changes in median TVR.
10,000 1,000 100 10 1 Baseline 3 mo 9 mo 15 mo 6 6 5 5 38 38 37 36 No. of Included patients Larger group Smaller group P=0.043 P=0.404 P=0.118 Median PRL (log) (ng/mL) P<0.001 A 80 70 60 50 40 30 20 10 0
Baseline 3 mo (early) Lete Latest
6 6 5 5 38 38 37 35 No. of Included patients P=0.578 P=0.340 P=0.472 Larger group Smaller group Median TVR (%) B
Fig. 2. Fate of 44 patients with macroprolactinomas according to early response. (A) Overall progress of patients according to cate-gorization by early response. (B) Prolactin (PRL) levels of the pa-tients in group 2. Black line indicates papa-tients who eventually achieved normalization of prolactin level (NP; delayed response subgroup); gray line, patients who did not achieve NP (sustained
resistance subgroup). TVR, tumor volume reduction. aP<0.05
be-tween the subgroups, the P value was calculated with the Mann-Whitney U test. 10,000 1,000 100 10 1 Median PRL (log) (ng/mL) Baseline 3 mo 9 mo Last
Treatment duration (mo)
a a B A 44 Macroprolactinoma (follow-up ≥12 mo) Group 1 (n=29) TVR ≥25% w/ NP TVR ≥50% w/ NP (n=31) CAB dose 1.5 mg/wk TVR ≥50% w/o NP (n=4) CAB dose 4.5 mg/wk TVR ≥50% w/ NP (n=5) CAB dose 2.0 mg/wk Surgery (n=4) CAB dose 0.5 mg/wk Group 2 (n=8) TVR ≥25% w/o NP 3 mo CAB treatment Group 3 (n=5) TVR <25% w/ NP TVR <25% w/o NPGroup 4 (n=2) n=2 n=2 n=3 n=4 n=4 n=2 n=27
and PRL level 8,759 ng/mL at baseline), maintained a slightly supranormal range PRL until 15 months (18.6 ng/mL at 9 months and 19.5 ng/mL at 15 months), but exhibited NP at 21 months. Median PRL levels did not differ between the patients who achieved NP (delayed response subgroup, n=4) and those who did not achieve NP (sustained resistance subgroup, n=4) until 3 months (1,947.4 ng/mL vs. 813.5 ng/mL, P=0.886 at baseline; 55.3 ng/mL vs. 115.3 ng/mL, P=0.686). However, a meaningful difference in median PRL levels between the two subgroups could also be observed after 9 months of CAB treatment (median PRL level: 13.0 ng/mL vs. 117.9 ng/mL,
P=0.029). Median TVR did not vary between the subgroups
(59.1% vs. 65.3%, P=0.486 at 3 months; 81.9% vs. 74.7%,
P=0.200 at 15 months).
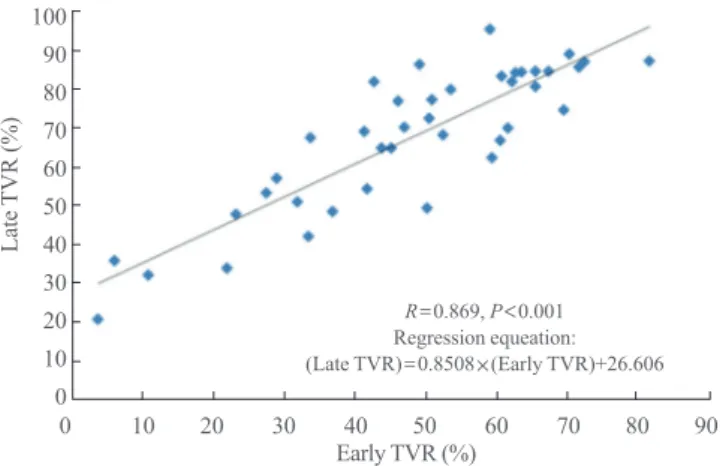
We also attempted to determine whether the absolute value of early TVR itself is predictive of response or whether only a certain cutoff such as 25% is meaningful. Pearson correlation analysis demonstrated that late TVR had a very strong correla-tion with early TVR (R=0.869, P<0.001) according to the fol-lowing regression equation: late TVR=0.851×early TVR+ 26.606 (Fig. 3). Last TVR also displayed a correlation with early TVR, although the strength of the correlation was slightly lower (R=0.785, P<0.001). Multiple regression analysis was subsequently performed using sex, natural logarithm of the CAB maintenance duration between early and late assessment (Ln [weeks]), and cumulative dose of CAB between early and late assessments (mg) as independent variables. In this analy-sis, a greater TVR at the early assessment and a longer CAB maintenance duration were independent predictors for greater TVR at the late assessment (β=0.849, P<0.001; and β for Ln [weeks], 16.978, P=0.016, respectively), whereas sex and
cu-mulative dose of CAB were not predictive (P=0.074 and P= 0.613, respectively).
Influence of surgery on the final maintenance dose of CAB
Because the patients who underwent surgery maintained the lowest dose of CAB (Fig. 2A), we sought to confirm whether surgery could independently reduce CAB dose. Thus, we per-formed multiple linear regression analysis with four indepen-dent variables as follows: undergoing surgery, baseline PRL level (mg/mL), 1/baseline volume (1/cm3), and natural
loga-rithm of the treatment duration (Ln [months]). Baseline vol-ume was transformed reciprocally to ensure the linearity of the model. Analysis confirmed that undergoing surgery (β= −1.181, P=0.013), a lower baseline PRL level (β=0.161, P= 0.008), a smaller baseline volume (β for 1/baseline volume= −0.448, P=0.026), and a longer treatment duration (β for Ln [months]=−0.882, P=0.010) were independent predictors for a lower dose of CAB at the last assessment.
Summary of patients who underwent surgery
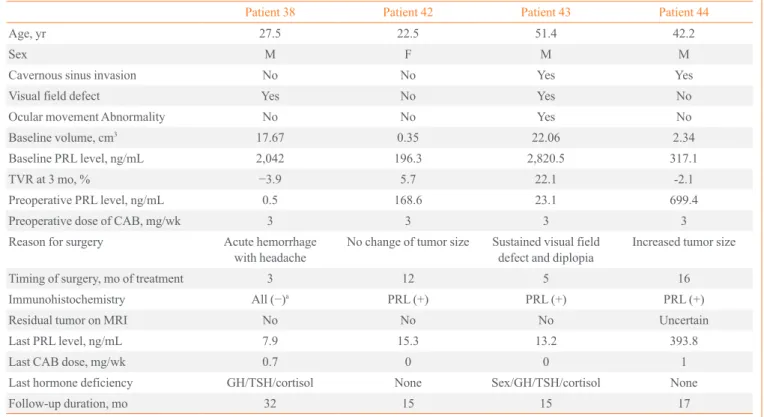
Four patients underwent transsphenoidal surgery (Table 3; pa-tient nos. 38, 42, 43, and 44). The first papa-tient (papa-tient no. 38) underwent surgery after 3 months of CAB treatment because of acute hemorrhage in the tumor accompanied by severe headache. Immunohistochemical analysis for all pituitary hor-mones including PRL was negative, but the PRL result was re-garded to be false-negative due to destruction of tumor cells following acute hemorrhage, as a nonfunctioning pituitary ad-enoma could not explain the patient’s extremely high baseline PRL level (2,042 ng/mL). His headache resolved completely after surgery, although he developed panhypopituitarism. His CAB dose was reduced from 3 to 0.7 mg/wk, and his serum PRL levels were within the reference range. The second pa-tient (papa-tient no. 43) underwent surgery at 5 months because of a progressive visual field defect and diplopia. Immunohis-tochemical analysis of the excised tumor revealed PRL immu-noreactivity. His symptoms were dramatically improved after surgery, although panhypopituitarism developed. The patient was able to discontinue CAB with sustained NP, and MRI re-vealed no residual tumor. The third patient (patient no. 42) un-derwent elective surgery after 12 months of CAB treatment owing to CAB resistance. Her early TVR was only 5.7%, and her preoperative PRL level was 168.6 ng/mL. Immunohisto-chemical analysis demonstrated PRL reactivity. She was able to discontinue CAB with sustained NP and no evidence of a residual tumor. The fourth patient (patient no. 44) also
under-Fig. 3. Correlation between late tumor volume reduction (TVR) and early TVR. The Pearson correlation analysis was used for sta-tistical analysis. 100 90 80 70 60 50 40 30 20 10 0 0 10 20 30 40 50 60 70 80 90 Early TVR (%) Late TVR (%) R=0.869, P<0.001 Regression equeation: (Late TVR)=0.8508×(Early TVR)+26.606
went elective surgery after 16 months of CAB treatment due to CAB resistance. His tumor size had increased by 2.1% de-spite 3 months of CAB treatment, and it continued to grow af-ter 12 additional months of treatment without NP. Immunohis-tochemical staining revealed immunoreactivity for PRL. Post-operative MRI could not confirm whether there was residual tumor or only postoperative changes. PRL levels were not normalized despite surgery; however, CAB dose was marked-ly decreased (from 3 to 1 mg/wk) with a partial reduction in serum PRL level (from 699.4 to 393.8 ng/mL).
Overall, none of the patients achieved TVR ≥25% at 3 months, including those with (patient no. 38 and 42) and those without (patient no. 43 and 44) NP. CAB dose was decreased after surgery, and two patients were able to discontinue CAB without evidence of residual tumor or PRL elevation.
Changes in the pituitary hormone levels and haracteristics of patients who did not exhibit testosterone level recovery
Among the patients who did not undergo surgery, CAB treat-ment improved baseline abnormalities of other pituitary hor-mones in most. All subnormal IGF-1 levels (patient no. 6, 8, 9,
13, and 24) and secondary hypothyroidism (patient no. 34) were gradually restored. All premenopausal women with oli-gomenorrhea/amenorrhea demonstrated improvement of symptoms following reduction of PRL levels, and the subnor-mal gonadotropin level of one postmenopausal woman was also improved. However, six male patients with NP and two male patients without NP displayed subnormal serum testos-terone levels at the last assessment.
To elucidate the early characteristics of patients who could not achieve normalization of testosterone levels despite NP, we compared various clinical parameters of these patients (subnormal group, n=6) with those of male patients with nor-mal testosterone levels and NP at the last assessment (nornor-mal group, n=16). Three patients who underwent surgery and one patient who received exogenous testosterone replacement be-fore the first visit to our institution were excluded from this analysis to minimize confounding factors. The subnormal group had lower baseline IGF-1 (median 112.0 ng/mL vs. 212.1 ng/mL, P=0.013) and testosterone levels (median 57.9 ng/dL vs. 159.4 ng/dL, P=0.010) than the normal group. Pa-tients in the subnormal group tended to be older (48.4 years
Table 3. Summary of Patients Who Underwent Surgery
Patient 38 Patient 42 Patient 43 Patient 44
Age, yr 27.5 22.5 51.4 42.2
Sex M F M M
Cavernous sinus invasion No No Yes Yes
Visual field defect Yes No Yes No
Ocular movement Abnormality No No Yes No
Baseline volume, cm3 17.67 0.35 22.06 2.34
Baseline PRL level, ng/mL 2,042 196.3 2,820.5 317.1
TVR at 3 mo, % −3.9 5.7 22.1 -2.1
Preoperative PRL level, ng/mL 0.5 168.6 23.1 699.4
Preoperative dose of CAB, mg/wk 3 3 3 3
Reason for surgery Acute hemorrhage
with headache No change of tumor size Sustained visual field defect and diplopia Increased tumor size
Timing of surgery, mo of treatment 3 12 5 16
Immunohistochemistry All (−)a PRL (+) PRL (+) PRL (+)
Residual tumor on MRI No No No Uncertain
Last PRL level, ng/mL 7.9 15.3 13.2 393.8
Last CAB dose, mg/wk 0.7 0 0 1
Last hormone deficiency GH/TSH/cortisol None Sex/GH/TSH/cortisol None
Follow-up duration, mo 32 15 15 17
M, male; F, female; PRL, prolactin; TVR, tumor volume reduction; CAB, cabergoline; MRI, magnetic resonance imaging; GH, growth hormone; TSH, thyroid-stimulating hormone.
vs. 39.8 years, P=0.052), and this group had a higher propor-tion of patients with age-specific subnormal IGF-1 levels (50% vs. 6.3%, P=0.046). Baseline tumor volume, PRL lev-els, proportion of patients with symptoms related to volume effects, and responses to CAB in terms of TVR and residual volume did not differ between the groups.
DISCUSSION
We described the clinical outcomes of 44 patients with macro-prolactinomas who were treated with CAB, and this is the first report on CAB treatment in Korea with a relatively large sam-ple size. Only one previous article on the efficacy of CAB in Korea has been published [20]. This study concluded that CAB could be used effectively even for invasive giant prolac-tinoma; however, its sample size was relatively small (n=10), and patients treated with other modalities such as transsphe-noidal approach during their treatment courses were excluded. In our study, the CR rate (TVR ≥50% with NP) of CAB treat-ment at the last assesstreat-ment was 70.5% (total 31/44; group 1,
n=27; group 2, n=4). This rate was not superior to the CR rate
of bromocriptine treatment (CR rate, 69.4%) that we reported previously, but this appears to have resulted from the shorter follow-up duration (15 months vs. 44 months) [16]. Previous reports of the treatment results of CAB varied widely accord-ing to different inclusion criteria, cutoff of “responsiveness,” and treatment duration [1,19,21]. In a retrospective study of 455 patients with hyperprolactinemia, TVR ≥50% was noted in 31% of 190 evaluable patients and NP was achieved in 77% of 181 patients with macroprolactinomas after a median of 28 months of CAB treatment [22]. In another retrospective study of 56 de novo patients with macroprolactinoma, significant tu-mor reduction (defined as a ≥30% reduction of the maximal tumor diameter) was achieved in 89.1% of patients, and NP was achieved in 82.1% of patients [7]. In a prospective study of 26 drug-naive patients with macroprolactinomas, NP was achieved in 80.7% of patients after 6 months of treatment, the mean volume was reduced by 67.5% after 1 year, and the mean TVR was 92.1% after 3 years of CAB treatment [23]. Our outcomes regarding TVR and NP were in line with the findings of these previous reports.
In our study, we primarily focused on discovering early in-dicators that could reliably predict long-term response to CAB. Early identification of CAB-resistant patients is valu-able considering the following facts. First, recent large studies of patients with CAB-resistant prolactinomas demonstrated
that pharmacological resistance to CAB is associated with more aggressive disease, the potential risk of malignant evolu-tion, and genetic predisposition to pituitary adenomas [15]. Second, there are concerns about the safety of long-term high-dose CAB treatment in patients with resistant prolactinomas. CAB was found to increase the frequency of valvular heart disease in a dose-dependent manner in studies of patients with Parkinson disease [24-27]. Although many studies indicated that a lower dose of CAB used in treatment for hyperprolac-tinemia or prolactinoma was not related to valvular dysfunc-tion [28], some studies reported an increased risk of tricuspid valve dysfunction in patients with prolactinomas who were treated with long-term, high-dose CAB regimens [29,30]. Fi-nally, long-term treatment with DAs may cause peritumoral fibrosis, which makes removal of the entire tumor difficult, al-though it is unclear whether this phenomenon also occurs as a result of CAB treatment [31,32].
In our study, we determined that grouping patients after 3 months of CAB treatment using TVR ≥25% and NP criteria was a potentially reliable approach. Groups with TVR ≥25% with NP, TVR ≥25% without NP, and TVR <25% at 3 months after CAB treatment could be regarded as having early respon-siveness, early partial resistance, and early resistance respec-tively, considering the different long-term CR rates of 93.1%, 50%, and 0%, respectively. We reconfirmed that TVR=25% at 3 months might be a reliable cutoff because TVR at 3 months was very strongly correlated (R>0.8) with TVR at 15 months, and the estimated regression equation revealed that a cutoff re-sistance of TVR=50% at 15 months [11] corresponded to TVR=25% at 3 months. These results are in line with our pre-vious reports demonstrating that TVR ≥25% and NP after 3 months of bromocriptine treatment are useful predictors of re-sponsiveness to DAs [16].
In addition, patients with early partial resistance should be reassessed after several months to confirm whether they ach-ieved a delayed response. Among patients with TVR ≥25% without NP at 3 months, the PRL levels of patients who achieved a CR were lower than those of patients who did not achieve a CR after 9 months. This is similar to the results ob-served for bromocriptine treatment, in which three of five pa-tients with TVR ≥25% without NP at 3 months achieved NP at 5 to 9 months [16]. Moreover, patients with giant prolacti-nomas might require a longer treatment duration to achieve NP than patients with smaller tumors even if the giant tumors exhibit sufficient responsiveness to CAB. The patients with the largest tumors and very high PRL levels displayed higher
PRL levels at 3 months than other patients, but, after 9 months of treatment, they achieved similar TVR rates and PRL levels as patients with smaller tumors. Similarly, in a study of 10 male patients with invasive giant prolactinomas (tumor diam-eter >4 cm with PRL levels >1,000 ng/mL), none achieved PRL levels <15 ng/mL at 3 months, although six patients (60%) exhibited PRL levels <15 ng/mL at the final assess-ment with continuous CAB treatassess-ment [20].
The most effective treatment modality for patients with re-sistance to standard-dose CAB remains unclear. In this situa-tion, high doses of CAB, transsphenoidal surgery, and occa-sionally radiotherapy can be applied, and temozolomide thera-py can be used for patients with malignant prolactinomas [8,19,21]. Recently, Vroonen et al. [15] reviewed the outcomes of 92 patients with resistance to CAB, defined as a failure to achieve NP on a CAB dose of 2.0 mg/wk. Of the 17 patients treated with high-dose CAB regimens (≥3.5 mg/wk) without surgery, only five patients (26.3%) achieved NP. Surgery dem-onstrated significant usefulness for controlling PRL levels and reducing CAB dose, whereas radiotherapy did not have a sig-nificant benefit. Based on these results, the authors suggested that surgery could improve the outcomes of patients with CAB resistance [15].
In our study, surgery demonstrated its usefulness for disease control and reducing CAB dose. Three of the four patients who underwent surgical interventions achieved complete tu-mor resolution on MRI with NP even though they had TVR <25% and/or no NP at 3 months. Two patients were able to discontinue CAB early, and multiple regression analysis of all the 44 patients also revealed that surgery could reduce CAB dose independently. Conversely, a higher cumulative dose of CAB did not alter TVR upon correction for treatment dura-tion. CAB inhibits PRL production in a dose-dependent man-ner [1], and resistance to DAs is occasionally overcome by high-dose CAB treatment [13,14]. Therefore, guidelines sug-gest escalating the CAB dose in patients with resistance [8,19]. This difference between our results and the results of previous reports may be due to the relatively narrow range of our CAB dose. A CAB dose exceeding 3 mg/wk is rarely necessary for prolactinomas [1,8,19], but doses as high as 11 mg/wk may be required to overcome pharmacological resistance [13,14]. In our study, the median peak CAB dose was 3 mg/wk with an interquartile range of only 1 mg, and this dose may be insuffi-cient to reverse the resistance of some patients. However, it should be noted that a markedly increased CAB dose might be associated with cardiac valve disease, as discussed previously.
Another interesting finding was that baseline IGF-1 level was associated with final restoration of sex hormones. Unlike other pituitary hormones, suppression of sex hormones can be a result of hyperprolactinemia-induced hypogonadism and compression of the gonadotropic cells by tumors [21]. How-ever, CAB treatment results in rapid normalization or marked reduction of PRL levels in most patients, and, thus, persistent subnormal sex hormone levels would primarily result from volume effects rather than hyperprolactinemia. In our study, six of the eight nonsurgically-treated male patients with hypo-gonadism at the last assessment displayed NP; thus, these pa-tients were regarded as having hypogonadism induced by compression. In terms of pituitary hormone deficits induced by tumors, GH deficiency is the second most common deficit after hypogonadism [33-36]. In our study, six patients with persistent hypogonadism despite NP had lower IGF-1 levels at diagnosis than other male patients, whereas their baseline tu-mor volume or residual volume after treatment was not larger. These findings suggest that a low IGF-1 level at diagnosis might be a useful indicator for predicting persistent hypogo-nadism induced by volume effects, which might not be direct-ly proportional to tumor size itself.
This study has some limitations. First, this study is a retro-spective, single-center study, and fully standardized protocols were not available for adjusting CAB dose or follow-up inter-val. For collection of further precise data, a prospective study with a preset protocol is warranted. Second, the prevalence of adrenal insufficiency could have been underestimated, be-cause stimulation tests were not routinely performed. Howev-er, the basal pituitary hormone test is used as an important screening test in clinical fields, and gonadal function and thy-roid function can be interpreted from the basal hormone test and symptoms/signs. Thus, the descriptive data of the basal hormone test may be a useful indicator. Third, 16 months of follow-up might be relatively short to represent long-term re-sponse. Further cumulative data collection on CAB treatment would provide us with additional information.
In conclusion, CAB treatment was very effective in two-thirds of patients with macroprolactinomas. Assessing re-sponse using TVR and NP after 3 months of treatment is a useful approach for predicting long-term response and resis-tance to CAB. When patients achieve TVR ≥25% without NP at 3 months, the assessment of resistance should be delayed for several months to rule out a delayed response, especially in patients with large tumors. Surgical treatment can help reduce CAB dose and contribute to successful disease control, and
should be considered in CAB-resistant patients.
CONFLICTS OF INTEREST
No potential conflict of interest relevant to this article was re-ported.
REFERENCES
1. Gillam MP, Molitch ME, Lombardi G, Colao A. Advances in the treatment of prolactinomas. Endocr Rev 2006;27: 485-534.
2. Colao A. Pituitary tumours: the prolactinoma. Best Pract Res Clin Endocrinol Metab 2009;23:575-96.
3. Colao A, Lombardi G. Growth-hormone and prolactin ex-cess. Lancet 1998;352:1455-61.
4. Daly AF, Rixhon M, Adam C, Dempegioti A, Tichomirowa MA, Beckers A. High prevalence of pituitary adenomas: a cross-sectional study in the province of Liege, Belgium. J Clin Endocrinol Metab 2006;91:4769-75.
5. Oh MC, Kunwar S, Blevins L, Aghi MK. Medical versus surgical management of prolactinomas. Neurosurg Clin N Am 2012;23:669-78.
6. Colao A, Savastano S. Medical treatment of prolactino-mas. Nat Rev Endocrinol 2011;7:267-78.
7. Di Sarno A, Landi ML, Cappabianca P, Di Salle F, Rossi FW, Pivonello R, Di Somma C, Faggiano A, Lombardi G, Colao A. Resistance to cabergoline as compared with bro-mocriptine in hyperprolactinemia: prevalence, clinical def-inition, and therapeutic strategy. J Clin Endocrinol Metab 2001;86:5256-61.
8. Casanueva FF, Molitch ME, Schlechte JA, Abs R, Bonert V, Bronstein MD, Brue T, Cappabianca P, Colao A, Fahl-busch R, Fideleff H, Hadani M, Kelly P, Kleinberg D, Laws E, Marek J, Scanlon M, Sobrinho LG, Wass JA, Gi-ustina A. Guidelines of the Pituitary Society for the diag-nosis and management of prolactinomas. Clin Endocrinol (Oxf) 2006;65:265-73.
9. Delgrange E, Maiter D, Donckier J. Effects of the dopa-mine agonist cabergoline in patients with prolactinoma in-tolerant or resistant to bromocriptine. Eur J Endocrinol 1996;134:454-6.
10. Colao A, Di Sarno A, Sarnacchiaro F, Ferone D, Di Renzo G, Merola B, Annunziato L, Lombardi G. Prolactinomas resistant to standard dopamine agonists respond to chronic cabergoline treatment. J Clin Endocrinol Metab 1997;82:
876-83.
11. Molitch ME. Pharmacologic resistance in prolactinoma patients. Pituitary 2005;8:43-52.
12. Primeau V, Raftopoulos C, Maiter D. Outcomes of transs-phenoidal surgery in prolactinomas: improvement of hor-monal control in dopamine agonist-resistant patients. Eur J Endocrinol 2012;166:779-86.
13. Ono M, Miki N, Kawamata T, Makino R, Amano K, Seki T, Kubo O, Hori T, Takano K. Prospective study of high-dose cabergoline treatment of prolactinomas in 150 patients. J Clin Endocrinol Metab 2008;93:4721-7.
14. Ono M, Miki N, Amano K, Kawamata T, Seki T, Makino R, Takano K, Izumi S, Okada Y, Hori T. Individualized high-dose cabergoline therapy for hyperprolactinemic infertility in women with micro- and macroprolactinomas. J Clin En-docrinol Metab 2010;95:2672-9.
15. Vroonen L, Jaffrain-Rea ML, Petrossians P, Tamagno G, Chanson P, Vilar L, Borson-Chazot F, Naves LA, Brue T, Gatta B, Delemer B, Ciccarelli E, Beck-Peccoz P, Caron P, Daly AF, Beckers A. Prolactinomas resistant to standard doses of cabergoline: a multicenter study of 92 patients. Eur J Endocrinol 2012;167:651-62.
16. Yang MS, Hong JW, Lee SK, Lee EJ, Kim SH. Clinical management and outcome of 36 invasive prolactinomas treated with dopamine agonist. J Neurooncol 2011;104: 195-204.
17. Di Chiro G, Nelson KB. The volume of the sella turcica. Am J Roentgenol Radium Ther Nucl Med 1962;87:989-1008.
18. Frieze TW, Mong DP, Koops MK. “Hook effect” in pro-lactinomas: case report and review of literature. Endocr Pract 2002;8:296-303.
19. Melmed S, Casanueva FF, Hoffman AR, Kleinberg DL, Montori VM, Schlechte JA, Wass JA; Endocrine Society. Diagnosis and treatment of hyperprolactinemia: an Endo-crine Society clinical practice guideline. J Clin Endocrinol Metab 2011;96:273-88.
20. Cho EH, Lee SA, Chung JY, Koh EH, Cho YH, Kim JH, Kim CJ, Kim MS. Efficacy and safety of cabergoline as first line treatment for invasive giant prolactinoma. J Kore-an Med Sci 2009;24:874-8.
21. Iglesias P, Diez JJ. Macroprolactinoma: a diagnostic and therapeutic update. QJM 2013;106:495-504.
22. Verhelst J, Abs R, Maiter D, van den Bruel A, Vandeweghe M, Velkeniers B, Mockel J, Lamberigts G, Petrossians P, Coremans P, Mahler C, Stevenaert A, Verlooy J,
Raftopou-los C, Beckers A. Cabergoline in the treatment of hyperp-rolactinemia: a study in 455 patients. J Clin Endocrinol Metab 1999;84:2518-22.
23. Colao A, Di Sarno A, Landi ML, Scavuzzo F, Cappabianca P, Pivonello R, Volpe R, Di Salle F, Cirillo S, Annunziato L, Lombardi G. Macroprolactinoma shrinkage during cab-ergoline treatment is greater in naive patients than in pa-tients pretreated with other dopamine agonists: a prospec-tive study in 110 patients. J Clin Endocrinol Metab 2000; 85:2247-52.
24. Schade R, Andersohn F, Suissa S, Haverkamp W, Garbe E. Dopamine agonists and the risk of cardiac-valve regurgita-tion. N Engl J Med 2007;356:29-38.
25. Zanettini R, Antonini A, Gatto G, Gentile R, Tesei S, Pez-zoli G. Valvular heart disease and the use of dopamine ag-onists for Parkinson’s disease. N Engl J Med 2007;356:39-46.
26. Corvol JC, Anzouan-Kacou JB, Fauveau E, Bonnet AM, Lebrun-Vignes B, Girault C, Agid Y, Lechat P, Isnard R, Lacomblez L. Heart valve regurgitation, pergolide use, and parkinson disease: an observational study and meta-analy-sis. Arch Neurol 2007;64:1721-6.
27. Antonini A, Poewe W. Fibrotic heart-valve reactions to do-pamine-agonist treatment in Parkinson’s disease. Lancet Neurol 2007;6:826-9.
28. Valassi E, Klibanski A, Biller BM. Clinical review: poten-tial cardiac valve effects of dopamine agonists in hyperp-rolactinemia. J Clin Endocrinol Metab 2010;95:1025-33. 29. Colao A, Galderisi M, Di Sarno A, Pardo M, Gaccione M,
D’Andrea M, Guerra E, Pivonello R, Lerro G, Lombardi
G. Increased prevalence of tricuspid regurgitation in pa-tients with prolactinomas chronically treated with cabergo-line. J Clin Endocrinol Metab 2008;93:3777-84.
30. Wakil A, Rigby AS, Clark AL, Kallvikbacka-Bennett A, Atkin SL. Low dose cabergoline for hyperprolactinaemia is not associated with clinically significant valvular heart disease. Eur J Endocrinol 2008;159:R11-4.
31. Saeki N, Nakamura M, Sunami K, Yamaura A. Surgical indication after bromocriptine therapy on giant prolactino-mas: effects and limitations of the medical treatment. En-docr J 1998;45:529-37.
32. Menucci M, Quinones-Hinojosa A, Burger P, Salvatori R. Effect of dopaminergic drug treatment on surgical findings in prolactinomas. Pituitary 2011;14:68-74.
33. Regal M, Paramo C, Sierra SM, Garcia-Mayor RV. Preva-lence and incidence of hypopituitarism in an adult Cauca-sian population in northwestern Spain. Clin Endocrinol (Oxf) 2001;55:735-40.
34. Dekkers OM, Hammer S, de Keizer RJ, Roelfsema F, Schutte PJ, Smit JW, Romijn JA, Pereira AM. The natural course of non-functioning pituitary macroadenomas. Eur J Endocrinol 2007;156:217-24.
35. Karavitaki N, Collison K, Halliday J, Byrne JV, Price P, Cudlip S, Wass JA. What is the natural history of nonoper-ated nonfunctioning pituitary adenomas? Clin Endocrinol (Oxf) 2007;67:938-43.
36. Iglesias P, Bernal C, Villabona C, Castro JC, Arrieta F, Diez JJ. Prolactinomas in men: a multicentre and retro-spective analysis of treatment outcome. Clin Endocrinol (Oxf) 2012;77:281-7.