저작자표시-비영리-변경금지 2.0 대한민국 이용자는 아래의 조건을 따르는 경우에 한하여 자유롭게 l 이 저작물을 복제, 배포, 전송, 전시, 공연 및 방송할 수 있습니다. 다음과 같은 조건을 따라야 합니다: l 귀하는, 이 저작물의 재이용이나 배포의 경우, 이 저작물에 적용된 이용허락조건 을 명확하게 나타내어야 합니다. l 저작권자로부터 별도의 허가를 받으면 이러한 조건들은 적용되지 않습니다. 저작권법에 따른 이용자의 권리는 위의 내용에 의하여 영향을 받지 않습니다. 이것은 이용허락규약(Legal Code)을 이해하기 쉽게 요약한 것입니다. Disclaimer 저작자표시. 귀하는 원저작자를 표시하여야 합니다. 비영리. 귀하는 이 저작물을 영리 목적으로 이용할 수 없습니다. 변경금지. 귀하는 이 저작물을 개작, 변형 또는 가공할 수 없습니다.
3
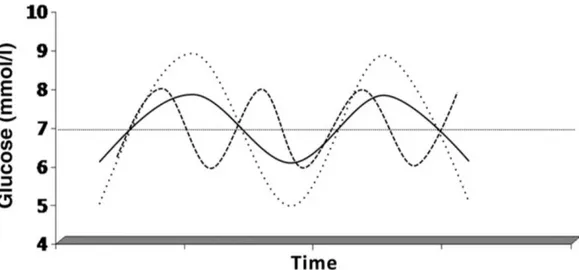
Figure 1. Three situation of glycemic swing. Mean and area under the curve are identical in the three situations. (Adapted from DeVries et al.[2]
)
4
Figure 2. A and B has identical mean and standard deviation of glucose throughout a 20-h
period, but markedly different glucose variability. (
Adapted from Siegelaar et al.[3])Figure 3. M-value of Schlichtkrull.
W, difference between maximum and minimum BS values for the 24-h period. (
Adapted from Service et al.[6])5
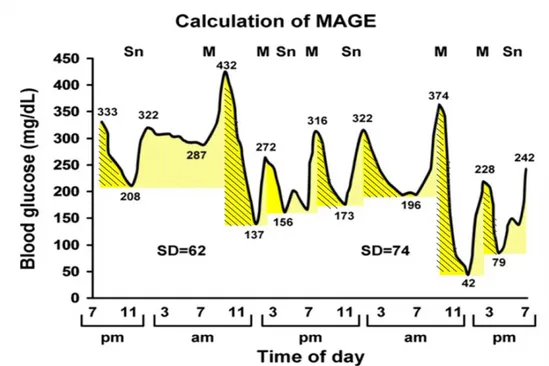
Figure 4. Continuous blood glucose analysis for 48 hours in a patient with type 1 diabetes.
The qualifying excursions are shown as pairs of diagonal stripes and solid, beginning with
the leftmost deflection, 333 to 208 mg/dL. The inflection component of that excursion is 208
to 432 mg/dL, which incorporates an intermediary excursion. The latter fails to qualify as an
excursion on its own because one limb (322 to 287 mg/dL) fails to exceed 1 SD for that 24-h
period. Note the small difference in SD from day 1 to day 2. Whether MAGE is calculated
from the descending (184 mg/dL) or ascending (171 mg/dL) limbs, the values are similar.
M, meal; Sn, snack. (
Adapted from Service et al.[6])7
9
10
16
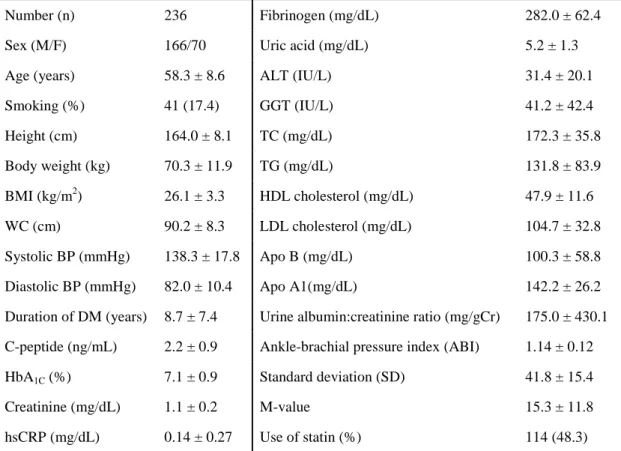
Table 1. Baseline clinical and laboratory characteristics of the subjects
Number (n) 236 Fibrinogen (mg/dL) 282.0 ± 62.4
Sex (M/F) 166/70 Uric acid (mg/dL) 5.2 ± 1.3
Age (years) 58.3 ± 8.6 ALT (IU/L) 31.4 ± 20.1
Smoking (%) 41 (17.4) GGT (IU/L) 41.2 ± 42.4 Height (cm) 164.0 ± 8.1 TC (mg/dL) 172.3 ± 35.8 Body weight (kg) 70.3 ± 11.9 TG (mg/dL) 131.8 ± 83.9 BMI (kg/m2) 26.1 ± 3.3 HDL cholesterol (mg/dL) 47.9 ± 11.6 WC (cm) 90.2 ± 8.3 LDL cholesterol (mg/dL) 104.7 ± 32.8 Systolic BP (mmHg) 138.3 ± 17.8 Apo B (mg/dL) 100.3 ± 58.8 Diastolic BP (mmHg) 82.0 ± 10.4 Apo A1(mg/dL) 142.2 ± 26.2 Duration of DM (years) 8.7 ± 7.4 Urine albumin:creatinine ratio (mg/gCr) 175.0 ± 430.1 C-peptide (ng/mL) 2.2 ± 0.9 Ankle-brachial pressure index (ABI) 1.14 ± 0.12 HbA1C (%) 7.1 ± 0.9 Standard deviation (SD) 41.8 ± 15.4
Creatinine (mg/dL) 1.1 ± 0.2 M-value 15.3 ± 11.8 hsCRP (mg/dL) 0.14 ± 0.27 Use of statin (%) 114 (48.3) Values are presented as n (%) or mean ± standard deviation (S.D.).
BMI, body mass index; WC, waist circumference; Systolic BP, Systolic blood pressure; Diastolic BP, Diastolic blood pressure; HbA1C, hemoglobin A1C; hsCRP, High sensitivity C-reactive protein ; ALT,
Alanine transaminase; GGT, Gamma-glutamyl transpeptidase; TC, Total cholesterol; TG, Triglyceride; HDL-Cholesterol, high-density lipoprotein cholesterol; LDL-Cholesterol, low-density lipoprotein cholesterol; Apo B, Apolipoprotein B; Apo A1, Apolipoprotein A1.
17
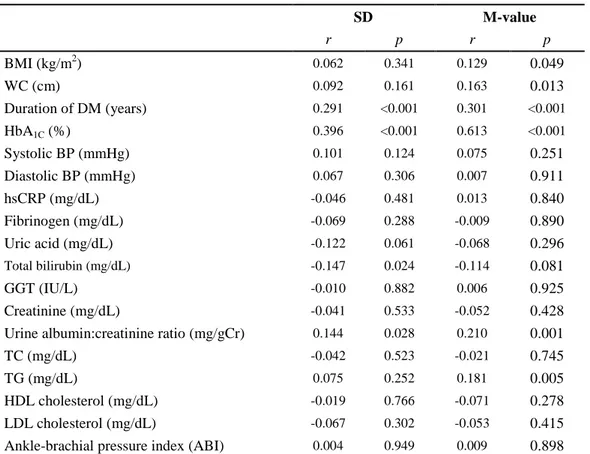
Table 2. Pearson's correlation between indices of glycemic variability and cardiovascular
risk factors
SD M-value r p r p BMI (kg/m2) 0.062 0.341 0.129 0.049 WC (cm) 0.092 0.161 0.163 0.013 Duration of DM (years) 0.291 <0.001 0.301 <0.001 HbA1C (%) 0.396 <0.001 0.613 <0.001 Systolic BP (mmHg) 0.101 0.124 0.075 0.251 Diastolic BP (mmHg) 0.067 0.306 0.007 0.911 hsCRP (mg/dL) -0.046 0.481 0.013 0.840 Fibrinogen (mg/dL) -0.069 0.288 -0.009 0.890 Uric acid (mg/dL) -0.122 0.061 -0.068 0.296 Total bilirubin (mg/dL) -0.147 0.024 -0.114 0.081 GGT (IU/L) -0.010 0.882 0.006 0.925 Creatinine (mg/dL) -0.041 0.533 -0.052 0.428 Urine albumin:creatinine ratio (mg/gCr) 0.144 0.028 0.210 0.001TC (mg/dL) -0.042 0.523 -0.021 0.745
TG (mg/dL) 0.075 0.252 0.181 0.005
HDL cholesterol (mg/dL) -0.019 0.766 -0.071 0.278 LDL cholesterol (mg/dL) -0.067 0.302 -0.053 0.415 Ankle-brachial pressure index (ABI) 0.004 0.949 0.009 0.898 SD, standard deviation; BMI, body mass index; WC, waist circumference; Systolic BP, Systolic blood pressure; Diastolic BP, Diastolic blood pressure; HbA1C, hemoglobin A1C; hsCRP, High sensitivity
C-reactive protein; ALT, Alanine transaminase; GGT, Gamma-glutamyl transpeptidase; TC, Total cholesterol; TG, Triglyceride; HDL-Cholesterol, high-density lipoprotein cholesterol; LDL-Cholesterol, low-density lipoprotein cholesterol.
18
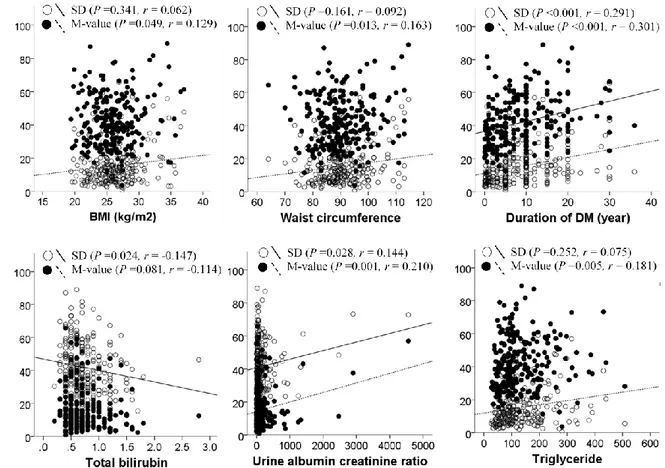
Figure 6. Plots of Pearson's correlation between indices of glycemic variability and
cardiovascular risk factors.
19
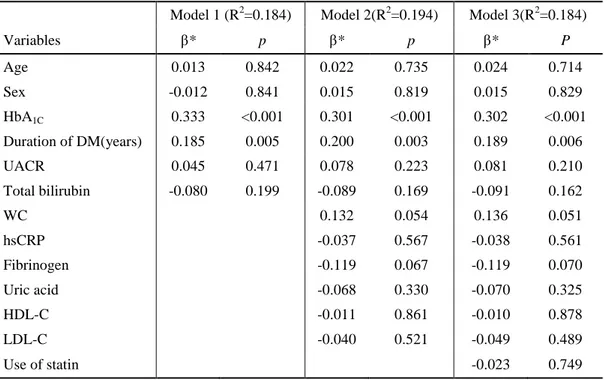
Table 3. Hierarchical regression analysis between indices of standard deviation and
cardiovascular risk factors
Model 1 (R2=0.184) Model 2(R2=0.194) Model 3(R2=0.184)
Variables β* p β* p β* P Age 0.013 0.842 0.022 0.735 0.024 0.714 Sex -0.012 0.841 0.015 0.819 0.015 0.829 HbA1C 0.333 <0.001 0.301 <0.001 0.302 <0.001 Duration of DM(years) 0.185 0.005 0.200 0.003 0.189 0.006 UACR 0.045 0.471 0.078 0.223 0.081 0.210 Total bilirubin -0.080 0.199 -0.089 0.169 -0.091 0.162 WC 0.132 0.054 0.136 0.051 hsCRP -0.037 0.567 -0.038 0.561 Fibrinogen -0.119 0.067 -0.119 0.070 Uric acid -0.068 0.330 -0.070 0.325 HDL-C -0.011 0.861 -0.010 0.878 LDL-C -0.040 0.521 -0.049 0.489 Use of statin -0.023 0.749
*, partial regression coefficient; R2, Adjusted R-squared
HbA1C, hemoglobin A1C; UACR, Urine albumin:creatinine ratio; WC, waist circumference; hsCRP, High
sensitivity C-reactive protein; HDL-C, high-density lipoprotein cholesterol; LDL-C, low-density lipoprotein cholesterol
20
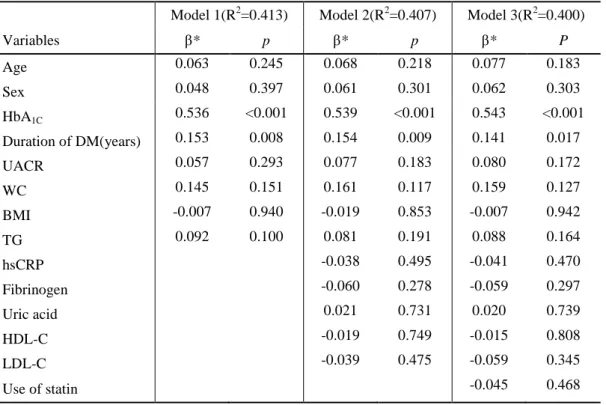
Table 4. Hierarchical regression analysis between indices of M-value and cardiovascular
risk factors
Model 1(R2=0.413) Model 2(R2=0.407) Model 3(R2=0.400)
Variables β* p β* p β* P Age 0.063 0.245 0.068 0.218 0.077 0.183 Sex 0.048 0.397 0.061 0.301 0.062 0.303 HbA1C 0.536 <0.001 0.539 <0.001 0.543 <0.001 Duration of DM(years) 0.153 0.008 0.154 0.009 0.141 0.017 UACR 0.057 0.293 0.077 0.183 0.080 0.172 WC 0.145 0.151 0.161 0.117 0.159 0.127 BMI -0.007 0.940 -0.019 0.853 -0.007 0.942 TG 0.092 0.100 0.081 0.191 0.088 0.164 hsCRP -0.038 0.495 -0.041 0.470 Fibrinogen -0.060 0.278 -0.059 0.297 Uric acid 0.021 0.731 0.020 0.739 HDL-C -0.019 0.749 -0.015 0.808 LDL-C -0.039 0.475 -0.059 0.345 Use of statin -0.045 0.468
*, partial regression coefficient; R2, Adjusted R-squared
HbA1C, hemoglobin A1C; UACR, Urine albumin:creatinine ratio; WC, waist circumference; BMI,
body mass index; TG, Triglyceride; hsCRP, High sensitivity C-reactive protein; HDL-C, high-density lipoprotein cholesterol; LDL-C, low-density lipoprotein cholesterol.
21
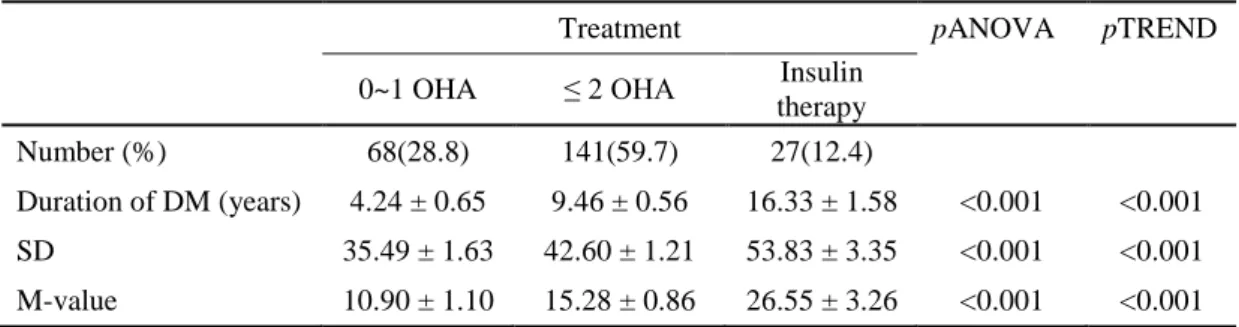
Table 5. Analysis of variance (ANOVA) for comparing mean values of glycemic variability
indices across grade of diabetes treatment
Treatment pANOVA pTREND
0~1 OHA ≤ 2 OHA Insulin therapy
Number (%) 68(28.8) 141(59.7) 27(12.4)
Duration of DM (years) 4.24 ± 0.65 9.46 ± 0.56 16.33 ± 1.58 <0.001 <0.001 SD 35.49 ± 1.63 42.60 ± 1.21 53.83 ± 3.35 <0.001 <0.001 M-value 10.90 ± 1.10 15.28 ± 0.86 26.55 ± 3.26 <0.001 <0.001 Values are presented as mean ± standard error (S.E.).
OHA, Oral hypoglycemic agent; SD, standard deviation pANOVA, p value by ANOVA
pTREND, p value by the test for linear trend
Table 6. Analysis of variance (ANOVA) for comparing mean values of glycemic variability
indices across
Framingham Risk Score10-YR CHD (%) pANOVA pTREND
Low risk Moderate risk High risk Number (%) 80 (33.9) 92 (39.0) 61 (25.8)
SD 39.82 ± 1.65 42.99 ± 1.57 42.14 ± 2.09 0.384 0.371 M-value 13.76 ± 1.25 16.24 ± 1.25 15.43 ± 1.53 0.376 0.403 CHD, Coronary heart disease; SD, standard deviation; Low risk, 10-YR CHD <10% ; Moderate risk, 10% ≤10-YR CHD<20%; High risk, 10-YR CHD ≥20%.
pANOVA, p value by ANOVA
22