Electromagnetic Field Analysis on Surge Response of 500 kV EHV Single Circuit
Transmission Tower in Lightning Protection System
using Neural Networks
Chamni Jaipradidtham
Department of Electrical Engineering , Faculty of Engineering , Kasem Bundit University, Pattanakarn Rd., Bangkok 10250, Thailand
Tel: (+66)0-2321-6930-9 , Fax:(+66)0-2321-4444 , E-mail: [email protected]
Abstract : This paper presents a technique for electromagnetic field analysis on surge response due to Mid-span back-flashovers
effects in lightning protection system of 500 kV EHV single circuit transmission tower by the neural networks method. These analyses are based on modeling lightning return stroke as well as on coupling the electromagnetic fields of the stroke channel to the line. The ground conductivity influences both the electric field as well as the coupling mechanism and hence the magnitude and wave shape of the induced voltage. The technique can be used to analyzed the corona voltage effect, the effective of stroke to the span tower, the surge impedance of transmission lines. The maximum voltage from flashovers effects in the lines. The model is compatible with general electromagnetic transients programs such as the ATP-EMTP. The simulation results show that this study analyses for time-domain with those produced by a cascade multi-section model, the surge impedance of a full-sized tower hit directly by a lightning stroke is discussed.
Keywords : electromagnetic field analysis , 500 kV EHV transmission tower , lightning protection system , back-flashovers effects
1. INTRODUCTION
The overhead transmission lines and stations generate electromagnetic fields, which are taken into consideration as part of the overall design characteristics. The advent and increasing use of higher voltage lines has increased the rela-tive importance of field effects such as induced voltages and currents in conducting bodies. Analysis of a lightning stroke to a tower (transmission line) is an electromagnetic problem. Although the analysis often starts from a field point of view, it is usually cast in circuit terms, differently defined impedances are used to characterize tower response to lightning. Tower surge response characteristics are important factor in analy-zing lightning performance of transmission lines. The elec-tromagnetic field around parallel conductors or a non-horizontal conductor above a ground plane. Parameters of the modeled transmission line for parallel conductors or a horizontal conductor above a ground plane can be determined on physical basis. In the present paper can be summarized as follows[1]. A sequence of lightning strokes is randomly generated[2-3]. The overvoltage originated by each one on a distribution line is then calculated; this information is used to train an artificial neural network(ANN), whose validation is performed by using a new sequence of lightning strokes. This paper presents the lightning overvoltages of a simulated 500 kV EHV single circuit transmission tower hit by lightning, are analyzed by a modified the thin-wire time-domain analysis (TWTDA)code that includes a recently proposed flashover model [3]. A similar analysis is also carried out by ATP-EMTP.
2. THE ANALYSIS
2.1 Structures of 500 kV Transmission lines
The following are the assumed characteristic of the line for which outage rate performance will be determined. [1] Conductor : 4 Bundle per phase x 795 MCM 54/7 ACSR(Condor) Spacing between = 45.7 cm Diameter = 2.773 cm Ruling span = 420 m Ultimate strength = 12,800 kg Weight = 1.52 kg/m
Wind span = 500 m
Shield wire: 3/8″ EHS, Class A, Galvanized steel
Number of wires = 2 per tower Shielding angle = -5° to outer phases Ultimate strength = 6985 kg Diameter = 9.1444 mm Weight = 0.406 kg/m Insulator : Type Suspension, ball and socket ANSI Class 52-8 and ANSI Class 52-11 Based on max. conductor tension of 22% rated tensile strength with wind pressure of 86 kg/m2 Grounding system : ground resistance 10 ohms or less A. Stub angle to rebar : used in all cases B. Ground rods : used in all cases, one ground rod at each tower leg
Lightning outage rate : Less than 0.05 per 100 km per year Right-of-way width : 70 meters for each line
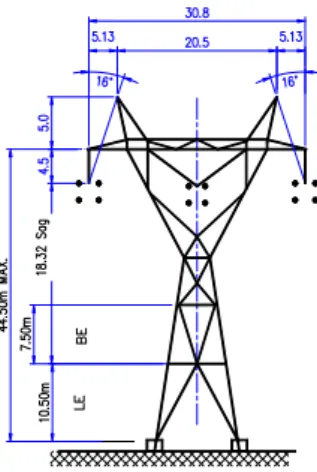
Fig. 1 Structures characteristic of 500 kV EHV single circuit transmission tower of type SL0° :Suspension
ICCAS2005 June 2-5, KINTEX, Gyeonggi-Do, Korea
2.2 Artificial Neural Networks
An artificial neural network (ANN) can be used to solve
problems that have proved to be difficult with conventional algorithms. The basic unit of an ANN is the neuron. A neuron model has a set of input that are weighted and combined between them to generate the total input see in Fig. 2and Fig.3 A transfer function determines the state of activation or the output signal of the neuron from the total input and the previous state of activation. The output signal is sent to other units of the network through unidirectional communication channels. An artificial neural network will be able to carry out a task by an adequate selection of the architecture. In general, the architecture may consists of 3 parts , the input layer , the output layer and one or several hidden layers[2].Fig. 2 Processing Elements input and outputs of ANN
Fig.3 Feedforward multilayer architecture
Aneural network that could calculate the lightning back-flashovers rate of overhead distribution lines. This goal will be achieved by using several algorithms to train the neural networks. At the end they should be capable of reproducing the same results that the original algorithms. The backprop-agation algorithm is based on an iterative process; during a training session two patterns, input and target, are presented to the network. The input pattern produce output patterns at each neuron of each layer. The speed of this process will depend on several factors, such as the learning rule, the transfer function of neuron networks or the initialization of the network.
2.3 Electromagnetic Fields by the Return Stroke
The analysis of electric field of a transmission line at ground
level is a considerable simplification of the general method of field analysis. In fact , the electric field on a flat horizontal ground may be represented by a vertical vector. By assuming that the ground is a perfect conductor, the vertical component
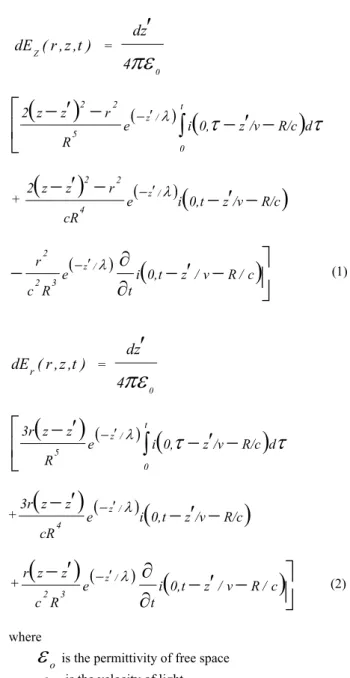
of electrical field dEZ (r,z,t) and the horizontal component of electric field dEr (r,z,t) due to an infinitesimal length
d ′
z
at heightz′
carrying current i (z′
,t) are calculated at a generalpoint P(r,φ, z) by the following equations. These equations
representing the modified transmission line(MTL) model for lightning return stroke in time domain are [4]
)t
,z
,r
(
dE
Z = 04
z
d
πε
′
(
)
(
)
(
)
−
′
−
−
′
−
∫
′ − t 0 / z 5 2 2d
R/c
/v
z
0,
i
e
R
r
z
z
2
λ
τ
τ
+(
)
e
(
)
i
(
0,
t
z
/v
R/c
)
cR
r
z
z
2
z/ 4 2 2−
′
−
−
′
−
−′λ
(
)
(
)
−
′
−
∂
∂
−
− ′i
0,
t
z
/
v
R
/
c
t
e
R
c
r
z / 3 2 2λ
(1)
)t
,z
,r
(
dE
r
= 04
z
d
πε
′
(
)
(
)
(
)
−
′
−
′
−
∫
′ − t 0 / z 5e
i
0,
z
/v
R/c
d
R
z
z
3r
λ
τ
τ
+(
)
e
(
)
i
(
0,
t
z
/v
R/c
)
cR
z
z
3r
z / 4−
′
−
′
−
− ′λ
+
(
)
(
)
(
)
−
′
−
∂
∂
′
−
− ′i
0,
t
z
/
v
R
/
c
t
e
R
c
z
z
r
z/ 3 2λ
(2) where
ε
o
is the permittivity of free space c is the velocity of lightR is the distance from the current element to the obser-vation point by R =
r
2+
(
z
−
z
′
)
2To find the total field the equations(1)and(2) are integrated along the channel and its image is shown in Fig 4.
Based on the second model, the horizontal component of the electric field of the return stroke lightning channel has been given as [5]:
(
x
h,
)
E
xi =∫
( )
∫
( )
∂
∂
+
∂
∂
hp p 0 h 0 i Y i zx
z,
dz
t
B
x
z,
dz
E
x
(3) X 1 X X n Inputs Weights Wาา W21 Wn1 Summation Function Σ Transfer function ∫Processing Element (PE)
Output path(Y) Y = f(net ) Y = f(∑w Y ) i j j j 2 i i i 1 2 3 4 1 2 2 1 3 n m k 1 X 2 X 3 X n X 1 o 2 o k o INPUT LAYER OUTPUT HIDDEN LAYER LAYER
1638
where
h
p
is transmission line tower height and Eq.(3) was derived from Maxwell’s equation(
∇
xE = -∂
B ∂
/
t
), which is valid only when both the E-and B-field are originated from the same source. Putting Faraday’s law in the form of one of the Maxwell’s equations: V =t
∂
∂
−
ϕ
=∫
∂
∂
−
SdS
.
B
t
(4) or∫
E
m.
dl
=∫
(
∇
)
∂
∂
−
S.
A
dS
t
=∂
∫
∂
−
Adl
t
(5)For a vertical stroke, the electric field Em
m
E
=-t
A
∂
∂
(6) whereA is the vector potential created by the current of the return stroke
Fig. 4 Models of lightning return stroke and image
2.4. Surge response of transmission tower and Establishing tower top voltage
The required voltage from conductor to tower top. A very brief iteration yields the tower top voltage. the vertical and the horizontal return stroke current starts from the top of the tower at t = 0,
V
Top
required to produce flashover, at a given time.cf
1
V
V
Top
fo
−
=
(7) andcf
z
z
z
a a=
1+
2 11 (8) where Vfo is flashover voltage (kV) cf is coupling factor of conductor
z
1a, z
2a, z
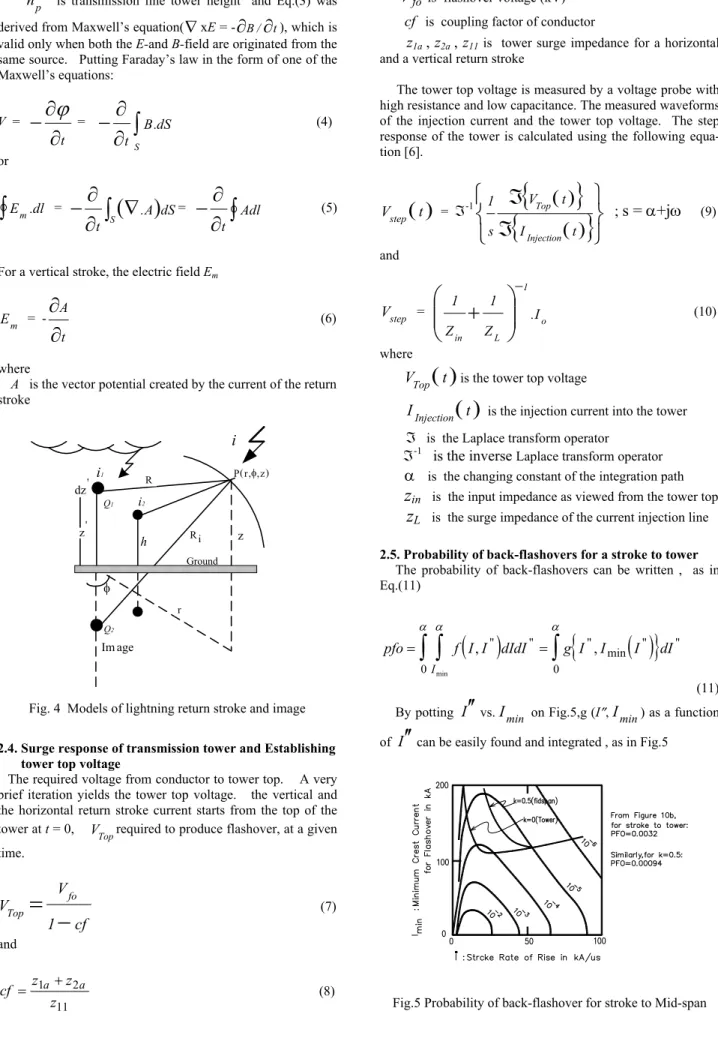
11 is tower surge impedance for a horizontal and a vertical return strokeThe tower top voltage is measured by a voltage probe with high resistance and low capacitance. The measured waveforms of the injection current and the tower top voltage. The step response of the tower is calculated using the following equa-tion [6].
( )
t
V
step
= ℑ-1{
( )
}
( )
{
}
ℑ
ℑ
t
I
t
V
s
1
Injection Top;
s = α+jω
(9)
andstep
V
= o 1 L inI.
Z
1
Z
1
−
+
(10) where
V
Top
( )
t
is the tower top voltage
I
Injection
( )
t
is the injection current into the towerℑ is the Laplace transform operator
ℑ-1
is the inverse Laplace transform operator
α
is the changing constant of the integration pathz
in is the input impedance as viewed from the tower topz
L is the surge impedance of the current injection line2.5. Probability of back-flashovers for a stroke to tower
The probability of back-flashovers can be written , as in Eq.(11)
( )
{
( )
}
pfo
f I I dIdI
g I I
I
dI
I=
∫
∫
,
" "=
∫
",
min " " min 0 0 α α α(11)
By potting
I ′′
vs.I
min
on Fig.5,g (I″,I
min
) as a function ofI ′′
can be easily found and integrated , as in Fig.5Fig.5 Probability of back-flashover for stroke to Mid-span
age
Im
'
z
'
dz
R
φ)z
,
,r
(
P
φr
i
R
Ground
z
i
Q1 Q2 i1 i2 h1639
3. ATP-EMTP SIMULATION
The simulation results have been carried out based on
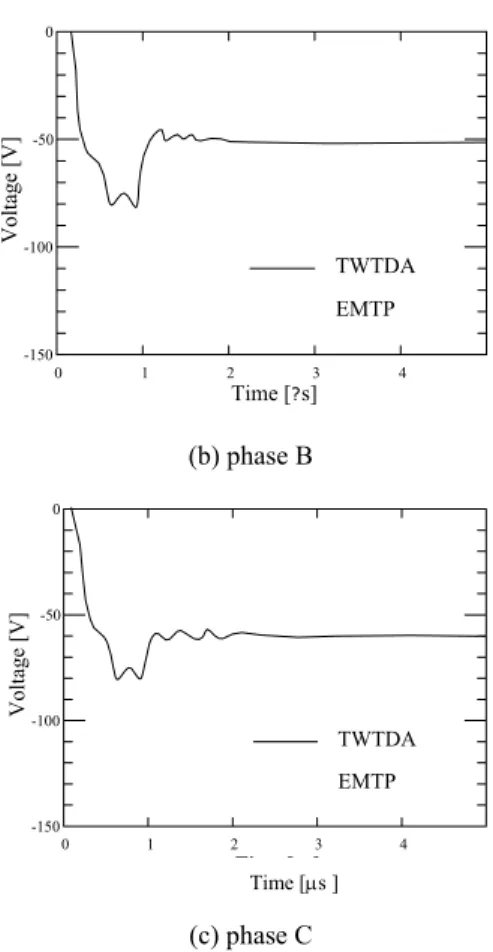
EMTP program. In these simulations,the probability parameter estimating due to Mid-span back-flashovers effects for light-ning overvoltage analysis on 500 kV EHV transmission tower using ANN. The 3-phase transmission system consists of single circuit of type SL0° Suspension. It is able to transmit the power from the Mae Moh3(MM3)power plant in Lampang province to substation plant at Tha Tako in Nakornsawan province about 335 km far. The step response of the tower in this calculation is represented in the frequency domain. The time domain expression can be derived by frequency to time-domain conversion using the numerical Laplace transform in Eq.(9). The overvoltages computed by ATP-EMTP agree well with those computed by the thin-wire time domain analysis of (TWTDA) before the back-flashover. Flashovers originated by direct and indirect strokes are presented separately. It is evident that the differences between values obtained from algorithms and ANN are very small for direct strokes.(a) Upper phase
(b) Lower phase
Fig. 6 Measured and simulated waveforms incident magnetic field with MTL using ANN
(a) phase A
(b) phase B
(c) phase C
Fig.7 Measured and simulated waveforms of lightning overvoltages by TWTDA and ATP-EMTP using ANN
4. CONCLUSIONS
This paper has proposed of ANN to the study of the
ligh-tning performance of unshielded overhead distribution the lines. The simulation results show that this estimating such lightning overvoltage on lines are accurately and are power system stability for 500 kV lines. As a result of analysis, the probability of causing a Mid-span back-flashover corresponds during about 2 µs after of all the lightning faults on the single circuit unbalanced insulation lines, and the results of Fig. 6-7 shows the ANN were trained assuming that the velocity of the strokes had a uniform distribution between 1000 and 15000 km/s. The difference between the waveforms computed by TWTDA and those computed by ATP-EMTP.R
EFERENCES[1] EGAT, “Contract documents of 500 kV transmission line Mae Moh3 -Tha-Tako”, Bangkok, Sept.,1983.
[2] J.A. Martinez and F. Gonzalez, “ Statistical evaluation of lightning overvoltages on overhead distribution lines using neural network”, IEEE PES 2001,pp1133-1138. [3] T. Mozumi and et. al. “ Numerical elect. Field analysis of archorn voltages during a back-flashover on a 500 kV. ”, IEEE TP.Deliv., vol.18, No.1 ,pp. 207-213, Jan. 2003. [4] P.Durai Kannu and Joy Thomas M., “Influence of ground conductivity on the over voltages induced on overhead power distribution.”, IEEE TP.Deliv., pp. 949-954, 2000. [5] P.Chowdhuri, S.Li and P.Yan, “Review of research on lightning-induced voltages on an overhead line.”, IEE
Proc.-Gen. Tr.Dis.,Vol.148, No.1, pp.91- 95, Jan. 2001.
[6] H. Motoyama and et al., “Analytical and experimental study on surge response.”,IEEE T.P. Deliv., vol.15, 2000.
2 4 6 8 0 -600 -200 t [ms] -800 -400 0 200 400 800 600 [k] 2 4 6 8 0 -600 -200 t [ms] -800 -400 0 200 400 800 600 [k] Volt age [V] 0 -50 -100 -150 0 1 2 3 4 Time [?s] TWTDA EMTP [µs] Volt age [V] 0 -50 -100 -150 0 1 2 3 4 Time [?s] TWTDA EMTP Vo ltag e [V ] 0 -50 -100 -150 0 1 2 3 4 Time [?s] TWTDA EMTP Time [µs ]