PUBLIC HEALTH WEEKLY REPORT, PHWR
Vol.11 No.4
2018
www.cdc.go.kr
pISSN 2005-811X
eISSN 2586-0860
CONTENTS
CONTENTS
0088
당뇨병 관련 한국인 참조에피유전체 정보 공개 및 활용0093
2016년 진단용 방사선 발생장치 관리 현황0097
2016-2017년 절기 한랭질환 감시체계 운영결과0103
주요 감염병 통계 환자감시 : 전수감시, 표본감시 병원체감시 : 인플루엔자 및 호흡기바이러스 급성설사질환, 엔테로바이러스당뇨병 관련 한국인 참조에피유전체
정보 공개 및 활용
Data release and its utilization of diabetes-related Korean Reference Epigenome
Lee Kibaick, Choi Nak-Hyun, Park Soo-Jung, Kim Bong-Jo
Division of Genome Research, Center for Genome Science, KNIH, KCDC
Background: The Korea National Institute of Health (KNIH) has released 37 sets of diabetes-related epigenome on the International Human Epigenome Consortium (IHEC) data portal from 2015 until 2017. Epigenome is a complete set of epigenetic modifications that are reversible modifications on a genome or particular proteins, which affect the gene expression without altering the genome sequence.
Current status: Since 2012, KNIH has been collaborating with IHEC for the purpose of promoting human health and preventing diseases. The main goal of KNIH’s Korea Epigenome Project (KEP) is to produce 50 types of reference epigenomes involving primary cells related to chronic diseases such as diabetes, obesity, and kidney disorders until 2018. IHEC is planning Phase II that includes data integration and comprehensive analysis for multi-omics after Phase I, which comprised the production of epigenome datasets. KNIH launched the Korean epigenome research group to establish the domestic utilization system of epigenome data and for multi-layer integrative analysis.
Future perspective: KNIH has conducted the production and analysis of epigenome in collaboration with IHEC. The integrative analysis of the epigenome will be the basis for the realization of precision medicine.
Keywords: Diabetes Mellitus Type 2, Epigenome, Genome, Chronic disease, International Human Epigenome Consortium
질병관리본부 국립보건연구원 유전체센터 유전체연구과 이기백, 최낙현, 박수정, 김봉조*
13종의 정보를 추가로 공개하여, 향후 당뇨병의 에피유전학적 기작 및 당뇨병의 발병 원인을 규명하기 위한 연구 기반을 제공하고자 한다.
몸 말
연구 배경
2003년 인간 유전체의 해독이 완료된 이후, 인간의 다양한 세포종이 하나의 세포에 있는 유전체로부터 어떻게 유래되는지에 대하여 유전체 수준에서의 연구가 지속적으로 수행되어 왔다. 하지만, DNA 염기서열 그 자체만으로 다양한 인간 세포종으로 분화를 설명할 수 있는 부분이 너무 적다는 점이 여러 연구를 통하여 밝혀지기 시작했다. 특히, 인간의 유전체를 구성하는 약 30억 쌍의 염기서열(base pair) 중 단지 3%만이 유전자의 발현을 통해 다양한 형질로 나타나고 나머지 97%의 유전체 정보는 소위 junk라 불리는 인간의 생명 유지에 불필요한 지역이라는 보고가들어가는 말
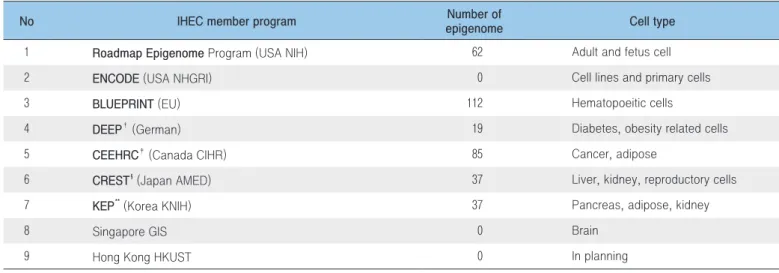
질병관리본부 국립보건연구원 유전체센터 유전체연구과에서는 유전체분석사업의 일환으로 2015년부터 당뇨병 관련 한국인 참조에피유전체 정보를 공개하고 있다. 에피유전체학은 염색체 상의 DNA 염기서열 자체의 변화가 아닌 염기서열 이외의 다양한 요인들(DNA 메틸화, 히스톤 변형 등)의 변화에 의해 유전자 발현이 조절되는 현상을 연구하는 학문으로 특히 DNA 메틸화 정보나 히스톤 변형 정보 등을 통칭하여 에피유전체라 한다. 이 정보는 국제인간에피유전체컨소시엄(International Human Epigenome Consortium, 이하 IHEC)과의 협력체계를 통해 생산 및 공개하고 있으며, 국립보건연구원은 IHEC의 회원기관으로 2017년 현재 37종1)의 당뇨병 관련 한국인 참조에피유전체 지도를 작성하여 공개하고 있다. IHEC는 인간의 250개 세포에 있어 1,000개의 참조에피유전체 데이터를 생산하고 이를 활용하여 에피유전체 지도를 작성, 공개함으로써 건강 및 질병관련 연구의 기반을 제공하는 것을 목표로 하고 있다(Table 1)[1, 2]. 이에, 국립보건연구원은 2017년 당뇨병과 관련된 한국인 참조에피유전체Table 1. Data release from International Human Epigenome Consortium*
*This table shows an update of “Data release of diabetes-related 11 Korean reference epigenome map” (PHWR, vol. 10 No. 1) †German epigenome programme (http://www.deutsches-epigenom-programm.de/)
‡Canadian Epigenetics, Environment and Health Research Consortium (http://www.epigenomes.ca/) § AMED-CREST/IHEC Team (https://www.jst.go.jp/kisoken/crest/en/)
** Korea Epigenome Project (http://152.99.75.168/KEP)
No IHEC member program epigenomeNumber of Cell type 1 Roadmap Epigenome Program (USA NIH) 62 Adult and fetus cell 2 ENCODE (USA NHGRI) 0 Cell lines and primary cells 3 BLUEPRINT (EU) 112 Hematopoeitic cells
4 DEEP† (German) 19 Diabetes, obesity related cells 5 CEEHRC‡ (Canada CIHR) 85 Cancer, adipose
6 CREST§ (Japan AMED) 37 Liver, kidney, reproductory cells 7 KEP** (Korea KNIH) 37 Pancreas, adipose, kidney
8 Singapore GIS 0 Brain
9 Hong Kong HKUST 0 In planning
있었다[3, 4]. 하지만, 동일한 염기서열에도 불구하고, 세포종 간에 다양한 형질로 나타난다는 점에 있어 생명과 연관성이 없다고 여겨진 부위가 유전자 발현을 조절하는데 일부 역할을 한다고 보고된 바 있다[5]. 이러한 보고는 유전자 이외의 부분이 특정 변이에 의해 원거리의 유전자 발현을 조절한다는 연구결과로써 증명되었다[6, 7]. 이러한 특징은 유전체 상의 DNA 염기서열 자체로 설명할 수 없는 부분이며, 외부 또는 환경적인 요인(식이습관, 흡연 등)으로부터 초래된 세포 및 생리학적 변화(메틸화 패턴의 변화, 염색체의 구조변화 등)의 결과로써 나타나는 에피유전학적 기작이라고 할 수 있다. 에피유전체는 유전체와는 다르게 세포가 분화/발달하면서 환경의 영향에 따라 변하는 특성을 나타낸다. 이러한 질환과 연관된 에피유전학적 기작에 변화가 나타나면, 다양한 형질 및 질병을 야기하게 된다. 따라서 정상세포와 비정상세포의 에피유전체 정보에 대한 통합적인 분석은 다양한 질병에 대한 이해와 치료에 있어 상당부분 공헌할 것으로 예상되며, 궁극적으로 인간의 건강증진에 기여할 것으로 예상된다.
국제인간에피유전체컨소시엄(IHEC)
IHEC는 인간유전체분석프로젝트(Human Genome Project)가 종료된 후, 단순한 염기서열의 분석만으로 건강 및 질병의 원인을 규명하는데 한계가 있음을 인식하여, 염기서열 이외에 유전자 발현의 조절과 관련된 에피유전체분야의 공동연구를 위해서, 미국 국립보건원(NIH)과 유럽연합 집행위원회(Europe Commission)의 주도로 2008년에 결성되었다. IHEC는 인간의 250종 세포에서 1,000개 에피유전체 정보를 생산하고 이 정보를 토대로 작성된 참조에피유전체 지도 정보를 과학계에 신속히 전파하는 것을 목적으로 한다. 또 하나의 목적은 정보를 이용 분석하기 위한 공통된 생물정보학적인 도구와 표준을 개발하고 보급하는 것이다. 현재, 8개국에서 9개 기관이 참여하고 있으며(준회원국 4개국), 각 회원국의 환경 여건에 따라 각기 다른 세포 종에 대한 연구를 A B C 37 datasets Fat Kidney Islet Others 19 5 6 7 10 20 30 0 2015 2016 2017 WGBS RNA-seq ChIP-seq 33 39 39 smRNA-seq 2016 2017 1096 / 2300 IHEC 93 / 725 KEP 534 / 2724 IHEC 155 / 391 KEP
The number of downloads / visitors ~10.31
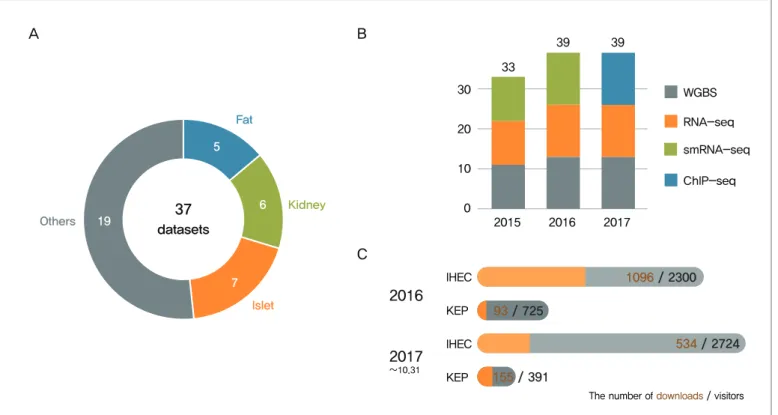
Figure 1. Data release summary of Korea Epigenome Project (A) IHEC data portal for KEP processing data sets, (B) EGA data repository for KEP raw data, (C) Current state of KEP date access. Grey and orange indicate the number of visitors and download counts, respectively.
진행하고 있다.
활동하고 있는 회원국은 미국의 NIH Roadmap Epigenome program과 NHGRI ENCODE project, 캐나다의 Canadian Institute of Health Research (CIHR), 유럽의 European Commission (EC), 독일의 Federal Ministry of Education and Research, Project Management Agency within the German Aerospace Center (DEEP program), 일본의 Japan Agency for Medical Research and Development (AMED), 한국의 National Institute of Health, Korea (KNIH), 싱가포르의 The Genome Institute of Singapore (GIS), 그리고 홍콩의 Hong Kong University of Science and Technology (HKUST)이며, 그밖에 영국, 프랑스, 이탈리아, 호주 등이 준회원으로 활동하고 있다(Table 1). 또한 IHEC의 원활한 운영을 위하여 산하에 2개의 위원회와 5개의 실무그룹을 두고 있다. IHEC는 질병의 치료와 극복이라는 목표를 위해 연례회의를 개최하여, 에피유전체 정보 생산 및 참조에피유전체 지도 작성을 위한 논의를 진행하고 있다.
당뇨병 관련 참조에피유전체 정보 공개
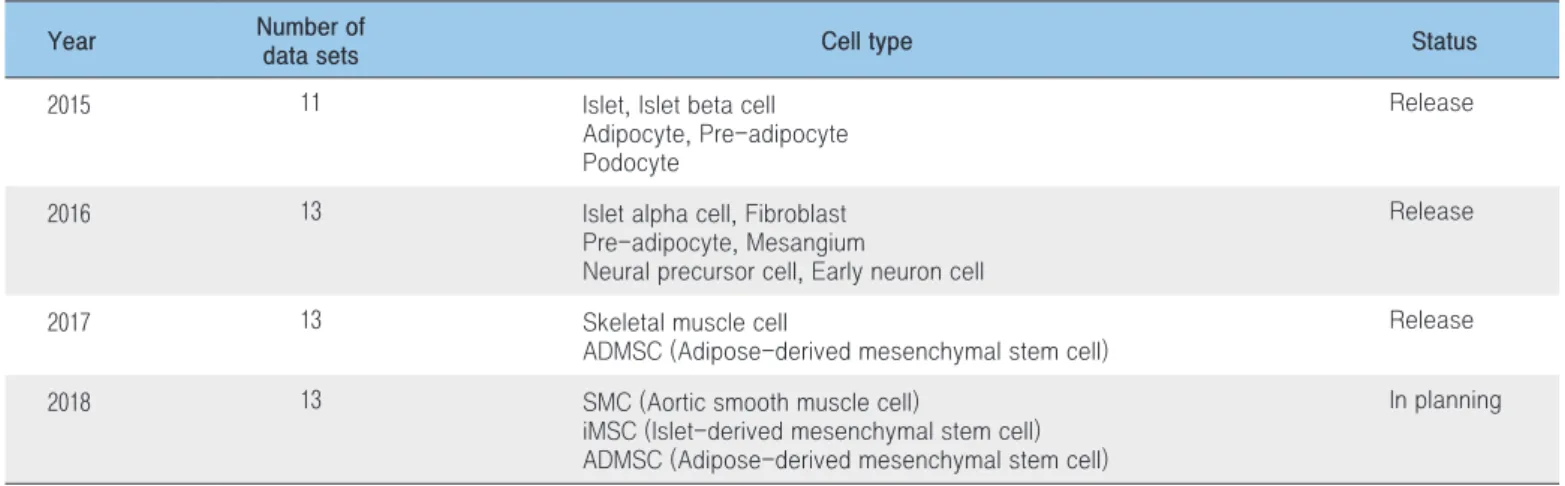
2017년 국립보건연구원 유전체센터 유전체연구과에서는 IHEC와의 국제협력연구를 통하여 당뇨병 관련 참조에피유전체 13종을 추가로 공개하였다. 공개된 데이터는 IHEC data portal (http:// www.ihec-epigenomes.org/ihec-data-portal)[9]과 European Genome Phenome Archive (http://www.ebi.ac.uk/ega/studies/EGAS00001001774)[10]에 일차 분석된 가공 데이터와 원시데이터가 등록되어 있어 전 세계 연구자 누구나 자유롭게 사용할 수 있으나, 원시데이터에 있어서는 그 특성상 정보 생산국으로부터 접근권한을 부여받은 후 데이터를 활용하도록 되어 있다(Figure 1A, B). 현재, IHEC data portal과 Korea Epigenome Project(이하 KEP) website를 통해 일차 분석된 가공 데이터가 공개되고 있으며, 공개 결과로 2017년 10월 말 기준 IHEC data portal은 약 5,000건의 방문자수와 약 1,500회의 다운로드 수를 기록하고 있으며, KEP website는 1,100여건의 방문자수와 약 250회의 다운로드수를 기록하고 있다(Figure 1C). 국립보건연구 원은 2 0 1 8년까지 I H E C를 통 해 5 0 종의 참조에피유전체 정보를 공개하는 것을 목표로 하고 있다. 이에 2016년까지 24종의 참조에피유전체 정보를 공개하였고, 2017년에 13종을 추가로 공개하여 현재까지 37종의 참조에피유전체 정보를 공개 중에 있다. 특히, 2017년에 공개한 대상세포는 당뇨병 관련 골격근세포 9종(정상 5종, 당뇨병 환자 4종), 지방유래 중간엽 줄기세포 4종(정상 2종, 당뇨병 환자 2종)이다(Figure 1B and Table 2).
한국인참조에피유전체 정보 활용
참조에피유전체 정보 생산 및 공개라는 IHEC의 일차목표는 향후 2년 내에 달성될 것으로 예상된다. 2017년 10월 베를린에서 열린 IHEC 연례회의에서는 일차 목표가 완료된 이후, 정보 활용의
Table 2. Data release status of Korean diabetes-related epigenome
Year Number of
data sets Cell type Status
2015 11 Islet, Islet beta cell Adipocyte, Pre-adipocyte Podocyte
Release
2016 13 Islet alpha cell, Fibroblast Pre-adipocyte, Mesangium
Neural precursor cell, Early neuron cell
Release
2017 13 Skeletal muscle cell
ADMSC (Adipose-derived mesenchymal stem cell)
Release 2018 13 SMC (Aortic smooth muscle cell)
iMSC (Islet-derived mesenchymal stem cell) ADMSC (Adipose-derived mesenchymal stem cell)
측면에서 IHEC가 나아갈 방향에 대해서 논의가 진행됐으며 특히, 다양한 참조에피유전체 정보를 통합분석하기 위한 다중오믹스 통합분석(Multi-OMICS Integrated Analysis)에 대한 심도 있는 논의가 있었다. 이에 국립보건연구원 유전체센터 유전체연구과는 한국인에피유전체사업 생산 데이터의 국내 선순환 체계를 구축하고 다중 오믹스 통합분석을 실현하고자 한국인참조에피유전체 데이터 활용 확대를 위한 연구사업을 통해 국내 연구자들과의 체계적인 공동연구를 수행하고 있다. 현재 국내 에피유전체 연구 활성화를 위해서 주요 만성질환 관련 4개 연구 분과모임과 데이터 분석지원 분과모임 등 5개 분과가 활동 중이며, 2차에 걸친 연구회 전체 워크숍과 분과별 3회의 분과모임을 개최하였다. 질환관련 분과는 병원의 임상전문가, 데이터 분석을 위한 생물정보학자 및 실험적 검증을 위한 기초연구자 등이 유기적으로 연구에 참여하고 있으며, 데이터 분석기법 분과는 데이터 종류별 전문가로 구성되어 있다. 아울러 2017년 새로 구성된 IHEC의 통합분석 위킹그룹(Integrative analysis working group)과의 지속적인 협력 연구를 통해 에피유전체 연구에 대한 국제적인 위상 확립에 기여할 것으로 예상된다.
맺는 말
IHEC의 일차 목표인 인간 세포를 이용하여 1,000개의 에피유전체 정보를 생산하여 공개하는 것은 각 회원국의 노력으로 조만간 달성될 것으로 예상된다. 나아가 향후 다양한 에피유전체 정보를 기반으로 히스톤 변형(histone modification)의 고해상도 지도, 고해상도 DNA 메틸화(DNA methylation) 지도, 단백질 합성 유전자에 대한 전사 개시 지역(Transcription start site, TSS)의 지도, 비 암호화 RNA (non-coding RNA) 및 소형 RNA (small RNA)의 전체 카탈로그 및 발현 패턴, 나아가 인간의 질환관련 모델 생물과의 비교분석 등을 수행하는 것이 IHEC의 이차 목표이다. 이를 통해 IHEC는 각 세포종의 핵심적인 세포 상태에 초점을 맞추어 건강에 대한 연구 및 재생의학의 진보를 촉진할 새로운 지식을 창출하고자 한다. 따라서 데이터 자체의 공개뿐만 아니라 에피유전체 데이터를 구성, 통합 및 시각화하기 위한 통일된 생물정보학적 표준 및 분석 도구를 제공하기 위해 최근 통합분석 워킹그룹을 추가하였다. 이 통합분석 워킹그룹을 필두로 IHEC phase II 추진이 가속화 될 것으로 전망한다. 국립보건연구원은 회원국으로서 다양한 참조에피유전체 통합분석 연구 등 IHEC phase II 추진단계에 주도적으로 참여하여 환경과 질병에 의한 에피유전체의 변이를 밝히고자 한다. 또한 당뇨병 등 만성질환의 에피유전체 정보를 보다 적극적으로 활용하고 국내 에피유전체 분야의 활성화를 위해 2017년부터 다학계 기반의 에피유전체 연구회를 운영하고 있다. 따라서 한국인 에피유전체 연구회를 통해 국내 연구자들과의 활발한 연구 네트워크 구축 및 국내 에피유전체 연구 활성화뿐만 아니라 향후 한국인 맞춤형 정밀의료를 위한 기반이 될 것이라고 기대된다.참고문헌
1. IHEC website. (http://www.ihec-epigenomes.org)
2. IHEC data repository website. (http://www.ebi.ac.uk/vg/epirr/ summary)
3. Lander ES., et al. Initial sequencing and analysis of the human genome. Nature. 2001;409:860-921.
4. Maurano MT., et al. Systematic localization of common disease-associated variation in regulatory DNA. Science. 2012;337:1190-95. 5. Degner JF., et al. DNase I sensitivity QTLs are major determinant of
human expression variation. Nature. 2012;482:390-4.
6. Gorkin DU, Ren B. Genetics: Closing the distanceon obesity culprits.
Nature. 2014;507:309-10.
7. Smemo S., et al. Obesity-associated variants within FTO form long-range functional connections with IRX3. Nature. 2014;507:371-5. 8. Korea Epigenome Project website. (http://152.99.75.168/KEP) 9. IHEC data portal website.
(http://www.ihec-epigenomes.org/ihec-data-portal)
10. European Genome Phenome Archive (EGA) website. (http://www. ebi.ac.uk/ega/studies/EGAS00001001774)
들어가는 말
X-선은 전리방사선(Ionizing radiation)의 한 종류로써 질병의 진단에 일반적으로 이용되고 있으나, 국제암학회(International Agency for Research on Cancer, IARC)에서는 1급 발암물질로 분류하고 있다[1]. 이에 따라 전리방사선을 의료 목적으로 사용할
연구단신, Brief report 1
2016년 진단용 방사선 발생장치 관리 현황
질병관리본부 질병예방센터 의료방사선과 김현지, 이정열, 이병영, 이정은, 김현진, 송승기, 임광래, 김재호, 이현구*
*교신저자 : [email protected], 043-719-7511
Status of diagnostic X-ray equipment management in Korea, 2016
Kim Hyun Ji, Lee Jung-youl, Lee Byung-young, Lee Jung-eun, Kim Hyun-Jin, Song Seung-Ki, Im Gwang-Rae, Kim Jae-Ho, Lee Hyun-Koo Division of Medical Radiation, Center for Disease Prevention, KCDC
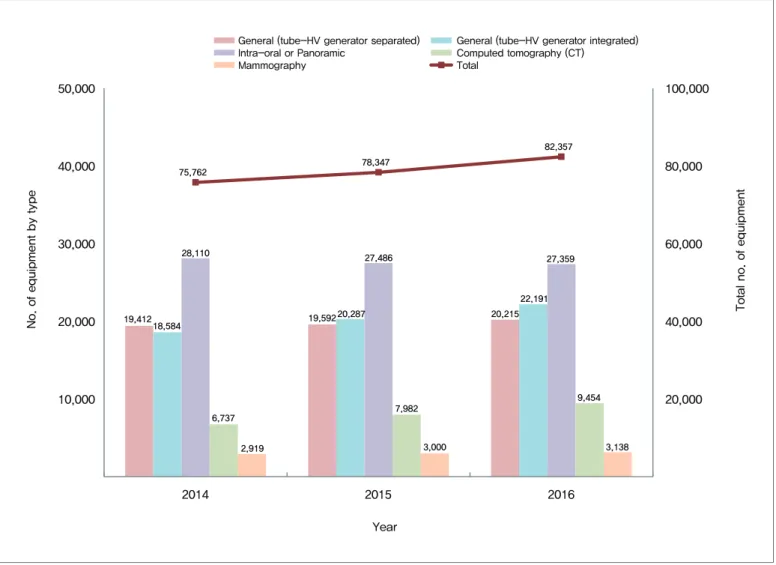
In Korea, there has been a continuous increase in the number of diagnostic X-ray equipment from 75,762 in 2014 to 82,357 in 2016. District-based categorization revealed that the largest number of diagnostic X-ray equipment was 19,921(24.2%) in Seoul, while the smallest number was 264(0.3%) in Sejong. Classification based on the types of X-ray equipment showed that the portion of general equipment with a separate tube-high voltage (HV) generator was highest with 24.5%(20,215), followed by general equipment with integrated tube-HV generator used in radiography or fluoroscopy with 19.1%(15,731), intra-oral equipment with 18.6%(15,281), equipment for panoramic imaging with 14.7%(12,078), dental computed tomography with 8.7%(7,154), equipment for bone mineral densitometry with 7.8%(6,460), equipment for mammography with 3.8%(3,138), and whole body CT with 2.8%(2,300). Based on the period of use, 32.0%(26,330) of total equipment was used for “equal or less than 5years.” The more diagnostic X-ray equipment in the number increases, the more efforts will be required for the safe use of medical radiation.
Keywords: Radiologic Technology, Radiography, Dental Radiography, Mammography, Safety Management
때에는 X-선 노출에 따른 위해(Risk)보다 진단적 가치(Benefit)가 크도록 정당성을 확보하고, ALARA (As low as reasonably achievable) 원칙에 따라 사회ㆍ경제적 측면을 고려하여 최적화된 선량을 사용할 것을 권고하고 있다[2].
우리나라의 의료방사선 안전관리 체계를 살펴보면, 의료기관 개설자 및 안전관리 책임자는 「의료법」 제37조 및 「진단용 방사선
발생장치의 안전관리에 관한 규칙」에 따라 진단용 방사선 발생장치 및 방사선 관계 종사자에 대한 안전관리(성능검사 및 피폭관리 등)를 실시하도록 제도적 근거를 마련하고 있고[3], 기존에 식약청에서 관리해 오던 것을 정부조직법 개편에 따라 2013년부터 질병관리본부에서 수행하고 있다. 질병관리본부에서는 2016년 12월에 발간한 ‘2015년도 의료기관 방사선 관계종사자의 개인피폭선량 연보’부터 방사선 안전관리와 학술연구의 기초자료로 활용될 수 있도록 전국의 진단용 방사선 발생장치 현황을 부록으로 제공하고 있다[4]. 진단용 방사선 발생장치는 「진단용 방사선 발생장치의 안전관리에 관한 규칙」 제2조에 따라 ‘진단용 엑스선 장치’, ‘진단용 엑스선 발생기’, ‘치과진단용 엑스선 발생장치’, ‘전산화 단층 촬영장치’, ‘유방촬영용 장치’ 등으로 분류하고 있으며[3], 촬영 및 투시용으로 사용되는 장치는 구성 형태에 따라 ‘진단용 엑스선 장치’와 ‘진단용 엑스선 발생기’로 구분한다. 고전압 발생장치와 X-선관이 분리된 장치는 진단용 엑스선 장치, 고전압 발생장치와 X-선관이 일체형으로 구성된 장치는 진단용 엑스선 발생기로 구분한다. X-선 골밀도 측정기는 진단용 엑스선 발생기에, 치과용 CTㆍ이비인후과용 CT 및 양전자방출단층촬영조합장치(PET-CT)는 전산화단층촬영장치(CT)에 포함된다. 19,412 19,592 20,215 18,584 20,287 22,191 28,110 27,486 27,359 6,737 7,982 9,454 2,919 3,000 3,138 75,762 78,347 82,357 20,000 40,000 60,000 80,000 100,000 10,000 20,000 30,000 40,000 50,000 2014 2015 2016
Total no. of equipment
No. of equipment by type
General (tube-HV generator separated) General (tube-HV generator integrated) Intra-oral or Panoramic Computed tomography (CT)
Mammography Total
Year
Figure 1. Status diagnostic X-ray equipment in Korea from 2014 to 2016
Equipment for bone mineral densitometry (BMD) was included in “General (tube-HV* generator integrated)” and Dental (cone-beam) CT in “Computed Tomography (CT)”.
몸 말
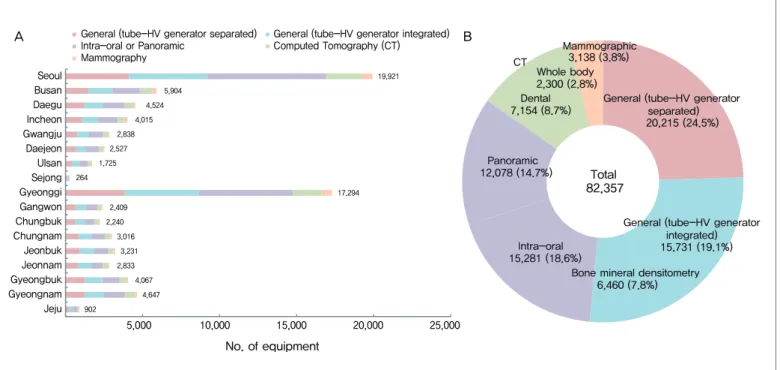
2016년 3월 31일 기준, 전국의 진단용 방사선 발생장치 설치ㆍ운영 현황을 살펴본 결과, 전체 진단용 방사선 발생장치는 매년 증가하 는 추세이며, ‘16년 82,3 57대로 ‘15년도 보다 4,010대(5.1%) 증가한 것으로 나타났다. 2014년∼2016년의 장치 종류별 증감추세는 치과진단용 엑스선 발생장치를 제외한 진단용 엑스선 장치와 진단용 엑스선 발생기, 전산화단층촬영장치 및 유방촬영용 장치 모두 증가하는 추세를 나타내었다(Figure 1). 진단용 방사선 발생장치 현황을 지역별로 살펴보면, 전체 82,357대 중 서울지역에 설치된 진단용 방사선 발생장치가 19,921대(전국의 24.2%)로 가장 많고, 그 다음으로 많이 설치된 지역은 경기도로 전체의 21.0%에 해당하는 17,294대, 부산 5,904대(7.2%), 경남 4,647대(5.6%)가 설치된 것으로 나타났다. 17개 시·도 중 가장 적게 설치된 지역은 세종특별자치시로 전체의 0.3%에 해당하는 264대가 설치되어 있으며, 그 다음으로 적은 수의 진단용 방사선 발생장치가 설치된 지역은 제주도로, 전체 진단용 방사선 발생장치의 1.1%인 902대가 설치되어 있는 것으로 조사되었다(Figure 2A) 진단용 방사선 발생장치를 종류별로 살펴보면, 진단용 엑 스선 장 치가 2 0, 2 15대(전체의 2 4 . 5%), 진단용 엑 스선 발생기는 22,191대(전체의 26.9%), 이 중 X-선 골밀도 측정기는 6,460대(전체의 7.8%)로 나타났고, 치과진단용 엑스선 발생장치 중 구내촬영용 장치는 15,281대(전체의 18.6%), 파노라마 촬영용 장치는 12,078대(전체의 14.7%)로 전체 진단용 방사선 발생장치의 33.2%인 27,359대로 나타났다. 전산화단층촬영장치는 9,454대(전체의 11.5%)로 이 중 치과 용 또는 이비인후 과 용 전 산 화 단층 촬 영장 치와 전신용 전산화단층촬영장치는 각각 7,154대(전체의 8.7%), 2,300대(전체의 2 . 8 % ) , 유 방 촬 영 용 장 치 는 전 체 의 3 . 8 %인 3 ,1 3 8 대 로 나타났다(Figure 2B). 또한 2016년 말에 제조연도를 기준으로 장치 사용기간을 살펴본 결과, 전체 82,357대의 진단용 방사선 발생장치 중 사용기간이 “5년 이하”인 장치는 26,330대로 32.0%, “6년 이상 10년 이하”의 장치는 24,093대로 29.3%, “11년 이상 20년 이하”의 장치는 A B 5,000 10,000 15,000 20,000 25,000 Jeju Gyeongnam Gyeongbuk Jeonnam Jeonbuk Chungnam Chungbuk Gangwon Gyeonggi Sejong Ulsan Daejeon Gwangju Incheon Daegu Busan Seoul No. of equipmentGeneral (tube-HV generator separated) General (tube-HV generator integrated) Intra-oral or Panoramic Computed Tomography (CT) Mammography 19,921 5,904 4,524 4,015 2,838 2,527 1,725 17,294 264 2,409 2,240 3,016 3,231 2,833 4,067 4,647 902
General (tube-HV generator separated) 20,215 (24.5%)
General (tube-HV generator integrated) 15,731 (19.1%) Bone mineral densitometry
6,460 (7.8%) Intra-oral 15,281 (18.6%) Panoramic 12,078 (14.7%) Dental 7,154 (8.7%) Whole body 2,300 (2.8%) Mammographic 3,138 (3.8%) Total 82,357 CT
Figure 2. Distribution of diagnostic X-ray equipment by region (A) and type (B), 2016
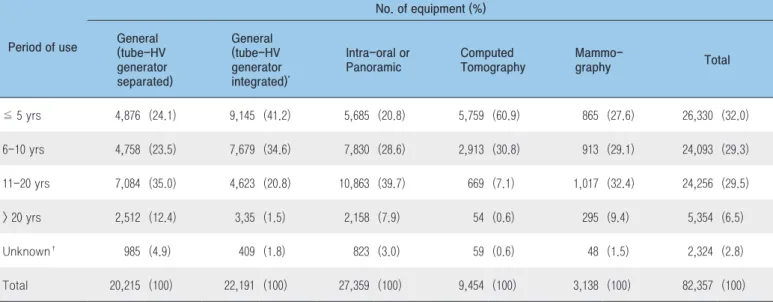
24,256대로 29.5%를 나타내었고, “20년을 초과”한 장치는 전체의 6.5%에 해당하는 5,354대로 나타났다. 이를 장치 종류별로 살펴보면, 진단용 엑스선 장치에서는 “11년 이상 20년 이하”의 장치의 비율이 35.0%(7,084대)로 가장 높았고, 진단용 엑스선 발생기에서는 “5년 이하”의 장치가 전체 발생기의 41.2%(9,145대)로 가장 높게 나타났다. 치과진단용 엑스선 발생장치에서는 전체 27,359대 중 39.7%에 해당하는 10,863대가 “11년 이상 20년 이하”로 조사되었으며, 전산화단층촬영장치는 “5년 이하” 장치의 비율이 60.9%로 다른 장치 종별에 비해 “5년 이하”의 장치 비율이 높게 나타났다. 유방촬영용 장치의 경우, “11년 이상 20년 이하”인 장치의 비율이 가장 높았으며, 3,138대 중 32.4%인 1,017대로 조사되었다. 제조일자 확인이 불가하여 사용기간을 산정할 수 없는 장치는 2.8%인 2,324대(전체 82,357대 기준)로 나타났으며, 이를 장치 종별로 살펴본 결과, 진단용 엑스선 장치가 4.9%(20,215대 중 985대)로 가장 높게 나타났다(Table 1).
맺는 말
전국 의료기관에 설치·운영 중인 진단용 방사선 발생장치는 지속적으로 증가하고 있고 그 중에서도 비교적 많은 선량(高線量)을 조사(照射)하는 전산화단층촬영장치(CT)의 증가 추세가 두드러지고 있어 환자 의료방사선 안전관리에 대한 국가적 관심이 집중되어야 할 것으로 파악되었다. 질병관리본부에서는 진단용 방사선 발생장치의 기술 발전 및 의료기관 환경을 반영한 자료 분석 등을 통해 실효적이고 지속가능한 의료방사선 안전관리정책을 수립·시행하고자 한다.참고문헌
1. 국제암학회(IARC). IARC Monographs on the Evaluation of Carcinogenic Risks to Humans : Radiation Volume 100D A Review of Human Carcinogens. 2012.
2. 국제방사선방어위원회(ICRP). The 2007 Recommendations of the International Commission on Radiological Protection. 2007, Publication 103.
3. 보건복지부령 제338호. 2016년 1월 1일 시행. 진단용 방사선 발생장치의 안전관리에 관한 규칙.
4. 질병관리본부. 2015년도 의료기관 방사선관계종사자의 개인피폭선량 연 보. 2016.
Table 1. Diagnostic X-ray equipment by period of use, 2016
* Equipment for bone mineral densitometry(BMD) was included. † The date of manufacture was unknown.
Period of use No. of equipment (%) General (tube-HV generator separated) General (tube-HV generator integrated)* Intra-oral or Panoramic Computed Tomography Mammo-graphy Total ≦ 5 yrs 4,876 (24.1) 9,145 (41.2) 5,685 (20.8) 5,759 (60.9) 865 (27.6) 26,330 (32.0) 6-10 yrs 4,758 (23.5) 7,679 (34.6) 7,830 (28.6) 2,913 (30.8) 913 (29.1) 24,093 (29.3) 11-20 yrs 7,084 (35.0) 4,623 (20.8) 10,863 (39.7) 669 (7.1) 1,017 (32.4) 24,256 (29.5) > 20 yrs 2,512 (12.4) 3,35 (1.5) 2,158 (7.9) 54 (0.6) 295 (9.4) 5,354 (6.5) Unknown† 985 (4.9) 409 (1.8) 823 (3.0) 59 (0.6) 48 (1.5) 2,324 (2.8) Total 20,215 (100) 22,191 (100) 27,359 (100) 9,454 (100) 3,138 (100) 82,357 (100)
들어가는 말
다양한 기후변화 현상의 하나인 한파(Cold waves)는 겨울철 나타날 수 있는 이상기후 현상으로 기상청에 따르면 “뚜렷한 저온의 한랭기단이 위도가 낮은 지방으로 몰아닥쳐 급격한 기온의 하강을 일으키는 현상”으로 정의한다[1]. 지구온난화로 전 세계 연 평균기온은 상승하는 경향을 보이고 있지만 간헐적으로 발생하는 겨울의 극단적 혹한 현상은 지속적으로 나타날 것으로 전망되고 있다[2]. 우리나라는 대설·한파 등 겨울철 피해예방 및 국민 불편 최소화를 위해 행정안전부를 중심으로 관계부처 합동으로 매년 「겨울철 자연재난 종합대책」을 추진해 오고 있다. 질병관리본부는 연구단신, Brief report 22016-2017년 절기 한랭질환 감시체계 운영결과
질병관리본부 기획조정부 미래감염병대비과 박성우, 백수진, 조현정, 신나리, 이희일, 이상원* *교신저자 : [email protected], 043-719-7260A survey of cold-related illness surveillance, 2016-2017 season
Park Seong-Woo, Baek Soo-Jin, Jo Hyun-Jung, Shin Na-Ri, Lee Hee-Il, Lee Sang-Won Division of Strategic Planning for Emerging Infectious Diseases, KCDC
From December 1, 2016 to February 28, 2017, the Korea Centers for Disease Control and Prevention (KCDC) operated the cold-related illness (CRI) surveillance system to monitor hypothermia, frostbite, trench foot or immersion foot, and chilblains due to the cold wave using a nationwide network of 529 hospitals. During the above duration, 441 cases of cold-related illness, and 4 deaths were reported to the KCDC. The reports showed the following characteristics of patients with CRI. With respect to gender and age, the number of male patients (304, 74.3%) were three times higher than that of female patients (137, 31.1%) and the highest frequency of CRI occurred in those aged 60-69 years (88, 20.0%), showing increasing incidence in older aged people. By time, the number of patients with CRI increased to 124 cases in January 15-28 at the peak. By location, 77 cases from Gyonggi, 44 cases from Gyeungbuk were reported in descending order. Health damage from the cold wave could be prevented by following the guidelines for cold wave control. In order to minimize the incidence of CRI, the Division of Strategic Planning for Emerging Infectious Diseases of KCDC is striving to raise public awareness to provide health warnings against CRI every winter.
2013년부터 한파에 따른 건강피해를 모니터링하기 위해 한랭질환 감시체계를 운영(12월~2월)하고 있으며, 그 결과를 일 단위로 정보를 제공하고 한파에 대한 주의 환기와 건강피해 최소화를 위해 힘쓰고 있다.
몸 말
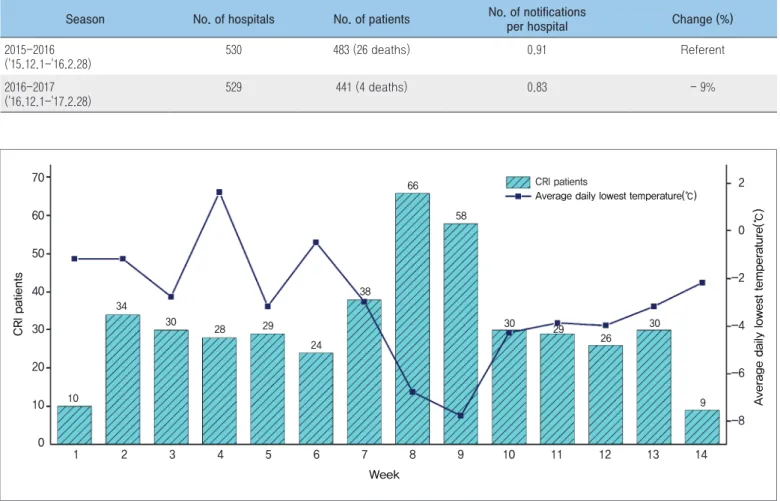
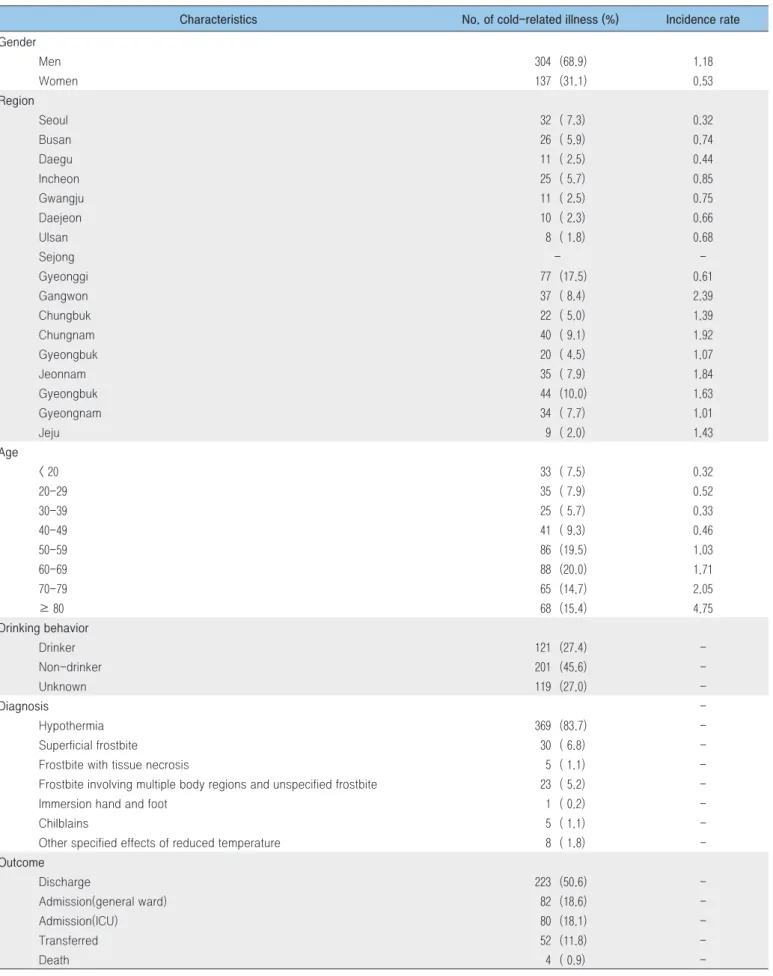
2016년 한랭질환 감시체계는 2016년 12월 1일부터 2017년 2월 28일까지 전국 530여개 응급실 운영 의료기관에서 한파로 인한 한랭질환(저체온증, 동상, 참호족·침수족, 동창) 발생현황을 일별 모니터링한 결과이며 총 441명(사망 4명)의 한랭질환자가 신고되어, 전년 대비 환자수는 소폭 감소(9%)하였다(Table 1). 주 평균 최저기온이 –5℃ 이하로 떨어졌던 8~9주차 사이(‘17.1.15~28)에 전체 환자의 28.1%(124명)가 집중적으로 발생하였다(Figure 1). 한랭질환 감시체계로 신고된 총 441명(사망 4명)의 환자 중 83.7%(369명)가 저체온증1)으로 나타났다. 성별은 남성이 68.9%(304명)로 여성 31.1%(137명) 보다 많았고, 60세 연령층에서 20.0%(88명)로 가장 많았다. 발생지역은 경기 17.5%(77명), 경북 10%(44명) 순으로 높았고, 음주를 한 경우가 27.4%(121명)로 나타났다. 연령대별 발생률은 80세 이상에서 가장 높았고, 고령층으로 갈수록 발생률이 높아졌다(Table 2).Season No. of hospitals No. of patients No. of notifications per hospital Change (%) 2015-2016 ('15.12.1-'16.2.28) 530 483 (26 deaths) 0.91 Referent 2016-2017 ('16.12.1-'17.2.28) 529 441 (4 deaths) 0.83 - 9%
Table 1. Reported case of cold-related illness
CRI patients
Average daily lowest temperature(℃)
Average daily lowest temperature(℃)
Week 70 2 0 -2 -4 -6 -8 CRI patients 60 50 40 30 20 10 10 34 30 28 29 24 38 66 58 30 30 9 29 26 0 1 2 3 4 5 6 7 8 9 10 11 12 13 14
Figure 1. Weekly number of case with cold-related illness (CRI) and temperature (℃)
Table 2. General characteristics of cold-related patients (N = 441)
Characteristics No. of cold-related illness (%) Incidence rate Gender Men 304 (68.9) 1.18 Women 137 (31.1) 0.53 Region Seoul 32 ( 7.3) 0.32 Busan 26 ( 5.9) 0.74 Daegu 11 ( 2.5) 0.44 Incheon 25 ( 5.7) 0.85 Gwangju 11 ( 2.5) 0.75 Daejeon 10 ( 2.3) 0.66 Ulsan 8 ( 1.8) 0.68 Sejong - -Gyeonggi 77 (17.5) 0.61 Gangwon 37 ( 8.4) 2.39 Chungbuk 22 ( 5.0) 1.39 Chungnam 40 ( 9.1) 1.92 Gyeongbuk 20 ( 4.5) 1.07 Jeonnam 35 ( 7.9) 1.84 Gyeongbuk 44 (10.0) 1.63 Gyeongnam 34 ( 7.7) 1.01 Jeju 9 ( 2.0) 1.43 Age < 20 33 ( 7.5) 0.32 20-29 35 ( 7.9) 0.52 30-39 25 ( 5.7) 0.33 40-49 41 ( 9.3) 0.46 50-59 86 (19.5) 1.03 60-69 88 (20.0) 1.71 70-79 65 (14.7) 2.05 ≥ 80 68 (15.4) 4.75 Drinking behavior Drinker 121 (27.4) -Non-drinker 201 (45.6) -Unknown 119 (27.0) -Diagnosis -Hypothermia 369 (83.7) -Superficial frostbite 30 ( 6.8) -Frostbite with tissue necrosis 5 ( 1.1) -Frostbite involving multiple body regions and unspecified frostbite 23 ( 5.2) -Immersion hand and foot 1 ( 0.2) -Chilblains 5 ( 1.1) -Other specified effects of reduced temperature 8 ( 1.8) -Outcome Discharge 223 (50.6) -Admission(general ward) 82 (18.6) -Admission(ICU) 80 (18.1) -Transferred 52 (11.8) -Death 4 ( 0.9)
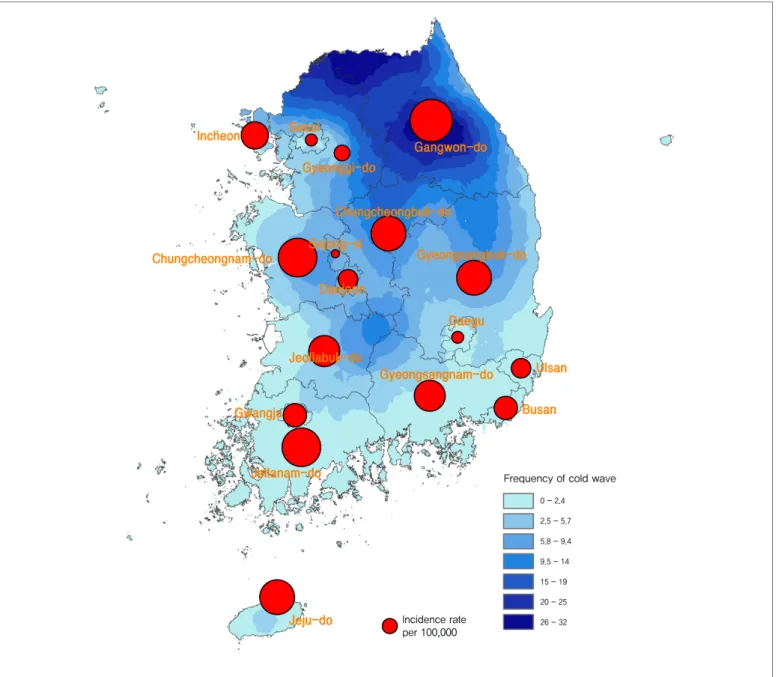
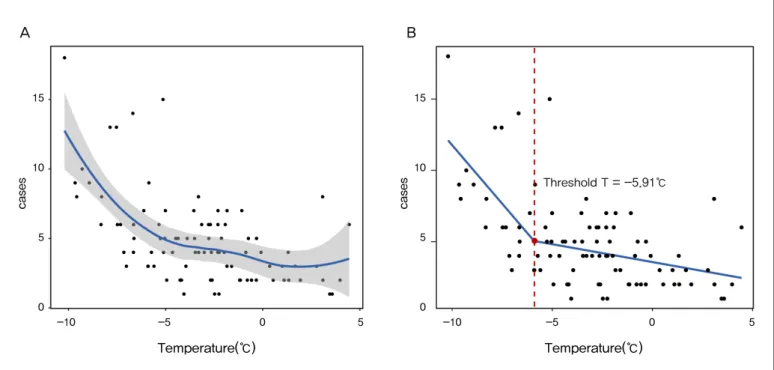
한파빈도2)와 환자 발생률3)에 대한 지리적 분석결과 강원지역은 한파 빈도와 발생률(2.39)이 모두 높았고, 상대적으로 한파 빈도가 낮았던 전라남도(1.84)와 제주도(1.43)에서 발생률이 높게 나타났다(Figure 2). 환자수와 기온과의 연관성을 살펴보면, 기온이 낮아질수록 환자수가 증가하는 음의 연관성을 나타냈다(Figure 3A). 구간적
회귀분석(Piecewise regression analysis) 결과 임계온도 –5.91℃ (R2
= 0.37, p < 0.05)보다 기온이 낮을수록 한랭질환자 수가 급격히 증가하는 경향을 보였다(Figure 3B).
Frequency of cold wave
0 - 2.4 2.5 - 5.7 5.8 - 9.4 9.5 - 14 15 - 19 20 - 25 26 - 32 Incidence rate per 100,000
Figure 2. GIS-based map of the estimated incidence rates of cold related-illness and cold wave frequency
2) 기상청 방재기상 관측지점 기준으로 감시체계 총 기간(‘16.12.1~17.2.28) 중 일 최저기온이 –12℃이하로 떨어졌던 횟수 3) 인구 십만 명당 발생률
참고문헌
1. 전미정 외. 우리나라의 겨울철 기온 변화 및 한파 발생빈도 분석. 2015. 2. IPCC. 기후변화 2014 종합보고서. 2014.맺는 말
한파로 인한 건강피해는 사전에 적절한 조치로 사고를 방지할 수 있으므로, 간단한 건강수칙 준수로 사전 예방이 가능하다. 미래감염병대비과에서는 질병관리본부 홈페이지를 통해 한랭질환자 발생현황을 일 단위로 제공하고 있으며, 한파대비 건강피해 예방관련 홍보자료를 개발하여 배포하였다. 아울러 「한파로 인한 한랭질환 신고현황 연보」를 4월 발간할 계획이다. A 0 -10 -5 0 5 5 10 15 B Temperature(℃) cases 0 -10 -5 0 5 5 10 15 Temperature(℃) cases Threshold T = -5.91℃Figure 3. Regression analysis between temperature and number of cold-related illness
<건강한 겨울나기 이렇게 준비하세요!> 실내에서는 실외에서는 • 생활습관 : 가벼운 실내운동, 적절한 수분섭취와 고른 영양분을 가진 식사를 합니다. • 실내환경 : 실내 적정온도(18〜20℃)를 유지하고 건조해지지 않도록 합니다. * 어르신과 어린이는 체온을 유지하기 위한 반응이 떨어질 수 있으므로 주의가 필요합니다. • 따뜻한 옷을 입습니다. * 장갑, 목도리, 모자, 마스크를 착용합니다. • 무리한 운동은 삼가합니다. • 외출 전 체감온도를 확인합니다. * 날씨가 추울 때는 가급적 야외활동을 자제합니다.
Classification of disease‡ Current week Cum.2018
5-year weekly average
Total no. of cases by year Imported cases of current week : Country (no. of cases) 2017 2016 2015 2014 2013 Category Ⅰ Cholera 0 0 0 5 4 0 0 3
Typhoid fever 11 19 3 128 121 121 251 156 Laos(1) Paratyphoid fever 1 4 1 73 56 44 37 54 Shigellosis 18 54 3 111 113 88 110 294 Thailand/Laos(9), Philippines(7) EHEC 1 3 0 139 104 71 111 61 Philippines(1) Viral hepatitis A 51 199 35 4,429 4,679 1,804 1,307 867 Category Ⅱ Pertussis 11 52 2 335 129 205 88 36 Tetanus 1 2 0 34 24 22 23 22 Measles 5 7 0 10 18 7 442 107 Mumps 253 749 297 16,938 17,057 23,448 25,286 17,024 Rubella 5 10 0 11 11 11 11 18
Viral hepatitis B (Acute) 13 26 3 393 359 155 173 117 Japanese encephalitis 0 0 0 9 28 40 26 14 Varicella 1,453 5,364 1,224 80,071 54,060 46,330 44,450 37,361 Streptococcus pneumoniae 20 76 5 517 441 228 36 -Category Ⅲ Malaria 1 5 1 514 673 699 638 445 Cambodia(1) Scarlet fever§ 441 1,236 165 22,875 11,911 7,002 5,809 3,678 Meningococcal meningitis 0 1 0 18 6 6 5 6 Legionellosis 8 17 1 198 128 45 30 21 Vibrio vulnificus sepsis 0 0 0 47 56 37 61 56
Murine typhus 1 1 0 20 18 15 9 19 Laos(1) Scrub typhus 22 89 11 10,596 11,105 9,513 8,130 10,365 Leptospirosis 6 14 1 134 117 104 58 50 Brucellosis 3 10 0 26 4 5 8 16 Rabies 0 0 0 0 0 0 0 0 HFRS 11 32 6 603 575 384 344 527 Syphilis 57 146 19 2,154 1,569 1,006 1,015 799 CJD/vCJD 2 7 1 68 42 33 65 34 Tuberculosis 658 1,770 588 28,577 30,892 32,181 34,869 36,089 HIV/AIDS 11 21 9 1,005 1,062 1,018 1,081 1,013 Viral hepatitis C 263 728 - 6,411 - - - -VRSA 0 0 - 0 - - - -CRE 172 472 - 5,373 - - - -Category Ⅳ Dengue fever 6 13 3 186 313 255 165 252 Vietnam(2), Sri Lanka(1), Cambodia(1) Thailand(1), Philippines(1), Q fever 9 44 1 130 81 27 8 11
West Nile fever 0 0 0 0 0 0 0 0
Lyme Borreliosis 5 10 0 41 27 9 13 11 Laos(1)
Melioidosis 0 0 0 2 4 4 2 2
Chikungunya fever 1 1 0 5 10 2 1 2 Cambodia(1)
SFTS 0 0 0 272 165 79 55 36
MERS 0 0 - 0 0 185 -
-Zika virus infection 0 0 - 11 16 - -
-1.1 환자감시 : 전수감시 감염병 주간 발생 현황
(3rd Week)
Table 1. Reported cases of national infectious diseases in Republic of Korea, week ending January 20, 2018 (3rd Week)*
Unit: No. of cases†
Abbreviation: EHEC= Enterohemorrhagic Escherichia coli, HFRS= Hemorrhagic fever with renal syndrome, CJD/vCJD= Creutzfeldt-Jacob Disease / variant Creutzfeldt-Jacob Disease, VRSA= Vancomycin-resistant Staphylococcus aureus, CRE= Carbapenem-resistant Enterobacteriaceae, SFTS= Severe fever with thrombocytopenia syndrome, MERS-CoV= Middle East Respiratory Syndrome Coronavirus.
Cum: Cumulative counts from 1st week to current week in a year.
* The reported data for year 2017, 2018 are provisional but the data from 2013 to 2016 are finalized data.
† According to surveillance data, the reported cases may include all of the cases such as confirmed, suspected, and asymptomatic carrier in the group.
‡ The reported surveillance data excluded Hansen’s disease and no incidence data such as Diphtheria, Poliomyelitis, Haemophilus influenzae type b, Epidemic typhus, Anthrax, Plague, Yellow fever, Viral hemorrhagic fever, Smallpox, Severe Acute Respiratory Syndrome, Animal influenza infection in humans, Novel Influenza,
Reporting area
Diseases of Category Ⅰ
Cholera Typhoid fever Paratyphoid fever Shigellosis Current week Cum.2018 Cum. 5-year average§ Current week Cum.2018 Cum. 5-year average§ Current week Cum.2018 Cum. 5-year average§ Current week Cum.2018 Cum. 5-year average§ Overall 0 0 0 11 19 9 1 4 2 18 54 7 Seoul 0 0 0 2 3 1 1 2 0 0 6 2 Busan 0 0 0 2 2 0 0 0 0 0 3 0 Daegu 0 0 0 0 0 0 0 0 0 0 4 0 Incheon 0 0 0 1 3 1 0 0 1 1 4 1 Gwangju 0 0 0 0 0 0 0 0 0 0 0 0 Daejeon 0 0 0 0 1 1 0 0 0 0 2 0 Ulsan 0 0 0 0 0 0 0 0 0 0 0 0 Sejong 0 0 0 0 0 0 0 0 0 0 0 0 Gyonggi 0 0 0 3 4 2 0 1 1 2 10 3 Gangwon 0 0 0 2 2 0 0 0 0 4 4 0 Chungbuk 0 0 0 0 1 0 0 0 0 0 0 0 Chungnam 0 0 0 0 0 1 0 0 0 1 5 0 Jeonbuk 0 0 0 0 0 0 0 0 0 9 9 0 Jeonnam 0 0 0 0 0 1 0 1 0 0 2 1 Gyeongbuk 0 0 0 0 1 1 0 0 0 0 3 0 Gyeongnam 0 0 0 1 2 1 0 0 0 1 2 0 Jeju 0 0 0 0 0 0 0 0 0 0 0 0
Cum: Cumulative counts from 1st week to current week in a year
* The reported data for year 2017, 2018 are provisional but the data from 2013 to 2016 are finalized data.
† According to surveillance data, the reported cases may include all of the cases such as confirmed, suspected, and asymptomatic carrier in the group. § Cum. 5-year average is mean value calculated by cumulative counts from 1st week to current week for 5 preceding years.
Table 2. (Continued) Reported cases of infectious diseases by geography, week ending January 20, 2018 (3rd Week)*
Unit: No. of cases†
Reporting area
Diseases of Category Ⅰ Diseases of Category Ⅱ Enterohemorrhagic
Escherichia coli Viral hepatitis A Pertussis Tetanus Current week Cum.2018 Cum. 5-year average§ Current week Cum.2018 Cum. 5-year average§ Current week Cum.2018 Cum. 5-year average§ Current week Cum.2018 Cum. 5-year average§ Overall 1 3 0 51 199 93 11 52 3 1 2 0 Seoul 0 0 0 8 30 18 4 6 2 0 0 0 Busan 0 0 0 1 3 2 0 0 0 0 0 0 Daegu 0 0 0 5 6 2 0 1 0 0 1 0 Incheon 0 0 0 6 17 8 0 2 0 0 0 0 Gwangju 0 0 0 0 2 1 0 0 0 0 0 0 Daejeon 0 0 0 1 8 4 0 0 0 0 0 0 Ulsan 0 0 0 0 1 1 0 0 0 0 0 0 Sejong 0 0 0 0 1 1 0 0 0 0 0 0 Gyonggi 0 1 0 14 60 33 7 40 1 0 0 0 Gangwon 0 0 0 1 4 2 0 0 0 0 0 0 Chungbuk 0 0 0 2 6 3 0 1 0 1 1 0 Chungnam 1 1 0 4 27 5 0 0 0 0 0 0 Jeonbuk 0 0 0 3 18 6 0 1 0 0 0 0 Jeonnam 0 0 0 2 4 3 0 1 0 0 0 0 Gyeongbuk 0 0 0 1 6 2 0 0 0 0 0 0 Gyeongnam 0 1 0 3 6 1 0 0 0 0 0 0 Jeju 0 0 0 0 0 1 0 0 0 0 0 0
Cum: Cumulative counts from 1st week to current week in a year
* The reported data for year 2017, 2018 are provisional but the data from 2013 to 2016 are finalized data.
† According to surveillance data, the reported cases may include all of the cases such as confirmed, suspected, and asymptomatic carrier in the group. § Cum. 5-year average is mean value calculated by cumulative counts from 1st week to current week for 5 preceding years.
Reporting area
Diseases of Category Ⅱ
Measles Mumps Rubella Viral hepatitis B(Acute) Current week Cum.2018 Cum. 5-year average§ Current week Cum.2018 Cum. 5-year average§ Current week Cum.2018 Cum. 5-year average§ Current week Cum.2018 Cum. 5-year average§ Overall 5 7 0 253 749 923 5 10 0 13 26 8 Seoul 1 2 0 28 84 93 1 2 0 2 4 2 Busan 0 0 0 16 48 75 0 0 0 1 2 1 Daegu 0 0 0 6 34 18 0 0 0 1 2 0 Incheon 0 1 0 13 43 29 0 0 0 0 1 0 Gwangju 0 0 0 10 21 86 0 0 0 0 0 0 Daejeon 0 0 0 9 25 39 1 1 0 1 1 0 Ulsan 0 0 0 9 31 27 0 0 0 2 2 1 Sejong 0 0 0 1 3 4 1 1 0 0 0 0 Gyonggi 3 3 0 71 184 184 0 0 0 2 5 2 Gangwon 0 0 0 12 25 41 0 1 0 0 0 0 Chungbuk 0 0 0 4 17 16 0 0 0 2 2 0 Chungnam 0 0 0 15 47 29 2 2 0 0 1 0 Jeonbuk 0 0 0 7 23 101 0 2 0 0 0 1 Jeonnam 0 0 0 10 28 56 0 0 0 0 0 1 Gyeongbuk 0 0 0 12 37 26 0 1 0 0 1 0 Gyeongnam 1 1 0 26 84 83 0 0 0 2 5 0 Jeju 0 0 0 4 15 16 0 0 0 0 0 0
Cum: Cumulative counts from 1st week to current week in a year
* The reported data for year 2017, 2018 are provisional but the data from 2013 to 2016 are finalized data.
† According to surveillance data, the reported cases may include all of the cases such as confirmed, suspected, and asymptomatic carrier in the group. § Cum. 5-year average is mean value calculated by cumulative counts from 1st week to current week for 5 preceding years.
Table 2. (Continued) Reported cases of infectious diseases by geography, week ending January 20, 2018 (3rd Week)*
Unit: No. of cases†
Reporting area
Diseases of Category Ⅱ Diseases of Category Ⅲ
Japanese encephalitis Varicella Malaria Scarlet fever¶ Current week Cum.2018 Cum. 5-year average§ Current week Cum.2018 Cum. 5-year average§ Current week Cum.2018 Cum. 5-year average§ Current week Cum.2018 Cum. 5-year average§ Overall 0 0 0 1,453 5,364 3,956 1 5 4 441 1,236 443 Seoul 0 0 0 214 738 394 0 0 2 54 165 48 Busan 0 0 0 59 205 261 0 0 0 29 96 35 Daegu 0 0 0 71 260 236 0 0 0 11 34 18 Incheon 0 0 0 90 338 232 0 2 1 24 58 18 Gwangju 0 0 0 60 244 101 1 1 0 22 58 23 Daejeon 0 0 0 38 146 104 0 0 0 10 43 12 Ulsan 0 0 0 35 130 129 0 0 0 20 52 18 Sejong 0 0 0 8 19 22 0 0 0 5 10 1 Gyonggi 0 0 0 404 1,603 1,140 0 1 1 138 334 132 Gangwon 0 0 0 54 152 160 0 0 0 9 24 5 Chungbuk 0 0 0 56 194 82 0 1 0 11 36 7 Chungnam 0 0 0 54 220 191 0 0 0 10 39 21 Jeonbuk 0 0 0 60 217 186 0 0 0 19 59 17 Jeonnam 0 0 0 69 213 182 0 0 0 23 67 16 Gyeongbuk 0 0 0 65 224 166 0 0 0 22 51 28 Gyeongnam 0 0 0 69 290 281 0 0 0 28 92 39 Jeju 0 0 0 47 171 89 0 0 0 6 18 5
Cum: Cumulative counts from 1st week to current week in a year
* The reported data for year 2017, 2018 are provisional but the data from 2013 to 2016 are finalized data.
† According to surveillance data, the reported cases may include all of the cases such as confirmed, suspected, and asymptomatic carrier in the group. § Cum. 5-year average is mean value calculated by cumulative counts from 1st week to current week for 5 preceding years.
Reporting area
Diseases of Category Ⅲ
Meningococcal meningitis Legionellosis Vibrio vulnificus sepsis Murine typhus Current week Cum.2018 Cum. 5-year average§ Current week Cum.2018 Cum. 5-year average§ Current week Cum.2018 Cum. 5-year average§ Current week Cum.2018 Cum. 5-year average§ Overall 0 1 0 8 17 2 0 0 0 1 1 0 Seoul 0 0 0 3 5 1 0 0 0 1 1 0 Busan 0 0 0 0 2 0 0 0 0 0 0 0 Daegu 0 0 0 0 0 0 0 0 0 0 0 0 Incheon 0 0 0 0 0 0 0 0 0 0 0 0 Gwangju 0 0 0 0 0 0 0 0 0 0 0 0 Daejeon 0 0 0 0 1 0 0 0 0 0 0 0 Ulsan 0 0 0 0 0 0 0 0 0 0 0 0 Sejong 0 0 0 0 0 0 0 0 0 0 0 0 Gyonggi 0 0 0 2 5 1 0 0 0 0 0 0 Gangwon 0 0 0 0 0 0 0 0 0 0 0 0 Chungbuk 0 0 0 1 1 0 0 0 0 0 0 0 Chungnam 0 1 0 0 0 0 0 0 0 0 0 0 Jeonbuk 0 0 0 1 1 0 0 0 0 0 0 0 Jeonnam 0 0 0 0 0 0 0 0 0 0 0 0 Gyeongbuk 0 0 0 0 0 0 0 0 0 0 0 0 Gyeongnam 0 0 0 0 1 0 0 0 0 0 0 0 Jeju 0 0 0 1 1 0 0 0 0 0 0 0
Cum: Cumulative counts from 1st week to current week in a year
* The reported data for year 2017, 2018 are provisional but the data from 2013 to 2016 are finalized data.
† According to surveillance data, the reported cases may include all of the cases such as confirmed, suspected, and asymptomatic carrier in the group. § Cum. 5-year average is mean value calculated by cumulative counts from 1st week to current week for 5 preceding years.
Table 2. (Continued) Reported cases of infectious diseases by geography, week ending January 20, 2018 (3rd Week)*
Unit: No. of cases†
Reporting area
Diseases of Category Ⅲ
Scrub typhus Leptospirosis Brucellosis with renal syndromeHemorrhagic fever Current week Cum.2018 Cum. 5-year average§ Current week Cum.2018 Cum. 5-year average§ Current week Cum.2018 Cum. 5-year average§ Current week Cum.2018 Cum. 5-year average§ Overall 22 89 31 6 14 0 3 10 0 11 32 18 Seoul 2 2 1 0 0 0 0 0 0 1 2 1 Busan 1 1 2 0 0 0 0 0 0 0 0 0 Daegu 0 0 0 0 0 0 0 2 0 0 0 0 Incheon 0 2 1 0 0 0 0 0 0 1 1 1 Gwangju 0 0 1 0 0 0 0 0 0 0 0 0 Daejeon 1 1 1 1 1 0 0 0 0 1 1 0 Ulsan 0 3 1 0 0 0 0 0 0 0 0 0 Sejong 0 0 0 0 0 0 0 0 0 0 0 0 Gyonggi 1 5 3 0 1 0 2 4 0 0 5 7 Gangwon 0 1 1 0 0 0 0 1 0 1 1 2 Chungbuk 1 4 0 0 0 0 0 1 0 1 1 1 Chungnam 3 9 2 0 0 0 1 2 0 0 2 0 Jeonbuk 0 3 3 0 0 0 0 0 0 0 0 2 Jeonnam 4 10 6 0 0 0 0 0 0 0 3 1 Gyeongbuk 1 6 1 0 0 0 0 0 0 1 3 2 Gyeongnam 8 38 7 5 12 0 0 0 0 5 13 1 Jeju 0 4 1 0 0 0 0 0 0 0 0 0
Cum: Cumulative counts from 1st week to current week in a year
* The reported data for year 2017, 2018 are provisional but the data from 2013 to 2016 are finalized data.
† According to surveillance data, the reported cases may include all of the cases such as confirmed, suspected, and asymptomatic carrier in the group. § Cum. 5-year average is mean value calculated by cumulative counts from 1st week to current week for 5 preceding years.
Reporting area
Diseases of Category Ⅲ Diseases of Category Ⅳ Syphilis CJD/vCJD Tuberculosis Dengue fever Current week Cum.2018 Cum. 5-year average§ Current week Cum.2018 Cum. 5-year average§ Current week Cum.2018 Cum. 5-year average§ Current week Cum.2018 Cum. 5-year average§ Overall 57 146 54 2 7 1 658 1,770 1,840 6 13 9 Seoul 18 44 10 0 2 0 120 294 380 1 4 4 Busan 2 7 4 1 1 0 46 130 134 0 3 0 Daegu 2 6 3 0 0 0 24 76 93 0 1 1 Incheon 2 9 5 0 0 0 32 82 98 0 0 1 Gwangju 2 5 2 0 0 0 14 32 51 0 0 0 Daejeon 1 7 1 0 0 0 11 37 46 0 0 0 Ulsan 0 0 0 0 0 0 15 36 35 1 1 0 Sejong 0 0 0 0 0 0 2 9 4 0 0 0 Gyonggi 16 34 13 0 1 1 148 401 386 2 2 2 Gangwon 3 4 2 0 0 0 30 82 74 0 0 0 Chungbuk 0 4 1 0 0 0 18 56 50 0 0 0 Chungnam 1 5 1 1 2 0 35 91 71 0 0 0 Jeonbuk 0 0 2 0 0 0 28 77 70 0 0 0 Jeonnam 1 4 2 0 0 0 34 90 85 1 1 0 Gyeongbuk 3 6 3 0 1 0 49 132 125 1 1 0 Gyeongnam 3 8 3 0 0 0 46 119 119 0 0 1 Jeju 3 3 2 0 0 0 6 26 21 0 0 0
Cum: Cumulative counts from 1st week to current week in a year
* The reported data for year 2017, 2018 are provisional but the data from 2013 to 2016 are finalized data.
† According to surveillance data, the reported cases may include all of the cases such as confirmed, suspected, and asymptomatic carrier in the group. § Cum. 5-year average is mean value calculated by cumulative counts from 1st week to current week for 5 preceding years.
Table 2. (Continued) Reported cases of infectious diseases by geography, week ending January 20, 2018 (3rd Week)*
Unit: No. of cases†
Reporting area
Diseases of Category Ⅳ
Q fever Lyme Borreliosis SFTS Zika virus infection Current week Cum.2018 Cum. 5-year average§ Current week Cum.2018 Cum. 5-year average§ Current week Cum.2018 Cum. 3-year average§ Current week Cum.2018 Cum. 3-year average§ Overall 9 44 0 5 10 0 0 0 0 0 0 Seoul 0 0 0 2 4 0 0 0 0 0 0 Busan 2 3 0 0 1 0 0 0 0 0 0 Daegu 0 2 0 0 0 0 0 0 0 0 0 Incheon 0 0 0 0 0 0 0 0 0 0 0 Gwangju 0 0 0 0 0 0 0 0 0 0 0 Daejeon 0 2 0 0 0 0 0 0 0 0 0 Ulsan 0 4 0 1 1 0 0 0 0 0 0 -Sejong 0 0 0 0 0 0 0 0 0 0 0 Gyonggi 2 17 0 1 3 0 0 0 0 0 0 Gangwon 0 0 0 0 0 0 0 0 0 0 0 Chungbuk 0 4 0 0 0 0 0 0 0 0 0 Chungnam 2 6 0 0 0 0 0 0 0 0 0 Jeonbuk 0 0 0 0 0 0 0 0 0 0 0 Jeonnam 1 2 0 0 0 0 0 0 0 0 0 Gyeongbuk 1 1 0 0 0 0 0 0 0 0 0 Gyeongnam 1 3 0 1 1 0 0 0 0 0 0 Jeju 0 0 0 0 0 0 0 0 0 0 0
-Cum: Cumulative counts from 1st week to current week in a year
* The reported data for year 2017, 2018 are provisional but the data from 2013 to 2016 are finalized data.
† According to surveillance data, the reported cases may include all of the cases such as confirmed, suspected, and asymptomatic carrier in the group. § Cum. 5-year average is mean value calculated by cumulative counts from 1st week to current week for 5 preceding years.
● 2018년도 제3주 인플루엔자 표본감시(17개 시·도 보건환경연구원 및 52개 의료기관) 결과, 의사환자분율은 외래환자 1,000명당 59.6명으로 지난주(69.0명)대비 감소
※ 2017-2018절기 유행기준은 6.6명(/1,000)
Figure 1. Weekly proportion of influenza-like illness per 1,000 outpatients, 2013-2014 to 2017-2018 flu seasons
0 20 10 40 30 60 70 80 90 50 100 36 38 40 42 44 46 48 50 52 2 4 6 8 10 12 14 16 18 20 22 24 26 28 30 32 34 ILI per 1,000 week 2014-2015 2015-2016 2013-2014 2016-2017 2017-2018
2. Hand, Foot and Mouth Disease(HFMD), Republic of Korea, weeks ending January 20, 2018 (3rd week)
●2018년도 제3주 수족구병 표본감시(전국 95개 의료기관) 결과, 의사환자 분율은 외래환자 1,000명당 0.3명으로 전주(0.4명) 대비 감소
※ 수족구병은 2009년 6월 법정감염병으로 지정되어 표본감시체계로 운영
Figure 2. Weekly proportion of hand, foot and mouth disease per 1,000 outpatients, 2013-2018
1 3 5 7 9 11 13 2017 2018 2016 2015 2014 2013 15 17 19 21 23 25 27 29 31 33 35 37 39 41 43 45 47 49 51 week 0 10.0 5.0 20.0 15.0 30.0 35.0 40.0 45.0 50.0 25.0 55.0 No. of outpatients / 1,000
3. Ophthalmologic infectious disease, Republic of Korea, weeks ending January 20, 2018 (3rd week)
●2018년도 제3주 유행성각결막염의 표본감시(전국 92개 의료기관) 결과, 외래환자 1,000명당 분율은 12.5명으로 전주 14.5명 대비 감소 ●동기간 급성출혈성결막염의 환자 분율은 0.8명으로 지난주 1.1명 대비 감소
Figure 3. Weekly proportion of epidemic keratoconjunctivitis per 1,000 outpatients
0 10 20 30 40 50 60 1 3 5 7 9 11 13 15 17 19 21 23 25 27 29 31 33 35 37 39 41 43 45 47 49 51 53 No. of outpatients / 1,000 week 2014 2015 2016 2017 2018
Figure 4. Weekly proportion of acute hemorrhagic conjunctivitis per 1,000 outpatients
0 1 2 3 4 5 1 3 5 7 9 11 13 15 17 19 21 23 25 27 29 31 33 35 37 39 41 43 45 47 49 51 53 No. of outpatients / 1,000 week 2014 2015 2016 2017 2018
▣ Waterborne and foodborne disease outbreaks, Republic of Korea, weeks ending January 20, 2018 (3rd week)
●2018년도 제3주 보고기관(전국 254개 보건소)에서 집단발생이 8건이 발생하였으며 누적발생건수는 20건(사례수 150명)이 발생함.
1.3 수인성 및 식품매개 감염병 집단발생 주간 현황(3rd week)
▶ 자세히 보기 : 질병관리본부 → 정책/사업 → 감염병감시 → 표본감시주간소식지
Figure 5. Number of waterborne and foodborne disease outbreaks reported by week, 2017-2018
0 5 15 20 25 30 10 1 3 5 7 9 11 13 15 17 19 21 23 25 27 29 31 33 35 37 39 41 43 45 47 49 51 week
2018 2017 Average no. of cases in last 5 years(2012-2016)
35
No. of outbreaks
Unit: No. of cases/sentinels
Cum: Cumulative counts from 1st week to current week in a year
† According to surveillance data, the reported cases may include all of the cases such as confirmed, suspected, and asymptomatic carrier in the group. § Cum. 5-year average is mean value calculated by cumulative counts from 1st week to current week for 5 preceding years.
※ 문의: (043)719-7118, 7132
Gonorrhea Chlamydia Genital herpes Condyloma acuminata Current week Cum.2018 Cum. 5-year average§ Current week Cum.2018 Cum. 5-year average§ Current week Cum.2018 Cum. 5-year average§ Current week Cum.2018 Cum. 5-year average§ Total 1.7 2.1 2.3 2.3 3.7 3.3 2.2 4.2 3.8 1.8 2.7 2.5
2.1 병원체감시 : 인플루엔자 및 호흡기바이러스 주간 감시 현황
(3rd week)
2. Respiratory viruses, Republic of Korea, weeks ending January 20, 2018 (3rd week)
● 2018년도 제3주 호흡기검체에 대한 유전자 검사(17개 시·도 보건환경연구원 및 전국 52개 참여의료기관)결과, 80.1%의 호흡기바이러스가 검출되었음.
(최근 4주 평균 302개의 호흡기 검체에 대한 유전자 검사결과를 나타내고 있음) ※ 주별통계는 잠정통계이므로 변동가능
- HAdV : human Adenovirus, HPIV : human Parainfluenza virus, HRSV : human Respiratory syncytial virus, IFV : Influenza virus, HCoV : human Coronavirus, HRV : human Rhinovirus, HBoV : human Bocavirus, HMPV : human Metapneumovirus
※ the rate of detected cases between December. 24. 2017. – January. 20. 2018, (Average No. of detected cases is 302 in last 4 weeks) ∀ 2017 Cum. : the rate of detected cases between January. 01. 2017. - December. 30. 2017.
▶ 자세히 보기 : 질병관리본부 → 알림 → 주간 질병감시정보
Figure 6. Number of specimens positive for influenza by subtype, 2016-2017 to 2017-2018 flu season
0 100 120 140 160 80 60 40 20 0 20.0 10.0 40.0 30.0 60.0 70.0 80.0 90.0 50.0 100.0 120.0
1. Influenza viruses, Republic of Korea, weeks ending January 20, 2018 (3rd week)
●2018년도 제3주에 17개 시·도 보건환경연구원 및 52개 의료기관에서 의뢰된 호흡기검체 311건 중 199건 양성(A/H1N1pdm09 2건, A(H3N2) 85건, B형 112건) 180 200 No. of positives Percent positives (%) week
A(H3N2) A(not subtyped) A(H1N1)pdm09 B Percent positive
34 36373839404142434445464748495051 52 1 2 3 4 5 6 7 8 9101112131415161718192021222324252627282930313233 35
2017-2018
(week) Weeklytotal
Detection rate (%)
HAdV HPIV HRSV IFV HCoV HRV HBoV HMPV
52 88.3 2.1 1.4 5.3 66.8 6.7 3.9 1.1 1.1 1 87.5 3.2 0.0 8.2 67.7 5.7 2.5 0.0 0.0 2 71.3 2.1 0.6 4.5 57.3 5.7 0.6 0.0 0.6 3 80.1 2.3 1.6 2.3 64.0 6.8 1.9 0.3 1.0 Cum.※ 81.3 2.4 0.9 5.0 63.7 6.2 2.2 0.3 0.7 2017 Cum.∀ 56.6 3.7 6.3 4.6 10.9 4.4 19.4 2.0 5.3
◆ Acute gastroenteritis-causing viruses
Week No. of sample No. of detection (Detection rate, %)
Group A Rotavirus Norovirus Enteric Adenovirus Astrovirus Total
2017 51 81 7 (8.6) 35 (43.2) 1 (1.2) 1 (1.2) 44 (54.3)
52 82 9 (11.0) 26 (31.7) 0 (0.0) 3 (3.7) 38 (46.3)
2018 1 57 3 (5.3) 14 (24.6) 3 (5.3) 1 (1.8) 21 (36.8)
2 46 4 (8.7) 12 (26.1) 2 (4.4) 1 (2.2) 19 (41.3)
Cum. 103 7 (6.8) 26 (25.2) 5 (4.9) 2 (1.9) 40 (38.8)
* The samples were collected from children ≤5 years of sporadic acute gastroenteritis in Korea.
◆ Acute gastroenteritis-causing bacteria
Week SampleNo. of
No. of isolation (Isolation rate, %) Salmonella
spp.
Pathogenic
E.coli Shigella spp. V.parahaemolyticus V. choleraeCampylobacter spp. C.perfringens S. aureus B. cereus Total
2017 51 165 1 (0.7) 0 (0) 0 (0) 0 (0) 0 (0) 0 (0) 1 (0.6) 2 (1.3) 1 (0.7) 5 (3.0) 52 225 3 (1.3) 3 (1.3) 0 (0) 0 (0) 0 (0) 1 (0.4) 2 (0.9) 4 (1.8) 3 (1.3) 16 (7.1) 2018 1 139 2 (1.4) 0 (0) 0 (0) 0 (0) 0 (0) 1 (0.7) 2 (1.4) 2 (1.4) 1 (0.7) 8 (5.8) 2 193 1 (0.5) 2 (1.0) 0 (0) 0 (0) 0 (0) 1 (0.5) 4 (2.0) 1 (0.5) 1 (0.5) 10 (5.2) Cum. 332 3 (0.9) 2 (0.6) 0 (0) 0 (0) 0 (0) 2 (0.6) 6 (1.8) 3 (0.9) 2 (0.6) 18 (5.4)
* Bacterial Pathogens ; Salmonella spp., E. coli (EHEC, ETEC, EPEC, EIEC), Shigella spp., Vibrio parahaemolyticus, Vibrio cholerae, Campylobacter spp., Clostridium perfringens, Staphylococcus aureus, Bacillus cereus, Listeria monocytogenes, Yersinia enterocolitica.
* Hospital participating in laboratory surveillance in 2018 (70 hospitals)
▶ 자세히 보기 : 질병관리본부 → 알림 → 주간 질병감시정보
Korea, weeks ending January 13, 2018 (2nd week)
● 2018년도 제2주 실험실 표본감시(17개 시·도 보건환경연구원 및 70개 의료기관) 급성설사질환 유발 바이러스 검출 건수는 19건(41.3%), 세균 검출 건수는 10건(5.2%) 이었음.
0 20 40 60 80 1 5 9 13 17 21 25 29 33 37 41 45 49 53 Detection rate (%) week
2.3 병원체감시 : 엔테로바이러스 실험실 주간 감시 현황
(2nd week)
▣ Detection rate of enterovirus in enterovirus sentinel surveillance, Republic of Korea, weeks ending
January 13, 2018 (2nd week)
● 2018년도 제2주 실험실 표본감시(8개 시·도 보건환경연구원, 전국 60개 참여병원)결과, 새로 검출된 엔테로바이러스 1건(2018년 누적 2건, 양성률 6.9%) 중 무균성수막염 0건(2018년 누적 0건), 수족구병 및 포진성구협염 1건(2018년 누적 1건), 합병증 동반 수족구 0건(2018년 누적 0건), 기타 1건(2017년 누적 1건)임. ◆ Aseptic meningitis ◆ HFMD and HerpanginaFigure 8. Detection rate of enterovirus in HFMD and herpangina patients from 2017 to 2018
◆ HFMD with Complications 0 5 10 20 15 25 1 5 9 13 17 21 25 29 33 37 41 45 49 53 0 4 3 2 1 5 6 7 8 9 10 1 5 9 13 17 21 25 29 33 37 41 45 49 53
2018 Enterovirus detection rate (%) 2017 Enterovirus detection rate (%)
Figure 7. Detection rate of enterovirus in aseptic meningitis patients from 2017 to 2018
2017 Enterovirus detection rate (%) 2018 Enterovirus detection rate (%)
2018 Enterovirus detection rate (%) 2017 Enterovirus detection rate (%)
Detection rate (%)
Detection rate (%)
week
나타내며, 「Cum. 2017」은 2017년 1주부터 해당 주까지의 누계 건수, 그리고 「5-year weekly average」는 지난 5년(2012-2016년) 해당 주의 신고건수와 이전 2주, 이후 2주의 신고건수(총 25주) 평균으로 계산된다. 그러므로 「Current week」과 「5-year weekly average」의 신고 건수를 비교하면 해당 주 단위 시점과 예년의 신고 수준을 비교해 볼 수 있다. 「Total no. of cases by year」는 지난 5년간 해당 감염병 현황을 나타내는 확정 통계이며 연도별 현황을 비교해 볼 수 있다.
예) 2017년 12주의 「5-year weekly average(5년간 주 평균)」는 2012년부터 2016년의 10주부터 14주까지의 신고 건수를 총 25주로 나눈 값으로 구해진다.
* 5-year weekly average(5년 주 평균)=(X1 + X2 + … + X25)/25
10주 11주 12주 13주 14주 2017년 해당 주 2016년 X1 X2 X3 X4 X5 2015년 X6 X7 X8 X9 X10 2014년 X11 X12 X13 X14 X15 2013년 X16 X17 X18 X19 X20 2012년 X21 X22 X23 X24 X25
<Table 2>는 17개 시·도 별로 구분한 법정감염병 보고 현황을 보여 주고 있으며, 각 감염병별로 「Cum, 5-year average」와 「Cum, 2017」을 비교해 보면 최근까지의 누적 신고건수에 대한 이전 5년 동안 해당 주까지의 평균 신고건수와 비교가 가능하다. 「Cum, 5-year average」는 지난 5년(2012-2016년) 동안의 동기간 신고 누계 평균으로 계산된다.
「주간 건강과 질병, PHWR」은 질병관리본부에서 시행되는 조사사업을 통해 생성된 감시 및 연구 자료를 기반으로 근거중심의 건강 및 질병관련 정보를 제공하고자 최선을 다할 것이며, 제공되는 정보는 질병관리본부의 특정 의사와는 무관함을 알립니다. 본 간행물에서 제공되는 감염병 통계는 「감염병의 예방 및 관리에 관한 법률」 에 의거, 국가 감염병감시체계를 통해 신고된 자료를 기반으로 집계된 것으로 집계된 당해년도 자료는 의사환자 단계에서 신고된 것이며 확진 결과시 혹은 다른 병으로 확인 될 경우 수정 될 수 있는 잠정 통계임을 알립니다. 「주간 건강과 질병, PHWR」은 질병관리본부 홈페이지를 통해 주간 단위로 게시되고 있으며, 정기적 구독을 원하시는 분은 [email protected]로 신청 가능합니다. 이메일을 통해 보내지는 본 간행물의 정기적 구독 요청시 구독자의 성명, 연락처, 직업 및 이메일 주소가 요구됨을 알려 드립니다. 「주간 건강과 질병」 발간 관련 문의: [email protected]/ 043-249-3028/3003 발간등록번호 11-1351159-000002-03 창 간 : 2008년 4월 4일 발 행 : 2018년 1월 25일 발 행 인 :정은경 편 집 인 : 박도준 편집위원 : 최영실, 김기순, 최병선, 조신형, 조성범, 김봉조, 구수경, 김용우, 이동한, 조은희, 이은규, 신영림, 김청식, 전경아, 권효진 편 집 : 질병관리본부 유전체센터 의과학지식관리과