저작자표시-비영리-변경금지 2.0 대한민국 이용자는 아래의 조건을 따르는 경우에 한하여 자유롭게 l 이 저작물을 복제, 배포, 전송, 전시, 공연 및 방송할 수 있습니다. 다음과 같은 조건을 따라야 합니다: l 귀하는, 이 저작물의 재이용이나 배포의 경우, 이 저작물에 적용된 이용허락조건 을 명확하게 나타내어야 합니다. l 저작권자로부터 별도의 허가를 받으면 이러한 조건들은 적용되지 않습니다. 저작권법에 따른 이용자의 권리는 위의 내용에 의하여 영향을 받지 않습니다. 이것은 이용허락규약(Legal Code)을 이해하기 쉽게 요약한 것입니다. Disclaimer 저작자표시. 귀하는 원저작자를 표시하여야 합니다. 비영리. 귀하는 이 저작물을 영리 목적으로 이용할 수 없습니다. 변경금지. 귀하는 이 저작물을 개작, 변형 또는 가공할 수 없습니다.
Thesis of the Degree of Doctor of Philosophy
Structural basis for Auxin induced
transcription regulator interaction and
the control of auxin response
August 2016
Department of Agricultural Biotechnology
Seoul National University
Biomodulation major
Mookyoung Han
i
Abstract
The plant hormone auxin is involved in all stages of plant
development. Aux/IAAs are the transcriptional repressors that bind to
the Auxin Response Factors (ARFs) to regulate the gene expression
upon auxin release. Aux/IAA have highly conserved C-terminal
domains (domains III-IV) that mediate both homotypic and heterotypic
interactions between Aux/IAA and ARF family proteins. It has been
known that Aux/IAA and ARF form homo- and hetero-oligomers for
the transcriptional regulation, but what determines their association
states is poorly understood. Here I report, to our knowledge, the first
solution structure of domain III−IV of Aux/IAA17 (IAA17), and
characterize molecular interactions underlying the homotypic and
heterotypic oligomerization. The structure exhibits a compact β-grasp
fold with a highly dynamic insert helix that is unique in Aux/IAA
family proteins. The insert helix exhibited fast motions in the ps-ns
time scale from 15N relaxation data, but the amplitude of the motion is
likely limited to the local neighborhood. IAA17 associates to form a
heterogeneous ensemble of front-to-back oligomers in a
concentration-dependent manner. IAA17 and ARF5 associate to form homo- or
hetero-oligomers using a common scaffold and binding interfaces, but
ii
their affinities vary significantly. The equilibrium dissociation
constants (K
D) for homo-oligomerization are 6.6 μM and 0.87 μM for
IAA17 and ARF5, respectively, whereas hetero-oligomerization reveals
a ∼10- to ∼100-fold greater affinity (K
D= 73 nM). Thus, individual
homo-oligomers of IAA17 and ARF5 spontaneously exchange their
subunits to form alternating hetero-oligomers for transcriptional
repression. Oligomerization is mainly driven by electrostatic
interactions, so that charge complementarity at the interface determines
the binding affinity. The heterotypic association between ARF1
repressor and Aux/IAA17 was weaker than individual homotypic
associations, in contrast to the preferred heterotypic association
between ARF5 and Aux/IAA17. This finding suggests that ARF
repressors do not respond to auxin, simply competing with ARF
activators for binding to the auxin response element. Selective binding
might be a general strategy of auxin response transcriptional regulation
in plants.
Keyword : Auxin, ARF, Aux/IAA, NMR, Structure, Transcription factor Student Number : 2013-31321
iii
Contents
ABSTRACT ... I
CONTENTS ... III
LIST of TABLES ... IV
LIST of FIGURES ... V
ABBREVIATIONS ... VII
INTRODUCTION... 1
Materials and Methods ... 8
Results ... 14
Part1. Structure of Aux/IAA17 domain III-IV ... 15
Part2. Interaction of Aux/IAA 17 domain III-IV and ARF5 domain III-IV ... 46
Part3. Interaction of Aux/IAA 17 domain III-IV and ARF1 domain III-IV ... 61
Discussion ... 88
Reference ... 92
iv
LIST of TABLES
Table1.
Restraints and structural statistics of IAA17M2... 29
Table2.
Thermodynamic parameters for the homodimer and heterodimer formation between of IAA17 domains III-IV and ARF5 domains III-IV... 56
Table3.
Thermodynamic parameters for the homodimer and heterodimer formation between domains III-IV of ARF1, IAA17 and ARF5 obtained by isothermal titration calorimetry... 85
v
LIST of Figures
Figure 1. Model of auxin signal transduction. ... 6
Figure 2. Size exclusion chromatograms ... 16
Figure 3. Multiple sequence alignment of IAA and ARF family (A. thaliana) ... 18
Figure 4. Structure of Aux/IAA17 DIII-IV, ARF5 DIII-IV, and ARF1 DIII-IV ... 20
Figure 5. 1H-15N HSQC spectra of 15N -IAA17III-IV ... 22
Figure 6. Backbone assignment of Aux/IAA17 Domain III-IV on 2DHSQC ... 27
Figure 7. Structures of domain III-IV of IAA17, ARF5, and ARF7
.
... 30Figure 8. 1H-15N HSQC of IAA17
M2 and IAA17M2(Del159-169) ... 32
Figure 9. Plots of relaxation parameters of backbone amide groups of IAA17M2 ... 34
Figure 10.Multiple sequence aliment of Aux/IAA in Arabidopsis ... 38
Figure 11. Spin label residue on Aux/IAA17 structure
... 40
Figure 12. Paramagnetic effect from F148C-MTSL and F162C-MTSL
.
... 42Figure 13. Backbone amides with PRE in the three-dimensional structure. ... 44
Figure 14. Homodimer interface of Aux/IAA17 domain III-IV ... 50
Figure 15.Heterodimer interface of Aux/IAA17 domain III-IV ... 52
Figure 16. KD of the homodimer and hterodimer formation of IAA17IIIIV and ARF5IIIIV ... 54
Figure 17. KD of the homodimer and heterodimer formation of IAA17M2
(Del159-169) ... 57
Figure 18. KD of the homodimer and heterodimer formation of wild-type IAA17 domain
III-IV ... 59
Figure 19. Multiple Sequence alignment of DIII/IV of ARF1, ARF5, ARF7, and IAA17 ... 63
Figure 20. Binding interface of ARF5 and ARF1 ... 65
vi
Figure 22. Correlation plots between experimental and back-calculated RDCs for the ARF1 structure ... 69
Figure 23. KD of the homodimer and heterodimer formation of IAA17IIIIV, ARF5IIIIV and
ARF1 IIIIV. ... 75
Figure 24. Heterodimer basic interface of Aux/IAA17 domain III-IV ... 77
Figure 25. Domain III-IV structure of ARF5(A) homodimer and ARF1(B)Heterodimer ... 79
Figure 26. KD of interface mutation on ARF1DIII-IV positive interface ... 81
Figure 27. KD of interface mutation on ARF1DIII-IV negative interface and ARF5DIII-IV
positive interface. ... 83
Figure 28. A model of transcriptional control from the interaction between IAA and ARF ... 86
vii
ABBREVIATIONS
IAA
Indole-3-acetic acid
ARF
Auxin Response Factor
TIR
Transport inhibitor response
TPL
TOPLESS
CSI
Chemical shifts index
CSP
Chemical shifts perturbation
HSQC
Heteronuclear single quantum coherence spectroscopy
ITC
Isothermal titration calorimetry
1
Introduction
Auxin is a major plant hormone that is involved morphogenetic regulation of the plant development (1, 2). Aux/IAA and auxin response factors (ARFs) regulate the expression of auxin response genes (3). Phylogenetic analysis of the Aux/IAA and ARF families has shown that both are represented by multiple members in most plants studies (22, 23, 24). The Arabidopsis
thaliana genome encodes 29 IAA and 23 ARF proteins (22). There are two
types of transcription regulators for mediate transcriptional responses to auxin (4). ARFs (auxin response factor) regulate activation or repression of auxin-responsive genes expression (5). Aux/IAAs regulate transcriptional repressor for regulation ARF (7-9). (Figure 1 A)
ARF transcription factors contain a DNA-binding domain (DBD) that recognizes the auxin-response cis element (AuxREs), cis-regulatory sequences that at their core contain a TGTC motif that is sufficient to recruit ARF proteins (10). A middle region (MD) that followed by DBD mediates transcriptional regulation. ARF protein can be group into two classes from the
Arabidopsis, depends on which rich residues are contained in the middle
region (4). Activators of ARF are comprised with glutamine (Q), serine (S) and leucine (L)- rich middle region that is based on transient gene expression assays in protoplasts. The remaining ARFs are classified as repressor that is usually enriched in serine (S) and some case of proline (P), leucine (L) and glycine (G) (4). Most ARFs (exclude ARF3, ARF23 and ARF17) has a C-terminal domain III-IV (Figure 1 A), which is important for the interaction
2
between ARFs and Aux/IAA proteins (8,11). Domain III-IV of ARFs that mediates protein-protein interactions with IAA. The C-terminal domains III-IV exhibit high sequence homology across the IAA and ARF family proteins, and promote both their homotypic (IAA-IAA or ARF-ARF) and heterotypic (IAA-ARF) association (8,11). It has been suggested that the association of domain III-IV between IAA and ARF is responsible for the resultant transcriptional repression.
Aux/IAA contains 4 domains, domain I interacts with TPL (TOPLESS) protein that is co-repressor for transcriptional regulation (15). Domain II that followed by domain I mediates the interaction with TIR1 (F-box protein) for degradation under high-auxin condition (Figure 1 C) (16). The domain III-IV (PB domain) together mediate protein-protein interaction with domain III-IV (PB domain) of ARF for inhibits transcriptional activity (Figure 1 B) (8,17). In the absence of auxin, IAA associates with ARF and represses its transcriptional activity. When auxin is released, IAA interacts with the F-box protein Transport Inhibitor Response 1 (TIR1) that assembles into an SKP1-Cullin-F-box-type E3 ligase complex that causes IAA degradation (13,14). Elevated auxin levels are thus detected by reductions in cellular IAA levels, resulting in inhibition of ARF-mediated gene expression.
Although the interaction between IAA and ARF is of great biological significance, a detailed structural characterization of domain III-IV has been hampered owing to its aggregative tendency to form heterogeneous oligomers. Previous analysis of multiple sequence alignments predicted a structural link
3
between domains III-IV and the Phox and Bem 1 (PB1) domain (18). The PB1 domain, a protein interaction module involved in diverse biological processes, forms a heterodimer in a front-to-back manner via well-conserved acidic and basic residues at the interfaces (19). The essential residues at the dimer interface of PB1 were highly conserved in domain III-IV of IAA and ARF family proteins, suggesting that they are important for oligomerization. Indeed, mutation of the conserved residues has recently allowed for determination of the crystal structure of domain III-IV in ARF family proteins (20, 21). In Arabidopsis thaliana, approximately half of the Aux/IAA family proteins contain a long insert sequence between the domain III and the domain IV, whereas none of the ARF family proteins carries the insert sequence (Figure 3, Figure 10).The structures of the domain III−IV are similar between PsIAA4 and ARF5 and ARF7 and Aux/IAA17 (27, 25, 26), except for the insert region. The function of insert sequences is not yet discovered.
The domain III-IV interaction between ARF and Aux/IAA protein is important to define their unique biological functions. Several study suggested on combinatorial protein-protein interaction between Aux/IAA and ARF that are based on qualitative analysis (Y2H, full-down assay, co-expression and sequence homology) (28-32). Most of these studies show similar results ARF activator and AUX/IAA, however the binding between Aux/IAA and ARF repressor is unclear (28-32).
Here, I report for the first time the solution structure of domain III-IV of
4
its homotypic and heterotypic association. IAA17 adopts a compact b-grasp fold with a highly dynamic helix that appears to be unique amongst the IAA family proteins. I employed the site-directed spin-labeling for the paramagnetic relaxation enhancements (PRE) to probe the amplitude of the motion of the dynamic helix. Based on the fact that PRE by the nitroxide spin label can be observed at distances up to 27 Å, the motion of the αI' helix was qualitatively examined. Two residue (C148, C162) spin-labeled by MTSL (Figure 11).
The binding thermodynamics reveal a higher affinity for the IAA17-ARF5 (activator) heterodimer than for individual homodimers. The binding thermodynamics reveal a higher affinity for the ARF1-ARF1 (repressor) homodimer than for heterodimers. Based on structural and thermodynamic analyses, I propose a working model for transcriptional control that Aux/IAA17 with ARF5 (activator) and ARF1 (repressor) selective interaction during the auxin response.
5
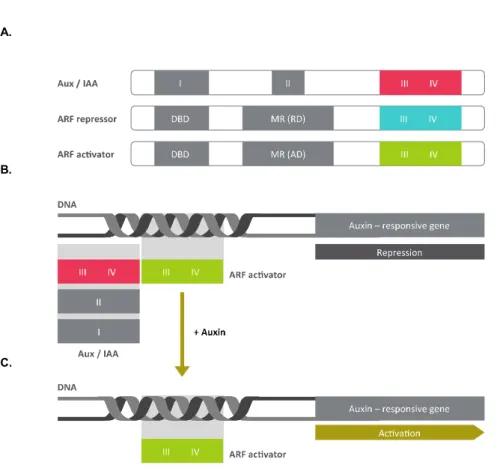
Figure 1.
Model of auxin signal transduction.
(A) Schematic representation of Auxin Response Factors (ARFs) and Aux/IAA
structures. The ARF composed four domains: DNA binding domain (DBD), middle region (MR), and III/IV (protein dimerization domain) are colored by green and blue. The Aux/IAA sequence motifs domain I (TOPLESS interaction), domain II (degron), and domain III/IV (protein dimerization domain) are colored by red. Activation or repression of auxin response transcription depends on ARF middle domain amino-acid composition.
(B) In low auxin concentrations, Aux/IAA proteins are dimerised with ARF
proteins, thereby repressing their action.
(C) In high local concentrations, TIR1/AFB perceives auxin. Aux/IAA repressors are degraded via the 26S proteasome and ARF-mediated gene expression.
A.
B.
6
Materials and Methods
1. Sample preparation. i)
Cloning & mutation
IAA17III-IV (G109-L217), ARF5III-IV (T789-G885) and ARF1III-IV
(S538-N634) were cloned into a pET28a vector (Merck Millipore) with an N-terminal His6 tag. Mutations were introduced to generate monomeric proteins:
K114M for IAA17M1, D183N/D187N for IAA17M2, K797M for ARF5M1, and
D847N/D851N for ARF5M2, K541A for ARF1M1, D591N/D595N for ARF1M2
andK541A D591N/D595N for ARF1M3. IAA17M2 was used for structure
calculation and dynamics using MMR spectroscopy. ARF5M2 and ARF1M3
were used for backbone assign and dynamics using MMR spectroscopy. Cystein mutations were introduced to generate for spin labeling for IAA17 M2:
Phe148Cys (IAA17M2 F148C) and Phe162Cys (IAA17M2 F162C) mutations were
introduced into the D183N/D187N construct (the construct that produced a monomeric protein) for Aux/IAA17. Cysteine residues were further mutated into alanine or serine residues for calorimetry to avoid the use of reducing agents. The cysteine position is the C203A mutation was introduced into IAA17III-IV, and C825S/C866S/C869S into ARF5III-IV and
C539S/C560S/C608S into ARF1III-IV. Site-directed mutagenesis was
performed using the QuikChange Kit (Agilent Technology, Inc.), and the new constructs were verified by DNA sequencing.
7
ii) Overexpression & purification
The plasmids were introduced into Escherichia coli strain BL21-CodonPlus(DE3)-RIL (Agilent Technology, Inc.) for expression. Transformed cells were grown in Luria Bertani or minimal media (with 15NH
4Cl and/or 13C
6-glucose as the sole nitrogen or carbon sources, respectively). Protein
expression was induced by 1 mM isopropyl-D-thiogalactopyranoside at an
A600 of 0.6~0.8, and the cells were harvested by centrifugation after 5 h of induction. The pellet were resuspended in 50 mL (per liter of culture) of 20 mM Tris, pH 7.4, 200 mM NaCl, 2 mM b-mercaptoethanol, 1 mM phenylmethylsulfonyl fluoride, lysed using Emulsiflex C3 (Avestin, Canada), and centrifuged at 25,000 ´ g for 20 min. The supernatant fraction was loaded onto a HisTrap HP column (GE Healthcare), and the fusion protein was eluted with a 100-ml gradient of imidazole (15-500 mM). Fractions containing the protein were identified by SDS-polyacrylamide gel electrophoresis. The fusion protein was then dialyzed against 20 mM Tris, pH 8.0, 100 mM NaCl, and 2 mM b-mercaptoethanol, and the His6 tag was cleaved by TEV protease.
The digestion reaction was loaded onto the HisTrap column. The protein was further purified by size exclusion chromatography using a HiLoad Superdex 75 column (GE Healthcare) and then by anion exchange chromatography using a monoQ column (GE Healthcare). All protein samples were finally dialyzed against 10 mM sodium phosphate, pH 7.4, and 4 mM EDTA.
8
2. NMR spectroscopy.
NMR spectra were recorded at 25°C on Bruker 600, 700, 800, 900 MHz spectrometers equipped with a z-shielded gradient triple resonance probe. The NMR sample contained 1 mM 13C,15N-IAA17
M2, 0.7mM 13C,15N-ARF5M2,
0.7mM 13C,15N-ARF1
M3 in 10 mM sodium phosphate, pH 7.4, and 4 mM
EDTA . Sequential and side chain assignments of 1H, 15N, and 13C resonances
was achieved by three-dimensional triple resonance through-bond scalar correlation experiments (CBCACONH, HNCACB, HBHA(CO)NH, HNCO, HN(CA)CO, HCCH-TOCSY, and 15N-TOCSY-HSQC). Three-dimensional 13C-separated NOESY and 15N-separated NOESY experiments were obtained
using the mixing time of 120 ms. Residual 1D
NH dipolar couplings were
obtained by taking the difference in the J splitting values measured in oriented (6.5% neutral gel alignment medium) and isotropic (water) media using 2D in-phase/antiphase 1H-15N HSQC spectrum (33). 15N-R
1 and 15N-R2 relaxation,
and 1H-15N heteronuclear NOE measurements were carried out using pulse
schemes described previously (34). Delays of 10, 20, 50, 100, 400, 800, 1200, 1500 ms were used for the R1 relaxation measurement, and 17.0, 33.9, 50.9,
67.8, 101.8, 118.7, 152.6, 203.5 ms were used for the R2 relaxation
measurement. NMR spectra were processed using the NMRPipe program (35), and analyzed using PIPP (36) and NMRView (37) programs. NMR titration experiments were recorded at 25°C on a Bruker 600 MHz spectrometer.
1H-15N HSQC spectra were recorded with 0.2 mM 15N-IAA
M1 or 15N-IAAM2
titrating stoichiometrically with the partner proteins, and changes in the backbone amide chemical shifts were measured.
9
3. MTSL nitroxyl radical labeling
For PRE measurements, Cysteine mutation of the spin-label, MTSL, was conjugated to the Aux/IAA mutants (IAA17M2 F148C, IAA17M2 F162C) via a
disulfide bond with the cysteine residue (39). The cysteine variants were first reduced with 10mM DTT, which was removed using HiPrep desalting columns. After DTT removal the protein solution was incubated overnight with a 10-fold molar excess of MTSL. After conjugation MTSL, unreacted MTSL was removed by passing the monoQ column.
For the intra-molecular PRE measurements, NMR experiments were recorded with 15N-labeled samples containing 10 mM sodium phosphate, pH 7.4, and 4
mM EDTA buffer at 25°C in 10% D2O, except diamagnetic sample. For diamagnetic sample contained same buffer with reducing agent (5mM DTT). Contributions of the PRE effect to the relaxation rates are measure by detecting line broadening on the 2D-HSQC. We used NMR measurements performed on Bruker Avance, and 900MHz. Spectra were processed using NMRPipe and analyzed using the program NMRView (38).
4. Structure calculation.
Interproton distance restraints were derived from the NOE spectra and classified into distance ranges according to the peak intensity. f/y torsion angle restraints were derived from backbone chemical shifts using the program TALOS+ (41). Structures were calculated by simulated annealing in torsion angle space using the Xplor-NIH program (40). The target function for simulated annealing included a covalent geometry, a quadratic van der Waals repulsion potential (42), square-well potentials for interproton distance and torsion angle restraints (43), hydrogen bonding, RDC restraints (44), harmonic potentials for 13Ca/13Cb chemical shift restraints (45), a
multidimensional torsion angle database potential of mean force (46), and a radius of gyration term (47). The radius of gyration represented a weak
10
overall packing potential, and structures were displayed using the VMD-XPLOR software (48).
5. Isothermal titration calorimetry.
ITC was performed at 25°C using an iTC200 calorimeter (GE Healthcare). 0.1mM of IAA17M1, ARF5M1 or ARF1M1 was placed in the cell and titrated
with 1mM IAA17M2, ARF5M2 orARF1M2. Twenty consecutive 2 μL aliquots
of protein were titrated into the cell. The duration of each injection was 4 s, and injections were made at intervals of 150 s or 180s. The heats associated with the dilution of the substrates were subtracted from the measured heats of binding. ITC titration data were analyzed with the Origin version 7.0 program provided with the instrument.
11
Results
Part I. Structure of Aux/IAA17 domain III-IV
Domain design of IAA17, ARF5, and ARF1
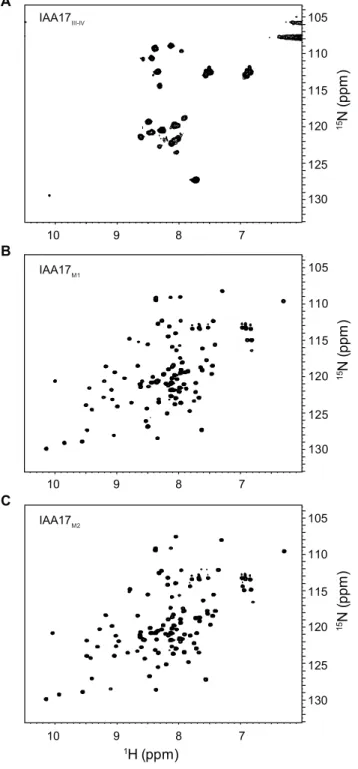
Domain III-IV of wild-type IAA17 (IAA17III-IV) has oligomerization
pattern in a concentration-dependent manner (Figure 2 A.). Wild type of IAA17III-IV made a small set of broad signals owing to the large size and
chemical exchanges arising from oligomerization in 1H-15N HSQC spectrums
(Figure 5 A.). I selected highly conserved residues (Lys114 on basic surface and Asp183 and Asp187 on the acidic surface) for charge-neutralizing mutations, based on the sequence homology between IAA17III-IV and PB1
domains. A K114M mutation (IAA17M1) or D183N/D187N mutation
(IAA17M2) resulted in an exclusively monomeric protein manner (Figure 2 B.).
HSQC spectra of monomeric IAA17M1 and IAA17M2 showed well-dispersed
signals, which are typically observed in folded proteins (Figure 5 B. C.). The mutations of ARF5 that prevented the oligomerization of IAA17III-IV
produced a monomeric state similarly. A single mutant, K797A (ARF5M1),
and a double mutant, D847N/D851N (ARF5M2), produced monomeric
proteins (Figure 2 C.). Based on the sequence homology between ARF1 domain III IV and ARF5, I mutated K546M in basic interface and D596N, D600N in acidic interface. Each protein is elution in monomeric protein based on size exclusion chromatography. According to the structure of ARF5 PB domain (4chk), the electrostatic interaction is the key interaction in auto-assembly but hydrogen bonding and hydrophobic contacts also contribute in
12
self-oligomerization(49). The binding interface are present in all ARF activator and most Aux/IAA and several residues are also conserved in ARF repressor (Figure 3, Figure 21).
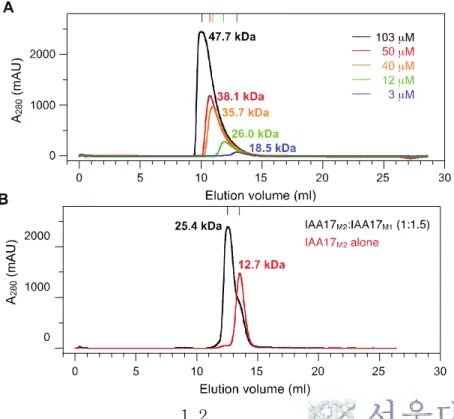
Figure 2. Size exclusion chromatograms
(A) Wild-type IAA17III-IV at variety concentrations. The injection
concentrations of IAA17III-IV were 400 μM, 200 μM, 150 μM, 50 μM, and 10 μM. The elution concentration measured by the peak height (103 μM, 50 μM, 40 μM, 12 μM, and 3 μM).
(B) IAA17M2 (red),which exist as monomeric protein in solution. Mixing
IAA17M1 and IAA17M2, results in the formation of a dimer (mixed in a 1: 1.5
ratio, (black)).
(C) ARF5M1 (blue), ARF5M2 (red), and the complex between ARF5M1 and
13
Figure 3.
Multiple sequence alignment of IAA and ARF family (A.
thaliana) using ClustalW.
In the sequence alignment, highly conservedLys114 at the positive surface, and Asp183 and Asp187 at the negative surface are shaded in orange and blue. Sequences of ARF3, ARF13, and ARF17 are less conserved and not included in the alignment.
14
1 1 0 1 2 0 1 3 0 1 4 0 1 5 0 1 6 0 1 7 0 1 8 0 1 9 0 2 0 0 2 1 0 2 2 015
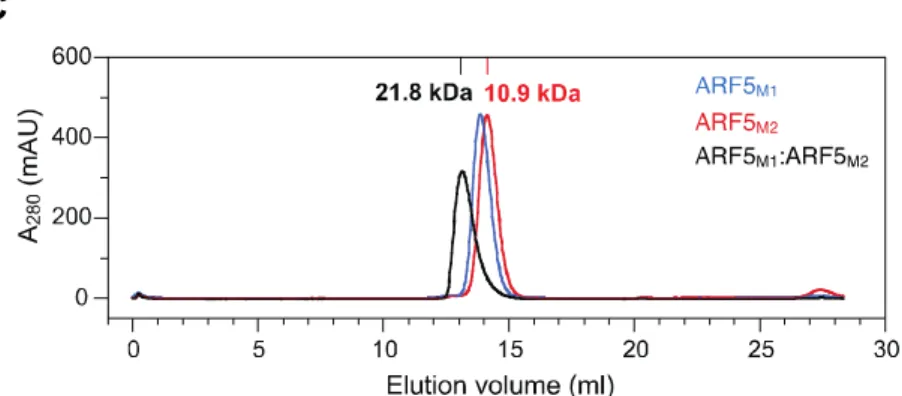
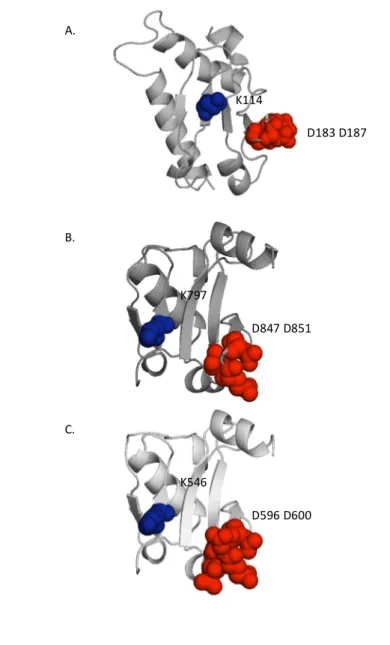
Figure 4.
Structure of Aux/IAA17 DIII-IV, ARF5 DIII-IV, and
ARF1 DIII-IV monomers
Conserved basic and acidic residues of the canonical type I/II PB1 features are presented as blue and red spheres. (A) Aux/IAA17 DIII-IV (2MUK) (B) ARF5 DIII-IV (4CHK) (C) SWISS-model- based data-driven model of ARF1 DIII-IV monomer. A. B. C. K114 D183 D187 K797 D847 D851 K546 D596 D600
16
Figure 5.1
H-
15N HSQC spectra of (A) wild-type
15N -IAA17III-IV, (B)
15
N -IAA17
M1
, and (C)
15N - IAA17
M2in 10 mM sodium phosphate, pH
7.4, at 25℃. Protein concentration was 0.3 mM for each sample.
B C A IAA17III-IV IAA17M1 IAA17M2 1H (ppm) 1 5N ( pp m ) 7 8 9 10 7 8 9 10 7 8 9 10 105 110 115 120 125 130 1 5N ( pp m ) 105 110 115 120 125 130 15N ( pp m ) 105 110 115 120 125 130
17
Structure and dynamics of IAA17
III-IVStructure was determined the solution structure of the 13C-15N
isotope-labeled IAA17M2, which comprise amino acid residues 106-217
(Domain III-IV) and D183N, D187N (for monomeric state), by using NMR spectroscopy. Standard 3D NMR spectra [HNCACO, HNCACB, HNCO, HN(CO)CACB, CBCACONH] were analyzed for the assignment of backbone of IAA17M2 (Figure 6). Backbone and side chain assignments were obtained
using heteronuclear correlation spectroscopy of three-dimensional. Three-dimensional 13C-separated NOE and 15N-separated NOE restraints were used
for the structure calculation using the Xplor-NIH program (40). Residual dipolar couplings (RDCs) of IAA17M2 were measured in 6.5% neutral gel
alignment medium. The structure was determined by using 2,141 NMR restraints including 1,858 experimental NOE restraints, 183 dihedral angle restraints, 51 backbone 1D
NH RDC restraints, and 49 hydrogen bonding
restraints. Experimental constraints and structure statistics of IAA17M2 are summarized inTable 1.
The 20 lowest-energy refined structures of IAA17M2 (out of 100
structures) are well defined and converges with a backbone (Figure 7 A). A ribbon diagram of the lowest energy structure is shown in Figure 7 B and The main residue of charge-charge interactions, K114 is colored by orange, D183 D187 are colored by blue. IAA17M2 is comprised of five b strands and four a
helices, which adopts a canonical PB1-like b-grasp fold with slight modifications. The backbone structures of IAA17M2 atoms ensemble the final
18
well ordered except for the a1' and a3 helices (Figure 7 A B). The N-terminal domain III region forms an antiparallel b sheet (b1-b2) and a1. Domain IV region consists of a b3-b4-a2-b5-a3 fold as an antiparallel b sheet. b1 of domain III and b5 of domain IV form a parallel b sheet, joining the two domains into a compact b-grasp fold (Figure 7 B). The conserved residues Asp183 and Asp187 are located on the loops flanking b4. The position of the other conserved lysine (K114) is on the surface-exposed face of b1 (Figure 7 B). The overall structural architecture of IAA17M2 is similar to the domain
III-IV of ARF5 (ARF5III-IV), ARF7 (ARF7III-IV), and pIAA4 (IAA4 III-IV)
except for the a1' helix in IAA17M2 (Figure 7 C–D)(25-27).
Long insert sequence is contained half of the IAA family protein in
Arabidopsis thaliana, which varies in lengths and amino acid compositions.
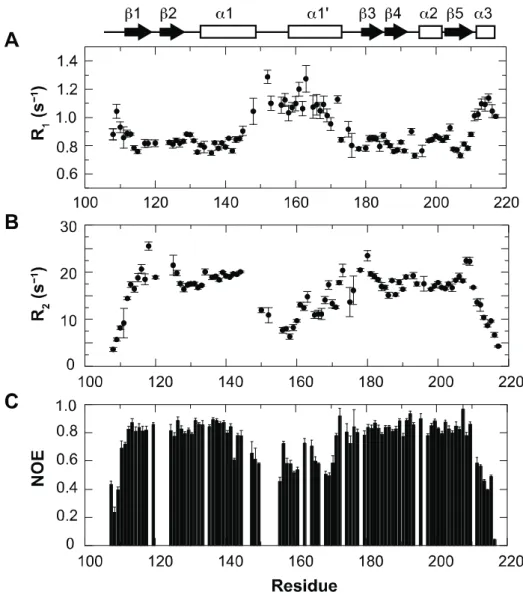
None of the ARF family protein carries this a1' helix (insert sequence) (Figure 10, Figure 3). Particularly, IAA17 contains the longest insert sequence with more than 15 extra residues in IAA family. Based on 15N relaxation data
from the backbone amide groups, most of the a1' helix manifested fast motions in the picosecond to nanosecond time scale. 1H-15N heteronuclear
NOE data also reduced, and it indicates that the the a1' helix and its preceding loop were highly mobile (Figure 9).
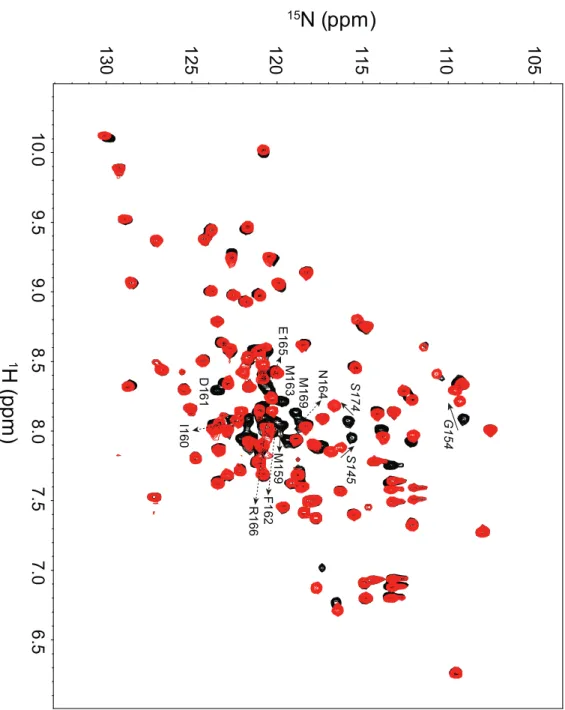
To figure out how dynamic a1' helix affects to the folding of IAA, I mutated IAA17M2 (D159-169) that removed the a1' helix. The backbone
amide chemical shifts mostly located same position, when the HSQC spectra were compared between IAA17M2 and IAA17M2 (D159-169), except for the
19
missing residues from the a1' helix (Figure 8). This result represents that IAA17III-IV adopts the same b-grasp scaffold without the insert helix.
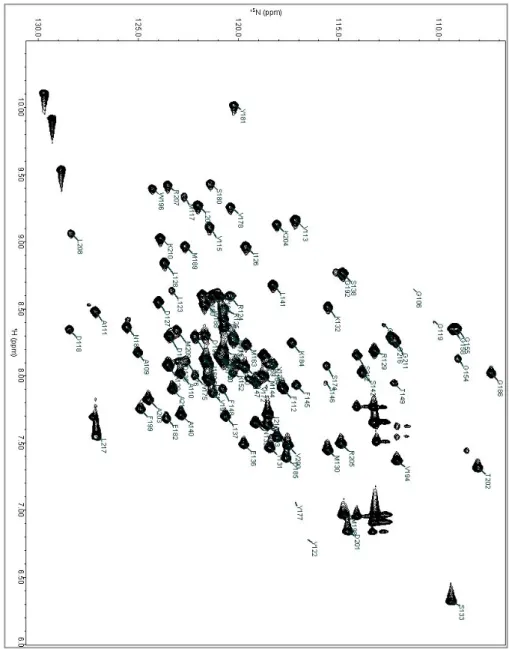
Figure 6. Backbone assignment of Aux/IAA17 Domain III-IV
The 1 H-15N HSQC spectrum of Aux/IAA17 domain III-IV was measured at 600 MHz,
in 10 mM sodium phosphate, pH 7.4, at 25℃. Each cross-peak corresponding to the backbone chemical shift information of an individual amino acid residue is labeled by the one-letter code of amino acids followed by residue number.
20
Table 1. Restraints and structural statistics of IAA17
M2Experimental restraints
<SA>*
Non redundant NOEs
1858
Dihedral angles, f / y / c
84 / 84 / 15
Hydrogen bonds
49
Residual dipolar coupling,
1D
NH51
Total number of restraints
2141 (19.3 per residue)
rms
deviation
from
experimental
restraints
Distances (Å) (1858)
0.053 ± 0.002
Torsion angles (°) (183)
0.87 ± 0.07
Residual dipolar coupling R-factor (%)
†1
D
NH
(%) (51)
2.9 ± 0.5
rms deviation from idealized covalent
geometry
Bonds (Å)
0.004 ± 0
Angles (°)
0.50 ± 0.03
Impropers (°)
0.51 ± 0.02
Coordinate precision (Å)*
‡Backbone
0.48 ± 0.08
Heavy atoms
0.98 ± 0.17
Ramachandran statistics (%)
‡§Most favorable regions
91.5 ± 1.0
Allowed regions
8.5 ± 1.0
* For ensemble of the final 20 simulated annealing structures
† The magnitudes of axial and rhombic components of the alignment tensor were
-11.5 Hz and 0.55, respectively.
‡ Residues 112-217, excluding residues 150-178 with internal motions § Calculated using the program PROCHECK (34)
21
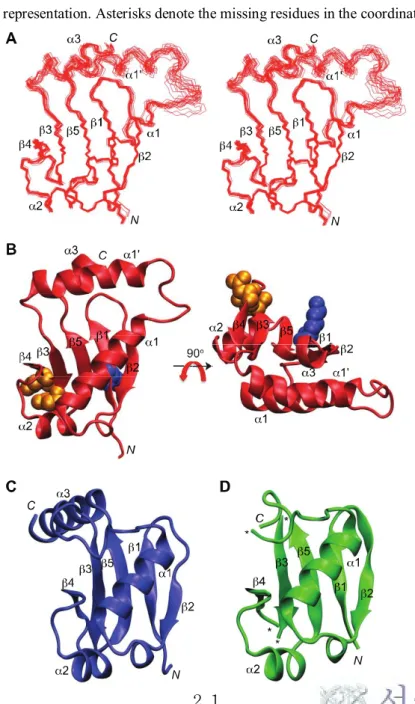
Figure 7.
Structures of domain III-IV of IAA17, ARF5, and ARF7.
(A) Superposition of the backbone atoms of the final 20 simulated annealing
structures of IAA17M2.
(B) Front (left) and top views (right) of the solution structure of IAA17M2 as a
ribbon diagram representation. The conserved residues Lys114 (blue), Asp183 and Asp187 (orange) are shown as a space-filling representation.
(C) Crystal structure of ARF5IIIIV (PDB ID: 4CHK (25))
(D) Crystal structure of ARF7IIIIV (PDB ID: 4NJ7 (26)) as a ribbon diagram
22
Figure 8. 1
H-
15N HSQC of IAA17
M2
and IAA17
M2(Del 159-169)
Superimposed 1H-15N HSQC spectra of 15N-IAA17
M2 (black) and 15N-IAA17M2 (Del
159-169) (red) in 10 mM sodium phosphate, pH 7.4, at 25℃. The missing amide resonances in 15N-IAA17
M2 (Del 159-169)due to the truncation of the α1’ helix are
annotated with residue names and numbers. Amide resonances with chemical shift changes are also annotated, in italics.
1
H
(p
p
m
)
7. 5 7. 0 6 .5 8 .0 8 .5 9. 0 9 .5 1 0. 0 15N (ppm)
1 05 1 10 1 15 1 20 1 25 1 30 M 1 6 9 N 1 6 4 S17 4 S 1 4 5 G 1 5 4 M 1 5 9 I1 6 0 M 1 6 3 D 1 6 1 R 1 6 6 F 1 6 2 E 1 6 523
Figure 9.
Plots of relaxation parameters of backbone amide groups
of IAA17
M2.
(A) 15N R1relaxation, (B) 15N R2relaxation, and (C) 1H-15Nheteronuclear NOE data as a function of residue number. The secondary structures of IAA17M2 are shown on top in a schematic representation.
24
Dynamics of the mobile insert helix in the domain III−IV of Aux/IAA17 probed by site-directed spin labeling and paramagnetic
15N R
2 relaxation rates 1H−15N heteronuclear NOE measurements
show that a1’ helix has fast motion in the picosecond to nanosecond time scale. To investigate amplitude of a1’ helix motion, I employed site-directed spin-labeling and the paramagnetic relaxation enhancements (PRE). Based on the fact that PRE by the nitroxide spin label can be observed at distances up to 27Å, the motion of the α1' helix was qualitatively examine. The position of spin-labeled is shown in Figure 11.
The Spin label MTSL [1-oxy-2,2,5,5-tetramethyl- pyrroline-3-methyl]-methane-thiosulfonate] was conjugated by surface-engineered cysteine residues in the IAA17M2F148C and IAA17M2F162C (Figure 11).
Based on the three-dimensional solution structure, I designed two single-cysteine mutants for the introduction of the nitroxide spin label MTSL. The position of cysteine mutation was in the αI helix (F148C) and in the α1' helix (F162C) as shown in Figure 11.
The paramagnetic line broadening is measured for to get the motion of the α1' helix in the Aux/IAA17 domain III−IV. As the relaxation rate of the nuclear magnetization, the signal intensity of the affected nuclei reduces. The line width of a proton and nitrogen signal would be significantly perturbed when the proton and nitrogen are within 27.0 Å of the paramagnetic MTSL. They are fully suppressed when the distance is less than 10.5 Å due to its fast transverse relaxation rate (49).
25
I have studied the paramagnetic line broadening of each sample (148C, 162C) by using 2D 1H-15N heteronuclear single quantum correlation
(HSQC) spectra of each Aux/IAA17 mutants, which were prepared spin-labeling MTSL and unspin-spin-labeling sample. The differential line broadening originates in the PRE, and the results show that the intensity of amide across peak 1H-15N HSQC spectrum. Because, changes in HSQC cross-peak
intensities of the spin-labeled Aux/IAA mutants (I) and comparison to unspin-labeled Aux/IAA mutants (I0) were plotted in a bar graph, as shown in Figure
12. The bar graph indicates that the most of the residues decrease in cross-peak intensity, because the total Aux/IAA mutant size are in 20.0 Å (I/ I0<0.6).
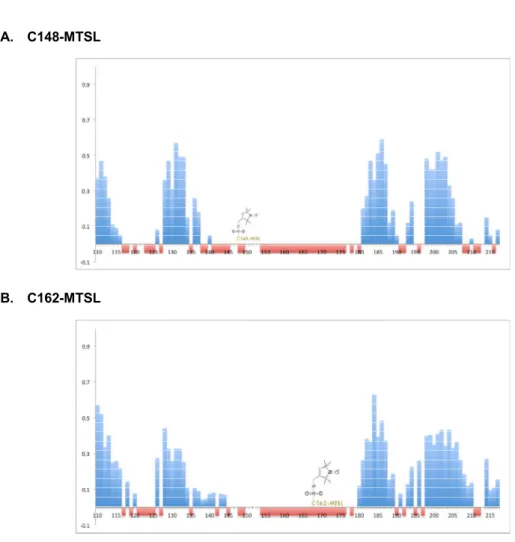
Our result shows that similar patterns of line broadening in Figure 12. Complete suppression or low intensity cross-peaks are observed in each spin-label position. These cross-peaks intensity data indicate the three-dimensional distance information that is presented on 3D structure (Figure 13). As expected from the structure, 148C-MTSL result shows that suppression peaks and low intensity cross-peaks (0.3 <I/Io) are evenly distributed on α1’ (Figure 12 A). The 162C-MTSL result also shows similar result in α1’ (Figure 12 B). the α1’ helix is dynamic in fast time scale motion but the amplitude of motion is not likely large (Figure 13).
Figure 10.
Multiple sequence aliment of Aux/IAA in Arabidopsis
The Arabidopsis thaliana encodes 29 Aux/IAA proteins that contain
carboxyl-terminal domain. These carboxyl-carboxyl-terminal domain conserved Lys (red) for acid face and Asp (blue) for basic face. The structure of Aux/IAA17 is similar that domain III-IV of ARF5, ARF7 and PsIAA4, except for the insert αI' helix between the domains III and IV. (Red box)
27
Figure 11.
Spin label residue on Aux/IAA17 structure
(A) Front views of the solution structure of Aux/IAA17. The point mutation residues
28
Figure 12. Paramagnetic effect from F148C-MTSL and F162C-MTSL.
PRE data of Aux/IAA17 Domain III_IV.
Two Cys-substituted and spin-labeled variants of Aux/IAA DIII_IV, F148C-MTSL, F162C-MTSL were analyze via the intensity ratio of the H, N cross-peaks determined. Blank spaces in the diagrams are either due to proline (4 residues) or the inability to measure the peak height as a consequence of overlapping or non-assigned residues. Fully suppression signal of residues are highlighted in red bar on the graph.
Intensity ratio (I/Io) =Intensity of spin labeling Aux/IAA17 Muts / Intensity of Aux/IAA17 Muts
Change in peak intensities for residues in Aux/IAA17 upon addition of MTSL, measured as a ratio of the intensities of peak in the spin-label state over their corresponding intensities in the unlabeled state.
A. The spin-labeled side chain Aux/IAA17 (F148C). B. The spin-labeled side chain Aux/IAA17 (F162C).
A. C148-MTSL
29
Figure 13.
Backbone amides with paramagnetic effects in the
three-dimensional structure.
A. F148C-MTSL (alpha1) spin labeling B. F162C-MTSL (alpha1’) spin labeling
Results are shown on the ribbon diagram and surface of the previously determined NMR structure of Aux/IAA17 domain III_IV. The position of the spin-label residue is shown in orange and marked by a label. Amides that are broadened to undetectable levels are shown in red and light gray. Amides that are broadened with measurable intensity ratios > 0.3 are shown in dark gray. White colored residues are either overlapped in 15N−HSQC spectra, not assigned.
30
Part II. Interaction of Aux/IAA 17 domain III-IV
and ARF5 domain III-IV
Interaction between IAA and ARF proteins
Mapping the binding interface of the IAA17 DIII/IV homodimer
and heterodimer
In order to compare binding interface of the homodimer and heterodimer, I took advantage of NMR titration method. 15N-labeled IAA17
M1
used similar binding interface in the case of IAA17M2 and ARF5M2. The
results showed large chemical shift perturbations are mainly in the b3-b4-a2 region (Figure 14 A, Figure 15 A). The CSP of 15N-labeled IAA17
M2 also
showed similar results. The results showed large chemical shift perturbations are mostly in the b2-b1-b5 region that contained K114, when 15N-labeled
IAA17M2 titrated with IAA17M1 or ARF5M (Figure 14 B, Figure 14 C). These
similar chemical shift perturbation profiles indicate that IAA17 employed similar binding interface for the homodimer formation and for the heterodimer formation.
In previous study, ARF5III-IV and ARF7III-IV contain an oligomer extended in
a front-to-back homo-multimerization (25,26). The binding interface of the ARF5 DIII-IV oligomer could be mapped on to IAA17III-IV based on
sequence alignment, and the interfacial residues overlapped with the residues that exhibited large chemical shift perturbations. This suggests that the homo-oligomer of IAA17III-IV and the hetero-oligomer between IAA17III-IV and
31
ARF5III-IV, adopt a similar structural arrangement in the crystal structure
(ARF5 : 4CHK).
The binding affinity of IAA17DIII/IV homodimer and heterodimer
To understand the interaction with Aux/IAA and ARF5 (activator) through domain III-IV (PB domain), I measured the binding affinities of the mutant for the homodimer (IAA17: IAA17, ARF5: ARF5) and the heterodimer (IAA17: ARF5) formation by calorimetry and the KD value was
obtained as 6.6 μM, 0.87 μM, and 75 nM (Figure 16). There are two different ways in case of heterodimer, which protein employs the positive interface for the complex formation. During the titration experiment of heterodimer, it was carried out in both directions. The KD value was 0.87 mM in case of the ARF5
homodimer formation, 8-fold stronger than that of the IAA17 homodimer (Figure 16 B, and Table 2). Respectively, the binding affinity for heterodimer was stronger than both homodimers. The KD values were measured as 75 nM
and 71 nM for IAA17M1:ARF5M2 and ARF5M1:IAA17M2 complexes. (Figure
12 C–D, and Table 2). As a result, the binding affinity of the homodimer was 90 times strong than the IAA17 homodimer, and 12 times stronger than the ARF5 homodimer.
Based on the binding affinity of IAA17 mutants, I examined the interaction of Wild-type IAA17 for the homodimer (wild-type IAA17: IAA17M1) and
(wild-type IAA17: IAA17M1) (Figure 18). The KD values revealed in 5.9 ± 1.7 μM
32
mutations introduced into IAA17M1 or IAA17M2 little altered the binding of
the interaction surface. I examined the binding between wild-type IAA17III-IV and the mutants at varying concentrations of IAA17III-IAA17III-IV.
To determine character of the a1' helix, I also measured the mutant (IAAM2Del159-169) for the homodimer (IAA17: IAA17) and the heterodimer
(IAA17: ARF5) formation (Figure 17). The binding affinities for the dimerization are little changed regardless of the absence of the a1' helix by using an ITC (Figure 17, Table 2). Taken together, our results suggest that the insert of a1' helix is not critical for the proper folding of IAA17III-IV, and for
the formation of homo- or heterodimers with ARF5.
Figure 14.
Homodimer interface of Aux/IAA17 domain III-IV
Weighted average
1H
N/
15N chemical shift perturbation (CSP=([(
HN)
2+
(
N)
2/25]/2)
1/2) as a function of residue number upon homodimer
formation. Residues with > 0.08 are shown in yellow with the
conserved Lys114 in blue, and Asp183 and Asp187 in orange as a
space-filling representation. (A)
15N-IAA17
M1and IAA17
M2(B)
1533
34
Figure 15.
Heterodimer interface of Aux/IAA17 domain III-IV
Weighted average
1H
N/
15N chemical shift perturbation (CSP= ([(
HN)
2+
(
N)
2/25]/2)
1/2) as a function of residue number upon heterodimer
formation between IAA17
IIIIV, and ARF5
IIIIV. Residues with > 0.08
are shown in yellow with the conserved Lys114 in blue, and Asp183
and Asp187 in orange as a space-filling representation.
35
Figure 16.
K
Dof the homodimer and heterodimer formation of
IAA17
IIIIVand ARF5
IIIIV.
Integrated heats of injection (solid squares) and the least squares fit
curves (black line), derived from a simple one-site binding model for
the titration between
(A) IAA17
M1and IAA17
M2(B) ARF5
M1and ARF5
M2(C) IAA17
M1and
36
Table 2.
Thermodynamic parameters for the homodimer and heterodimer formation between of IAA17 domains III-IV and ARF5 domains III-IV obtained by isothermal titration calorimetry at 25°C.
Description KD (μM) DG (kcal/mol) DH (kcal/mol) -TDS (kcal/mol) IAA17M1 + IAA17M2 6.6 ± 0.3 -7.1 ± 0.0 -9.7 ± 0.1 2.6 ± 0.1
ARF5M1 + ARF5M2 0.87 ± 0.07 -8.3 ± 0.0 -11.1 ± 0.1 2.8 ± 0.1
IAA17M1 + ARF5M2 0.075 ± 0.03 -9.7 ± 0.2 -9.3 ± 0.1 -0.4 ± 0.2
37
Figure 17
.
K
Dof the homodimer and heterodimer formation of
IAA17
M2(Del159-169)
Raw ITC data (top panels) and integrated heats of injection (bottom panels) for the titration between (A) IAA17M1 and IAA17M2(Del159-169) (B) ARF5M1 and
IAA17M2(Del159-169). In the bottom panels, squares are the experimental data, and
solid lines represent the least-squares best fit curves derived from a simple one-site binding model. B Time (min) 0 10 20 30 40 50 60 Time (min) 0 10 20 30 40 50 60 mc a l/s ec −0.6 −0.4 −1.0 −0.8 −0.2 0 mc a l/s ec−0.6 −0.4 −1.0 −1.2 −1.4 −1.6 −0.8 −0.2 0 kc al m ol − 1 o f in je ct an t −6.0 −4.0 −2.0 0 kc a l m o l − 1 o f i n je ct a n t −6.0 −8.0 −4.0 −2.0 0 KD = 5.5 ± 0.3 mM KD = 64 ± 8.6 nM 0 0.5 1.0 1.5 2.0 2.5 [IAA17M2(D159−169)]/[IAA17M1] 0 0.5 1.0 1.5 2.0 2.5 [IAA17M2(D159−169)]/[ARF5M1] A IAA17M1 IAA17M2 (D159−169) (D159−169)IAA17M2 + − ARF5M1 + −
38
A B
Figure 18.
K
Dof the homodimer and heterodimer formation of
wild-type IAA17 domain III-IV
Raw ITC data (top panels) and integrated heats of injection (bottom panels) for the titration between (A) IAA17M1 and wild-typeIAA17 (B) wild-type IAA17and
IAA17M2. In the bottom panels, squares are the experimental data, and solid lines
represent the least-squares best fit curves derived from a simple one-site binding model.
39
Part III. Interaction of Aux/IAA 17 domain III-IV
and ARF1 domain III-IV
Structure PB domain of ARF1
To understand the interaction of ARF1 and Aux/IAA17, ARF1DIII-IV was modeled with homology in silica using the SWISS-MODEL automated protein structure homology modeling server (http://swissmodel.expasy.org) (Figure 22 C D, Figure 23 C D). I set out to solve the solution structure of the ARF1 domain III-IV using RDCs data that was employed for ARF5 domain III-IV(4CHK). The present structure of ARF5 domain III-IV agrees RDCs measured on the ARF1 domain III-IV with an RDC R-factors of 18% (Figure 23). This result indicated that the backbone structure of ARF1 domain III-IV is similar to the ARF5 domain III-IV. Analysis of the homodimer interface using PDBePISA (50) (http://pdbe.org/pisa) suggests a total of 28 amino acids contacts across interaction interface of ARF5DIII/IV. The residue is involved in the acidic interface that are highlighted by blue circle, and basic interface that are highlighted by red circle (Figure 21). Understanding structural different of ARF1 and ARF5, I examined the detail of the electrostatic potential and hydrophobic contacts of interaction surface between ARF5 DIII/IV and ARF1 DIII/IV (Figure 22). Both ARF5 DIII/IV and ARF1 DIII/IV are exhibited similar location of positive and negative surface at the interfaces, and hydrophobic region also are located in the same location. However, the size of hydrophobic region is different. Based on the ARF1DIII-IV structure modeling data and crystal structure of ARF5DIII-ARF1DIII-IV, the size of
40
hydrophobic pocket at negative interface of ARF5 is smaller than ARF1 (Figure 23 B and D). In addition, the loop size at positive interface of ARF5 is also smaller than ARF1 (Fig 23 A and C).
Figure 19.
Multiple Sequence alignment of DIII/IV of ARF1, ARF5, ARF7, and IAA17
The residues of homodimeric interface of ARF5 DIII/IV (X-ray structure) are indicated in blue (positive interface) and red cycle (negative interface). Purple boxes indicated non-conserved residue of the interface.
42
Figure 20. Binding interface of ARF5 and ARF1.
(A)(B) ARF5 structure, (C)(D) ARF1 model. Residues involved interface are marked as color. Positive residue is blue. Negative residue is red. Polar residue is green. Hydrophobic residue is orange. Charged residue are located in similar position on the surface.
B. ARF5 negative interface A. ARF5 positive interface
D. ARF1 negative interface C. ARF1 positive interface
43
Figure 21. Positive and negative interface of ARF5 and ARF1
Negative and positive interface of ARF (A) ARF5 negative interface from structure. (B) ARF5 positive interface from structure. (C) ARF1 negative interface from model. (D) ARF1 positive interface from model. Positively charged residues represented in blue, negatively charged residues represented in red, Polar residues represented in green, and hydrophobic residues represented in white. The orientation for the negative and positive surface are shown with a rotation of 90 ° -90 ° in Figure 20.
A B
44
Figure 22. Correlation plots between experimental and back-calculated RDCs for the ARF1 structure (blue dots)
45
Interaction between ARF repressor and ARF activator and Aux/IAA
I showed that the interaction between ARF5 activator and Aux/IAA17 (KD : 0.07mM) is stronger than homotypic ARF5 (KD : 0.87mM)
and homotypic Aux/IAA17 (KD : 6.6mM ) in chapter 2. Other studies shown
similar binding affinity homodimer of Ps-IAA4 (KD : 6.4mM) and ARF7 (KD :
0.18mM ) (27, 51). The mutations that prevented the oligomerization of ARF1III-IV similarly produced a monomeric form of ARF5III-IV and
Aux/IAA17 III-IV . A single mutant, K797A (ARF5M1), K114M (IAA17M1) and
a double mutant, D847N/D851N (ARF5M2), D183N/D186N (IAA17M2),
produced monomeric proteins as the same mutation in IAA17. Using ITC, we measured the binding affinity of the between ARF1M1 and ARF1M2
homodimer. I also measured that of the heterodimer between ARF1M1 and
IAA17M2, in addition to ARF1M1 and ARF1M5. The affinity for the homodimer
was stronger than both heterodimers, with the KD values measured as 0.24 mM
for ARF1M1: ARF1M2 complexes (Figs. 23 A, Table 3). Thus, the affinity of
the homodimer was about 10 times higher than that of the ARF1M1: IAA17M2
(KD : 2.9mM) heterodimer, and ARF1M1: ARF5M2 (KD : 2.3mM) heterodimer.
The heterodimer can bind using two different interfaces (ARF1M1: IAA17M2
and IAA17M1: ARF1M2, ARF1M1: ARF5M2 and ARF5M1: ARF1M2) depending
on which protein employs the positive interface for the complex formation. I measured the binding affinity of the heterodimer in two different ways. When ARF1 employs the negative interface for the heterodimer formation, the
46
binding affinity could not be measured by ITC, because it was higher than 100 mM.
Mapping the basic interface of the IAA17DIII-IV hetero dimer.
To understand the structural basis of the preferential heterodimer formation, we compared the binding interface of the repressor-heterodimer(15N-labeled-IAA17
M1:ARF1M2) with that of the
activator-heterodimer(15N-labeled-IAA17
M1:ARF1M2) (Figure 24). Large chemical
shifts perturbation (CSPs) is mainly shown in the β3−β4−α2 region that contained Asp183 and Asp187 (Figure 24). The CSP data indicates that IAA17 M1 used largely the similar binding interface of the heterodimer
formation with ARF5 M2 and ARF1 M2. Therefore, electrostatic interaction
(Lys of basic interface, Asp of acidic interface) induces the binding of homo-hetero formation. The refined thermodynamic and structural analysis of ARF5
DIII/IV, ARF7 DIII/IV interface showed that Domain III/IV dimerization is not
only driven by electrostatic force between the invariant lysine and main cluster of acidic residue in PB domain but also hydrogen bonding and hydrophobic contact (52) (Figure 21, Figure 22). The modeling structure of ARF1 positive interface and ARF5 negative interface shows static hindrance between the loop of ARF1 and hydrophobic pocket of ARF5 (Figure 25).
47
ARF1 domain III/IV mutation for heterodimer
The positive interface of ARF1(repressor) has one more residue (Ala 548 ARF1) in loop. The negative interface of ARF activator has highly conserve residue in hydrophobic pocket (valine, leucine). I mutated deletion Ala 548 and Q545T in positive interface of ARF1 and M597V and M598L in negative for understanding binding preference of ARF1.
The binding heat of heterodimer (ARF1M2: ARF5M1) and heterodimer
(ARF1M2: IAA17M1) formation is not detected by ITC, that employed positive
interface of ARF1. The ARF1M2D548AQ545T is shown similar binding affinity of
hetero dimer formation (ARF1M1:ARF5M2, ARF1M1: IAA17M2) (Figure 26 B).
To confirm the contribution of Ala548 residue in ARF1 to heterodimer formation (ARF1M2: IAA17M1), I mutated ARF5M2ins804A and
ARF1M1 M597LM598V and assessed ARF1, ARF5, and IAA17 binding by ITC.
The affinity of the ARF5M2intA804 with ARF1M1 was similar values of ARF1
homodimer formation. When ARF1M1 M597LM598V employs the negative
interface for the homodimer formation, the binding affinity could not be measured by ITC, because it was higher than 100 mM.
48
Figure 23. KD of the homodimer and heterodimer formation of IAA17IIIIV,
ARF5IIIIV and ARF1 IIIIV.
Integrated heats of injection (solid squares) and the least squares fit curves (black line), derived from a simple one-site binding model for the titration between
(A) ARF1M1 and ARF1M2 (B) ARF5M1 and IAA17M2 (C) ARF1M1 and ARF5M2 (D)
49
Figure 24.
Heterodimer basic interface of Aux/IAA17 domain III-IV
Weighted average
1H
N/
15N chemical shift perturbation (CSP=([(
HN)
2+
(
N)
2/25]/2)
1/2) as a function of residue number upon heterodimer
formation. Residues with > 0.1 are shown in yellow with the conserved
Lys114 in blue. (A)
15N-IAA17
M1and ARF1
M2(B)
15N-IAA17
M2and
ARF5
M115N-IAA17M2 + ARF1M1
15N-IAA17M2 + ARF5M1
50
Figure 25. Domain III-IV structure of ARF5(A) homodimer and ARF1(B) heterodimer.
51
Figure 26. KD of interface mutation on ARF1DIII-IV positive interface
(A) The binding affinity of ARF1M2 using positive interface, derived from a
simple one-site binding model titration between ARF1M2 and ARF1M1, ARF5M1, and IAA17M1. The binding heat only detected from homodimer formation.
(B) The hydrophobic loop of ARF1M2(Q545T DelA548) is smaller than ARF1M2.
53
Figure 27. KD of interface mutation on ARF1DIII-IV negative interface
and ARF5DIII-IV positive interface.
(A) The binding affinity of ARF5M2(intA804) using positive interface, the
binding affinity is reduced for heterodimer.
(B) The hydrophobic loop of ARF1M2(Q545T DelA548) is smaller than ARF1M2.
The hetero dimer binding affinity is stronger than ARF1M2.
ARF5 M2 insA804
ins804A V805
T801
- +
ARF1M 1 ARF5M2 insA804
KD = 0.88 ± 0.2μM
- +
ARF5M 1 ARF5M 2 insA804
KD = 8.20 ± 1.4μM
- +
IAA17M 1 ARF5M2 insA804
KD = 7.75 ± 1.4μM
- +
ARF1M 5 ARF5M 2 insA804
KD = 2.5 ± 0.61μM ARF1 M1 M 597L M 598V M 597L M 598V - + ARF1M 1 M 597L M 598V ARF1M2 - + ARF1M 1 M 597L M 598V ARF5M2 KD = 3.03 ± 0.86μM - +
ARF1M 1 M 597L M 598V ARF5M 2 insA804
KD = 2.5 ± 0.61μM
- +
ARF1M 1 M 597L M 598V IAA17M 2
54
Table 3. Thermodynamic parameters for the homodimer and
heterodimer formation between domains III-IV of ARF1, IAA17 and
ARF5 obtained by isothermal titration calorimetry at 25°C.
Description KD (μM) DG (kcal/mol) DH (kcal/mol) -TDS (kcal/mol)
ARF1M1 + ARF1M2 0.25 ± 0.05 -9.0 -3.3 ± 0.0 19.1
ARF1M1 + IAA17M2 2.31 ± 0.57 -7.7 -9.0 ± 0.1 -4.4
55
Figure 28. A model of transcriptional control from the interaction between IAA
and ARF
In the presence of auxin, IAA is degradation and ARF activator forms an active oligomer to turn on the gene expression. In the absence of auxin, IAA and ARF activator form hetero-oligomers for transcriptional repression. In addition, association of the co-repressor TPL with IAA represses the gene expression. MR, middle region.
1
56
Discussion
Discussion
The interplay between ARF and IAA repressor is the most important regulation of auxin-response gene expression. Recent investigations have focused on transcriptional response to auxin, however, the structural mechanisms were poorly understood. I have shown that IAAIII-IV and ARFIII-IV have the same PB1-like b-grasp scaffolds. The difference is that IAAIII-IV has the long insert sequence (a dynamic helical conformation). The role of this dynamic helix of IAA17 is still unclear in the role of homodimer (IAA17:IAA17) and heterodimer (IAA17:ARF5). The truncation of the dynamic helix did not perturb neither the folding nor the oligomerization. The path from auxin signal perception to altered gene expression has a lot of key components. The dynamic helix can interact with other key proteins the pathway. An impact of the dynamic helix on the binding specificity of IAA17 requires careful examination in systematic binding studies.
The chemical shift perturbation profiles indicate that IAA17 employs similar binding interface of the IAA-IAA, the IAA-ARF (repressor) and , IAA-ARF (activator) interaction. The binding interfaces were consistent with the oligomer in the crystal structure (ARF5:4CHK, ARF7:4nj6) and CSP result of PsIAA4. It suggests that the homo- and hetero-oligomers would extend in a similar arrangement. The single and double mutations in this study abolished the oligomerization of IAA, ARF(repressor), and ARF(activator).
57
The key charge residues and distribution at the interfaces are essential for the association.
The binding affinity of the heterodimer (IAA17:ARF5) indicates that the charge modulation at the interaction surface can be a general strategy to head-tail between IAA and ARF activator family proteins. Although electrostatic contacts are critical for domain III-IV oligomerization, the binding preference of IAA17 has different role between IAA and ARF activator and ARF repressor. The ARF1(repressor) model is predicted to be highly similar to the ARF5(activator). The key residues are also highly conserved in negative and positive interface. By contrast, the binding affinity of heterodimer (IAA17:ARF1) of IAA17 is weaker than heterodimer IAA17:ARF5 and homodimer (ARF1:ARF1). ARF1 (repressor) has one more hydrophobic residue in basic interface. The acidic interface of ARF1 consists of methionine instead of valine in ARF activator. These modifications are shared in most of ARF repressor and could reduce the capacity of ARF repressor to interact with ARF activators and IAAs.
The auxin-signaling model described a Aux/IAA protein interacting with a ARF protein in low concentration of auxin. In vivo, IAA and ARF family concentrations are not known, but local concentration can be rised when auxin regulated transcription in nucleus. The highly expressed IAA and ARF family that can lead to the formation of high-order oligomers. The binding affinity is notable that binding favors are the heterodimer formation over individual homodimers. The repression of ARF is a thermodynamically downhill process
58
by IAA. When auxin is low concentration in nucleus, formation of the higher-affinity hetero-oligomer is preferred for transcriptional repression. The auxin promotes degradation of IAA releasing ARF activator. The equilibrium shift re-establishes ARF5 homo-oligomers to resume transcriptional activation. However, the binding favor is the homodimer in case of ARF1(repressor). This binding favor suggests that ARF repressor is auxin independent and might simply compete with ARF activators for binding to the promoter of auxin-inducible genes without forming heterodimer with Aux/IAA.
Taken together, IAA17 forms a tight heterodimer with ARF5(activator) by both positive and negative interfaces. It can insert itself into the ARF5 oligomer to form a hetero-oligomer (Figure 28). ARF1(repressor) forms a tight homodimer by both positive and negative interfaces of it’s own. In this model, the transcriptional repression can be achieved by 1) homo-oligomer of ARF1 and 2) by hetero-oligomer of ARF5 with IAA. ARF5 keeps high local concentrations by forming hetero-oligomers, so that functional ARF oligomers can rapidly form upon IAA degradation and promptly express auxin-response genes. The subunit exchange (driven by thermodynamic equilibrium) coule be the basic mechanism that modulates auxin-response gene expression.
59
Reference
1. Vanneste, S., & Friml, J. (2009). Auxin: a trigger for change in plant development.
Cell, 136(6), 1005-1016.
2. Berleth, T., & Sachs, T. (2001). Plant morphogenesis: long-distance coordination and local patterning. Current opinion in plant biology, 4(1), 57-62.
3. Chapman, E. J., & Estelle, M. (2009). Mechanism of auxin-regulated gene expression in plants. Annual review of genetics, 43, 265-285.
4. Guilfoyle, T. J., & Hagen, G. (2007). Auxin response factors. Current opinion in
plant biology, 10(5), 453-460.
5. Guilfoyle, T. J., & Hagen, G. (2001). Auxin response factors. Journal of Plant
Growth Regulation, 20(3), 281-291.
7. Ulmasov, T., Hagen, G., & Guilfoyle, T. J. (1997). ARF1, a transcription factor that binds to auxin response elements. Science, 276(5320), 1865-1868.
8. Kim, J., Harter, K., & Theologis, A. (1997). Protein–protein interactions among the Aux/IAA proteins. Proceedings of the National Academy of Sciences,94(22), 11786-11791.
9. Rouse, D., Mackay, P., Stirnberg, P., Estelle, M., & Leyser, O. (1998). Changes in auxin response from mutations in an AUX/IAA gene. Science, 279(5355), 1371-1373.