High-tech markets are unpredictable owing to rapid technology innovation, diverse customer needs, high competition, and other elements. Many scholars have attempted to explain the uncertainty in high-tech markets using their own various approaches. However, sufficiently clear ways to predict diverse changes and trends in high-tech markets have yet to be presented. Thus, this paper proposes a new approach model, that is, systematic market segmentation, to give more accurate information. Using an empirical dataset from the mobile handset market in the Republic of Korea, we conduct our research model consisting of three steps. First, we categorize nine basic segments. Second, we test the stability of these segments. Finally, we profile the characteristics of the customers and products. We conclude that the approach is able to offer more diagnostic information to both practitioners and scholars. It is expected to provide rich information for an appropriate marketing mix in practice.
Keywords: Systematic market segmentation, predictive method, market stability, high-tech market, mobile handset market.
Manuscript received Apr. 25, 2012; revised Oct. 4, 2012; accepted Oct. 26, 2012. Yonghee Shin (phone: +82 42 860 1147, syong@etri.re.kr), Eoksoo Han (eshan@etri.re.kr), and Sungyoung Jung (jsykt@etri.re.kr) are with the Future Research Creative Laboratory, ETRI, Daejeon, Rep. of Korea.
Hyori Jeon (hrjeon@kaist.ac.kr) is with the Research Planning Center, KAIST, Daejeon, Rep. of Korea.
Munkee Choi (mk1515@kaist.ac.kr) is with the Department of Management Science, KAIST, Daejeon, Rep. of Korea.
http://dx.doi.org/10.4218/etrij.13.0112.0251
I. Introduction
Such high-tech markets as those in the IT industry can be characterized by their complexity. Nystrom [1] described high-tech markets as being market dependent and high-technology driven. In particular, the customers have in most cases shown a whimsical tendency to quickly jump from a certain segment to another, as they are easily affected by factors in the market environment, such as radical innovation, short technology and product lifecycle, rapid changes in needs, and so on. Under these circumstances, only a few firms can survive and succeed in high-tech markets.
In this context, numerous studies have suggested crucial marketing strategies and procedures that allow firms to increase the possibility of success in a volatile high-tech market environment. First, it is critical to consider how customers think and feel about new products [1]. Several studies provided evidence that customer expectations are more critical in high-tech markets because the rapid changes in product attributes induce customers to have dynamic expectations [2], [3]. Second, after targeting a certain group and producing proper items in response to customer needs, firms should adequately supply the items to their target customers [4]. Finally, firms should have their own strategy to deliver the values and benefits that will satisfy customer needs without time delay [5]-[7]. The bulk of evidence has supported the idea that firms should take into account their marketing strategies and procedures [8]. Otherwise, no one can be confident that success is possible in an unpredictable and competitive market environment. The representative successful case in the
high-An Empirical high-Analysis on a Predictive Method
of Systematic Segmentation
in Volatile High-Tech Markets
tech market is Apple’s iPhone. The reasons for Apple’s success are its accurate understanding of latent customer behaviors and ability to precisely forecast rapid changes in customer needs for full browsing, a full touch screen, and an aesthetic design in the mobile handset market [9]. Although market segmentation is the most important approach in establishing a market strategy, most previous approaches unfortunately have not reflected the dynamics of a high-tech market. Therefore, the main purpose of this study is to introduce and explore a new approach that can acquire more accurate information affecting the successful performance of firms in a high-tech market.
Section II reviews the previous literature and some limitations, while sections III and IV describe our research design and method. In sections V and VI, we empirically test our research, show detailed results of our empirical analysis, and discuss some of the limitations and implications of our approach. We discuss some future topics of interest in the final section.
II. Literature Review on Market Segmentation
In the early 1930s, Chamberlin [10] and Robinson [11] initially studied segmentation using a normative approach in economics. Next, Smith [12] discussed the general concept of market segmentation. Thereafter, studies attempted to define what market segmentation is [13], [14].
In the early stage of market segmentation, some scholars employed intuitive and pragmatic approaches based on geographic and demographic variables for the following reasons: 1) availability of datasets, 2) relatively simple methods for analysis, and 3) low cost of research. For these reasons, they did not clearly explain the customer needs and behavior in a real market. Due to these limitations, many researchers have suggested using more practical market segmentation methods utilizing diverse factors, such as values, benefits, patterns of behavior, and attitudes. In particular, such segmentation bases as values and benefits provide a better understanding of customer needs [8]. Some scholars have insisted that value- and benefit-based market segmentation methods are more applicable than other methods based on demographic analysis, psychographic approach, and so forth [4], [13], [15], [16]. Moreover, market segmentation can be categorized into two types by the segmentation bases as summarized in Table 1.1)
The first type of market segmentation is a general segmentation that is not directly related to a certain product, service, or circumstance. General segmentation2) is rather closely related
to the substantial characteristics of customers. General market
1) Segmentation bases are defined as a set of variables or characteristics used to assign potential customers to homogeneous groups.
2) General values are terminal or ultimate values sought after throughout a customer’s lifetime.
Table 1. Literature reviews of market segmentation.
Type Segmentation bases Researchers Geographic :
location, region, ACORN Sociodemographic: age, gender, job General
bases
Psychographic: general value, lifestyle
Smith (1956) [12] Mitchell (1983) [19] Gunter (1992) [21] McDonald (1995) [22] Dibb (2001) [14] Vyncke (2002) [17] Allred (2006) [18] Behavioral :
usage pattern, loyalty Benefit :
product specific benefit Specific
bases
Value :
product specific values
Wind (1974) [15] Wikie (1977) [20] Everitt (1984) [16] Dibb (1994) [4] Wedel (2000) [13] Mu (2005) [30] Zhu (2009) [31] Combined bases Combining items: -geographic + benefit; -motivation + lifestyle + attributes Khale (1986) [23] Kamakura (1992) [13] Mazzoni (2007) [29] Hung (2008) [24] Liu (2010) [25] Cleveland (2011) [26] Lemmens (2012) [27]
segmentation does not explain specific information on products but does explain long-term customer behavior. By contrast, the second type of market segmentation is specific segmentation, which is directly related to products or services, such as instrumental value, benefit, and usage pattern, which are the main variables that can be used as segmentation bases [13], [20].
However, if these approaches use only one or two factors as segmentation bases, it is hard to provide sufficient information on a competitive market environment. Regarding these weak points, researchers have attempted more sophisticated approaches that can give more detailed and abundant information on markets and customers by combining certain bases (for example, values, benefits, lifestyles, and attitudes) over time [13], [23]-[27], [29]. However, this approach has some limitations because it is not actually a systematic method in that it only technically combines several segmentation bases with less consideration of each causal relation in view of customer behavioral studies. Moreover, because these approaches arbitrarily combine segmentation bases with their own purposes of research, it is somewhat hard to clearly interpret the results of market segmentation and predict dynamic market changes [29]. Therefore, in the next section, we discuss a new systematic approach on market segmentation, which can be used to overcome these limitations.
III. New Research Approach and Model
1. New Approach on Market SegmentationIn this section, we suggest a new method of systematic market segmentation. It can be defined as a holistic approach that includes low-level (that is, concrete product attributes) to high-level segmentation bases (that is, general values of customers). Furthermore, the systematic market segmentation proposed in this study structuralizes segmentation bases, from product related to customer related, based on the means-end chain theory. The means-end chain theory is a fundamental conceptual tool that allows us to understand how consumers perceive the self-relevant outcome of product consumption [32]-[34]. Most customers habitually choose and purchase certain products based on their own value systems [33]. Thus, the theory is defined as a way to understand consumers’ cognitive networks related to their product consumption [35].
Given this crucial point of view, we employ the concept of the means-end chain to understand the systematic relationship between products and customers. More precisely, the structure of the means-end chain is used to explore the connection between customers (that is, self-knowledge) and products (that is, product-knowledge). By benchmarking the means-end chain theory and emphasizing a holistic approach, we suggest new bases for systematic market segmentation. We expect that this new approach can 1) overcome the limitations of conventional approaches, 2) support a reasonable interpretation of the results from market segmentation, and 3) enable prediction of the dynamically changeable aspects of a high-tech market.
2. Research Model
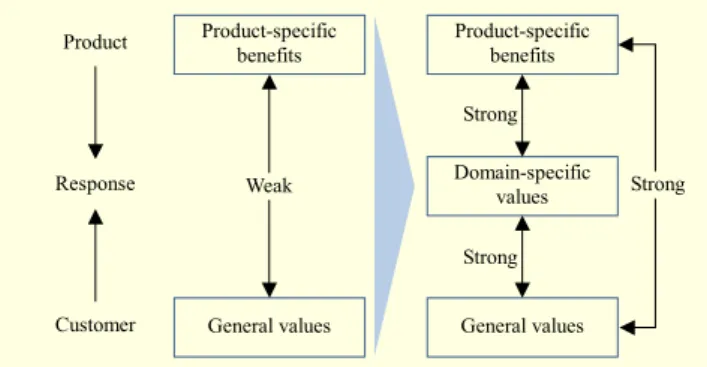
The weak point of conventional market segmentation is the absence of the link between customers and products, as the relationship between customers and products is not considered. In other words, the applicable results of market segmentation can be drawn by employing new bases to link the general values of customers and product-specific benefits in high-tech markets. We argue that the general values do not correlate sufficiently with product-specific benefits. The domain3)
-specific values do [36], however, because they have a strong relationship with both product-specific benefits and the general values of the customers, as described in Fig. 1. Thus, we adopt domain-specific values as intervening bases for supplementing the link between customers and products.
Figure 1 shows the structure of systematic segmentation
3) “Domain” refers to a domain of behavior, which is defined as a set of behaviors with a common goal or brand [36].
Fig. 1. Structure of segmentation bases. General values Product-specific benefits Customer Response Product Strong General values Domain-specific values Product-specific benefits Weak Strong Strong
Fig. 2. Procedures of systematic market segmentation. General values
Domain-specific values Product-specific
benefits
Step 1. Generating basic segments
Utilities Consequences Attributes Beliefs Attitudes Intentions
Bases Product Behavior
Function Preference type Usage pattern Willingness to pay Demographics Socioeconomics Step 3. Profile
Step 2. Checking stability of segments
bases for volatile high-tech markets.4) The bases are employed
in terms of the attributes of products (product-specific benefits), customer responses to certain products (domain-specific values), and the customers’ own traits (general values) in the following research model.
As shown in Fig. 2, the new research model proposed in this study is composed of three steps.
The first step is to generate the basic segments of a high-tech market. In this step, we segment a market by domain-specific values and product-specific benefits.5) Although the values and
benefits based on market segmentation may be powerful for obtaining information about current customer needs, this method does not explain the dynamics of segments. As an understanding of market dynamics is important for predicting rapid changes in high-tech markets, we suggest a second step with regard to segment dynamics.
The main purpose of the second step is not only to show market stability but also to find a clue to solve the problem of segment dynamics. The degree of market stability means the possibility of customers switching from the current segment to another segment. The way to measure market stability is to
4) The most important thing to understand about high-tech markets is how customers respond to products or technologies as time passes [3].
5) According to the Grey Benefit Chain in the value attitude systems theory, customers decide whether to purchase a certain product by considering both the expected domain-specific value and the benefit [37].
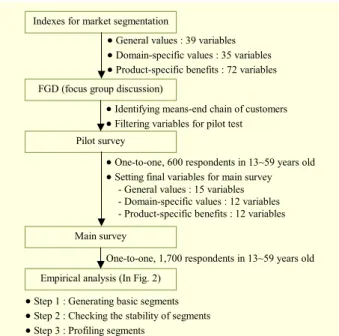
Fig. 3. Research procedure. Indexes for market segmentation
FGD (focus group discussion)
Pilot survey
Empirical analysis (In Fig. 2)
•General values : 39 variables •Domain-specific values : 35 variables •Product-specific benefits : 72 variables •Identifying means-end chain of customers •Filtering variables for pilot test
•One-to-one, 600 respondents in 13~59 years old •Setting final variables for main survey
- General values : 15 variables - Domain-specific values : 12 variables - Product-specific benefits : 12 variables
•Step 1 : Generating basic segments •Step 2 : Checking the stability of segments •Step 3 : Profiling segments
Main survey
One-to-one, 1,700 respondents in 13~59 years old
compare the customers’ general values and domain-specific values and to evaluate the congruence between the two in each basic segment. For example, if the stability is high in a certain segment, it implies that customers’ purchasing behavior is consistent with their general values. Therefore, customers are more likely to stay in the segment. On the other hand, if stability is low in a certain segment, customers may purchase products that are less associated with the general values. Therefore, they may attempt to move to a new segmented market to associate with the general values [38], [39].
The third step is to profile the basic segments according to the customers, their response, and the product. By organizing the profiles in each segment, we can find diagnostic information to establish the marketing mix.
IV. Research Design, Method, and Procedures
As shown in Fig. 3, the empirical analysis used in this study consists of three parts.
1. Define Indexes for Market Segmentation
The general values used in our empirical study consist of 39 variables that are chosen from the following five theories: Maslow’s hierarchy of needs theory, the Rokeach Value Survey [40], the List of Values [23], and VALS I and II [23]. Then, for the domain-specific values, we select 35 variables by referring to the instrumental values of the Rokeach Value Survey. These variables are changed into mobile-specific characteristics. For the product-specific benefits, 72 variables are chosen from
Table 2. Final bases of market segmentation.
Bases Final variables
Customers’ general values
(15)
Pursue social recognition (respect, admiration) Pursue self-actualization
Pursue salvation (faith, belief in eternal life) Pursue social-esteem
Pursue sense of belonging
Pursue comfortable life (prosperous life) Pursue equality (brotherhood, equal opportunity) Pursue true friendship (companionship) Pursue mature love (spiritual intimacy) Pursue self-respect (self-esteem)
Pursue sense of accomplishment (lasting contribution) Pursue happiness (contentedness)
Pursue inner harmony (freedom from inner conflict) Pursue pleasure (leisurely life)
Pursue exciting life (a stimulating, active life)
Domain-specific values
(12)
Utilize for efficiency of work Utilize for amicable communications Utilize for job fulfillment
Utilize for self-development
Utilize for continuous self-improvement Utilize for showing-off others Utilize for managing human networks
Utilize for a sense of community and fellowship Utilize for self-esteem
Utilize for self-satisfaction Utilize for stress relief Utilize for enjoyment
Product-specific benefits (12) Be easy to portable Be easy to use Be durable exterior Be the latest style and design Be sophisticated design
Be high quality in core function (i.e., communication) Be various supplementary functions
Be the newest high-tech functions
Be superior specifications (in the side of form-factor) Be not easy to tire for a long time
Be cheap and affordable price Be high performance for one’s price
relevant references, such as Sheth’s consumption value theory [41].
2. Set Up Final Bases of Market Segmentation
We chose the Korean mobile handset market for our study because it has been shown to be a typical example of a high-tech market with significant uncertainty in terms of high-technology and market. We conducted a focus group discussion (FGD) in
2007 to identify the customer perception structure.6) Using the
FGD analysis, we reorganized and modified some of the redundant and ambiguous variables. Through these procedures, we refined the variables7) that could be employed for the pilot test.
Next, we conducted a pilot test to determine the final variables. For the pilot test, we surveyed 600 mobile handset users aged between 13 and 59 from August 9th to 27th, 2007. The pilot test was analyzed using a tree structure, exploratory factor analysis, and the CHAID method [42], [43]. Table 2 shows the final variables of our systematic market segmentation in the Korean mobile handset market.
3. Conduct Main Survey for Market Segmentation
The main survey was conducted from October 25th through November 15th, 2007, using face-to-face interviews with 1,700 mobile phone users between 13 and 59 years old.8) Those
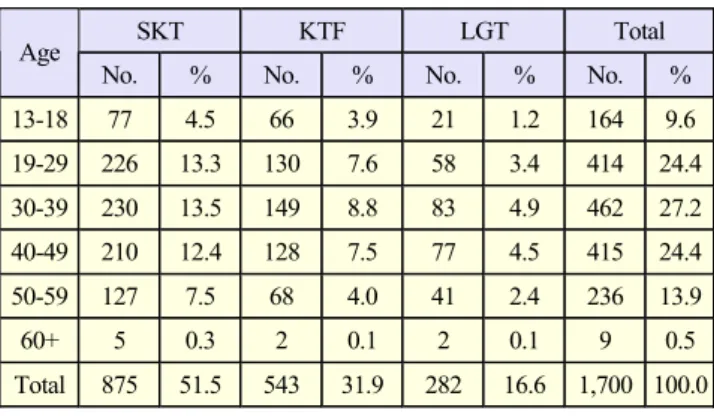
participating in the main survey all lived in Seoul or one of five other large cities in the Republic of Korea. To find the respondents, we used a proportional stratified sampling method reflecting regional and gender ratios, age structure, and market shares of the mobile service providers as shown in Table 3.9)
V. Empirical Analysis
1. Generating Basic SegmentsIn this section, we will attempt to generate basic segments based on our model shown in Fig. 2. To generate basic segments, we use both domain-specific values and product-specific benefits in the Korean mobile handset market. After segmenting the mobile handset market with the respective two bases, we can obtain the basic segments by combining the two results.
First, we segment the mobile handset market with domain- specific values to generate basic segments. Before segmenting the market with the domain-specific values, we conduct a factor analysis to understand the customers’ cognitive structure of the domain-specific values.10) Next, we conduct a cluster
6) The FGD survey was completed from July 7-11, 2007. The respondents participating in the FGD consisted of six subgroups of mobile service users, who ranged from 13 to 45 years in age.
7) The variables were refined by FGD. The number of general variables was reduced from 39 to 27. The number of variables of mobile handset-specific values was reduced from 35 to 20. The number of variables of the benefits was reduced from 72 to 33.
8) For a sample size of 1,700 users, the sampling error had a confidence interval of 95% ± 2.4%p.
9) In October 2007, the three Korean telecommunication service providers, SKT, KTF, and LGT, had respective market shares of 50.5%, 31.6%, and 17.9%.
10) For the factor analysis, we used an extraction method with a principal component analysis and varimax rotation. We determined factors of over 1.0 in eigenvalue and 0.5 in factor loading and verified the consistency and reliability of the inter-factors using Cronbach’s alpha and a scree test [45], [46].
Table 3. Results of proportional stratified sampling.
SKT KTF LGT Total Age
No. % No. % No. % No. % 13-18 77 4.5 66 3.9 21 1.2 164 9.6 19-29 226 13.3 130 7.6 58 3.4 414 24.4 30-39 230 13.5 149 8.8 83 4.9 462 27.2 40-49 210 12.4 128 7.5 77 4.5 415 24.4 50-59 127 7.5 68 4.0 41 2.4 236 13.9 60+ 5 0.3 2 0.1 2 0.1 9 0.5 Total 875 51.5 543 31.9 282 16.6 1,700 100.0
Table 4. Cluster results using domain-specific value factors.
Factor N=586, 35Cluster I % Cluster II N=329, 19% Cluster III N=785, 46% F Sig. Prestige 0.187 –1.533 0.503 201.96 0.000 Achievement –0.765 0.451 0.382 737.89 0.000 Relationship 0.654 0.139 –0.547 763.16 0.000
analysis to create subgroups using the factor scores. The number of clusters is determined by referring to the dendrogram, which is drawn from the results of the hierarchical cluster analysis, the variation curve of the fusion coefficients, and the distribution of segmented markets. Considering these three criteria, it can be argued that three clusters are drawn for our market segmentation model [44]. After determining the three clusters, we perform a cluster analysis using the K-means clustering method, which is a nonhierarchical clustering method [42]. We find the differences of the three clusters by comparing each average factor loading. Table 4 indicates the results of our cluster analysis, which are statistically significant. Customers included in Cluster I have a very positive attitude toward their relationship. On the other hand, they have a strongly negative attitude toward achievement. The customers included in this cluster can be labeled as honorable relationship seekers,11) as they may
pursue fame and friendship over job achievement. Customers included in Cluster II can be called relation-based achievement seekers12) because they have a strong enthusiasm in pursuing
practical success within the framework of their social life. They have a positive attitude toward achievement and a negative attitude toward prestige. Finally, customers included in Cluster III prefer prestige to relationships, which they have a
11) This is similar to type 1 (that is, Guanxi-expanding) among the four mobile phone user types defined using the Q-methodology [47].
12) This is similar to type 2 (that is, value-driven) among the three types of cell phone users in Italy [29].
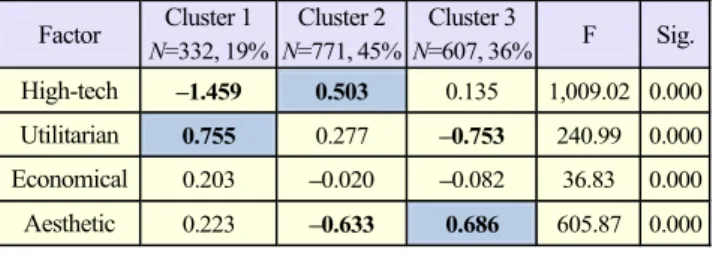
Table 5. Cluster results using product-specific benefit factors. Factor Cluster 1 N=332, 19% Cluster 2 N=771, 45% Cluster 3 N=607, 36% F Sig. High-tech –1.459 0.503 0.135 1,009.02 0.000 Utilitarian 0.755 0.277 –0.753 240.99 0.000 Economical 0.203 –0.020 –0.082 36.83 0.000 Aesthetic 0.223 –0.633 0.686 605.87 0.000
Table 6. Basic segments using 3×3 clusters.
Domain-specific values Product- specific benefits Honorable relationship Relationship-based achievement Achievement-oriented prestige Substantial pragmatic Seg. 1 Seg. 4 Seg. 7
Practical premier Seg. 2 Seg. 5 Seg. 8 Techno-stylist Seg. 3 Seg. 6 Seg. 9
negative attitude toward. Therefore, they could be called achievement-oriented prestige seekers,13) as they inherently
want not only to show off their status to others but also to receive envy from them.
Second, using the same method and process, we segment the mobile handset market in terms of product-specific benefits. We conduct a factor analysis to determine the cognitive structure of mobile handset specific benefits and then perform a cluster analysis to create subgroups using the scores of these factors. Table 5 shows the results of this segmentation. Customers in Cluster 1 are defined as substantial pragmatists; these customers want fundamental communication functions at an appropriate price level. In this cluster, customers have a strongly positive attitude toward utilitarianism and a strongly negative attitude toward high technology. Customers in Cluster 2, practical premiers, desire the newest and best practical full-option handsets with less consideration for design and price. Finally, customers included in Cluster 3 are called techno-stylists, consisting of consumers who pay attention not to basic functions of mobile handsets, such as quality of service, but to fashionable designs and multimedia functions. Customers in this cluster have a strong positive attitude toward aesthetics and a strong negative attitude toward utilitarianism.
We combine the two results (3×3) and generate nine basic segments regarding the Korean mobile handset market. Table 6 explains how to generate basic segments, and Table 7 shows the results of the generated basic segments.
13) This is similar to the characteristics of type 1 (that is, techno-fun) among the three types of cell phone users in Italy [29].
With regard to the domain-specific values, 46.2% of the mobile handset market is made up of achievement-oriented prestige seekers. Regarding the product-specific benefits, 45.4% of the mobile handset market is made up of practical premiers. The common characteristics between an achievement-oriented prestige seeker and a practical premier is that they want to increase their job efficiency by practically utilizing new high-tech functions rather than focusing on economical factors and outward designs. Through an increase in job efficiency, they not only pursue social success and fame but also yearn to have self-satisfaction and pride. In other words, they ultimately wish to increase their own satisfaction by practically utilizing high-tech mobile handsets.
2. Checking the Stability of Basic Segments
A stable segmented market means that the general and domain-specific values are mutually congruent. The customers in stable segments seem to feel emotional security, whereas those who are in unstable segments do not. Therefore, the former are less likely to move to other segments, while the latter require some actions to fulfill what is unmet.
By mutually comparing the propensity of domain-specific values and the tendency of general values within the nine basic segments, the degree of stability of the segments may be understood. Before analyzing the congruence of segments, we conduct a factor analysis with the fifteen segmentation bases of general values depicted in Table 2 to understand the customers’ general value structure.
Based on these values, we reorganize one-to-one relations (that is, honorable life to prestige; pro-social achievement to achievement; and happy together to relationship) to identify a meaningful similarity between general and domain-specific values [28], [40], [48]. Although general values are more abstract than domain-specific values, customers may pursue their own general values by means of domain-specific values. For example, an honorable life can be attained through prestige. Table 8 indicates an ideal combination between general and domain-specific values in each basic segment. If a certain segment is accorded with an ideal combination of values, it can be argued that the segment is stable. Based on the assumption of the ideal combination, we conduct a test to know whether the stability of each segment is observable. We check the stability of the basic segments, and Table 8 shows the degrees of coincidence.14) The results from comparing the ranks on the
right side of Table 8 show the stability of each segment.
14) We shaded the cells because, as mentioned above, these cells should essentially coincide. If the the general value coincided with the domain-specific value in each cell, we applied a positive point, +, and vice versa. In particular, we weighted the shaded cells as double. When the number of+ and – were the same, we used a “±” symbol.
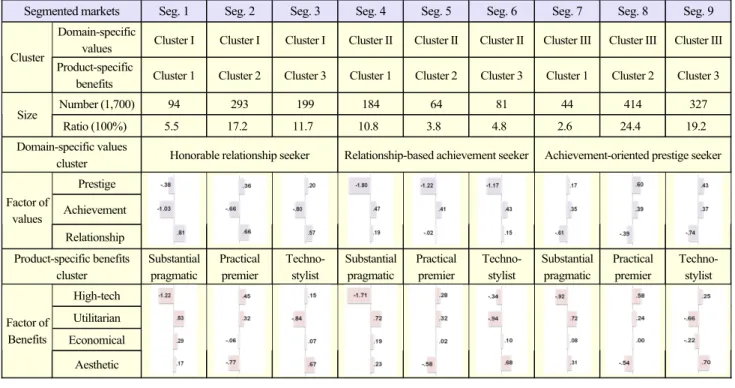
Table 7. Results of basic segments: nine basic segments of Korean mobile handset market.
Segmented markets Seg. 1 Seg. 2 Seg. 3 Seg. 4 Seg. 5 Seg. 6 Seg. 7 Seg. 8 Seg. 9 Domain-specific
values Cluster I Cluster I Cluster I Cluster II Cluster II Cluster II Cluster III Cluster III Cluster III Cluster
Product-specific
benefits Cluster 1 Cluster 2 Cluster 3 Cluster 1 Cluster 2 Cluster 3 Cluster 1 Cluster 2 Cluster 3 Number (1,700) 94 293 199 184 64 81 44 414 327 Size
Ratio (100%) 5.5 17.2 11.7 10.8 3.8 4.8 2.6 24.4 19.2 Domain-specific values
cluster Honorable relationship seeker Relationship-based achievement seeker Achievement-oriented prestige seeker Prestige Achievement Factor of values Relationship Product-specific benefits cluster Substantial pragmatic Practical premier Techno-stylist Substantial pragmatic Practical premier Techno-stylist Substantial pragmatic Practical premier Techno-stylist High-tech Utilitarian Economical Factor of Benefits Aesthetic
Table 8. Results of market stability test based on ideal combination of general and domain-specific values.
Segments (size, %) Seg. 1 (94, 5.5%) Seg. 2 (293, 17.2%) Seg. 3 (199, 11.7%) Seg. 4 (184, 10.8%) Seg. 5 (64, 3.8%) Seg. 6 (81, 4.8%) Seg. 7 (44, 2.6%) Seg. 8 (414, 24.4%) Seg. 9 (327, 19.2%) Total (1,700, 100%)
Group (size, %) Group 1 (586, 33.4%) Group 2 (329, 19.4%) Group 3 (785, 46.2%) - Honorable life –0.650 3* 0.071 2 0.080 3 –0.794 3 –0.395 3 –0.298 2 –0.201 3 0.415 1 0.174 1 Pro-social achieve 0.091 1 0.054 3 0.110 2 0.215 1 0.191 1 0.039 1 0.325 1 -0.041 3 –0.301 3 General value Happy together 0.049 2 0.073 1 0.127 1 –0.527 2 –0.337 2 -0.570 3 0.001 2 0.187 2 0.110 2 Characteristics of customer Prestige –0.375 3 0.360 2 0.197 2 –1.801 3 –1.220 3 –1.169 3 0.170 2 0.598 1 0.427 1 Achievement –1.026 2 –0.661 3 –0.795 3 0.475 1 0.411 1 0.427 1 0.349 1 0.394 2 0.372 2 Domain specific value Relationship 0.810 1 0.658 1 0.574 1 0.191 2 –0.022 2 0.150 2 –0.607 3 -0.391 3 –0.735 3 Response to product Stability of segments** – – + + + + ± + + + + + + + + ± – – ± ± –
* The rank in order of value importance felt by users, ** + denotes stable, ± denotes neutral, and – denotes unstable
According to these results, the markets of Segs. 2, 4, and 5 are considerably stable. These three segments have a common factor in pursuing inner achievement. The markets of Segs. 3, 6, 8, and 9 are somewhat stable or neutral. These markets have the characteristics of pursuing aesthetic benefits. The remaining markets of Segs. 1 and 7 are unstable, and they feature the common characteristics of pursuing social relationships or fame-based utilitarian benefits.
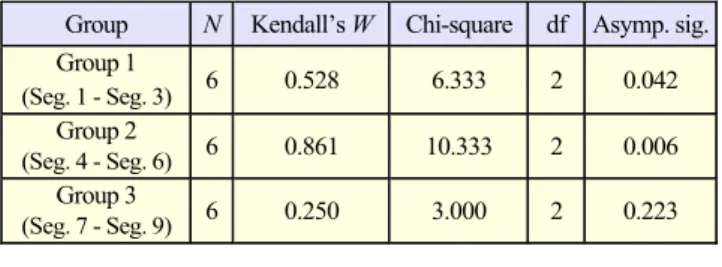
Using the ranks of the factor scores, we test Kendall’s coefficient of concordance [49]. Table 9 shows the results of
the Kendall’s W test.15) According to these results, shown in
Table 8, there are three basic groups. The general value coincides with the domain-specific value for both Group 1 (pursuing honorable relationships) and Group 2 (seeking relation-based achievements) but not for Group 3 (striving for achievement-oriented prestige).
15) For a test statistic W of 1, all survey respondents were unanimous, and each respondent assigned the same order to the list of concerns. If W is 0, then there is no overall trend of agreement among the respondents, and their responses may be regarded as essentially random.
Table 9. Kendall’s W of concordance between values.
Group N Kendall’s W Chi-square df Asymp. sig. Group 1 (Seg. 1 - Seg. 3) 6 0.528 6.333 2 0.042 Group 2 (Seg. 4 - Seg. 6) 6 0.861 10.333 2 0.006 Group 3 (Seg. 7 - Seg. 9) 6 0.250 3.000 2 0.223
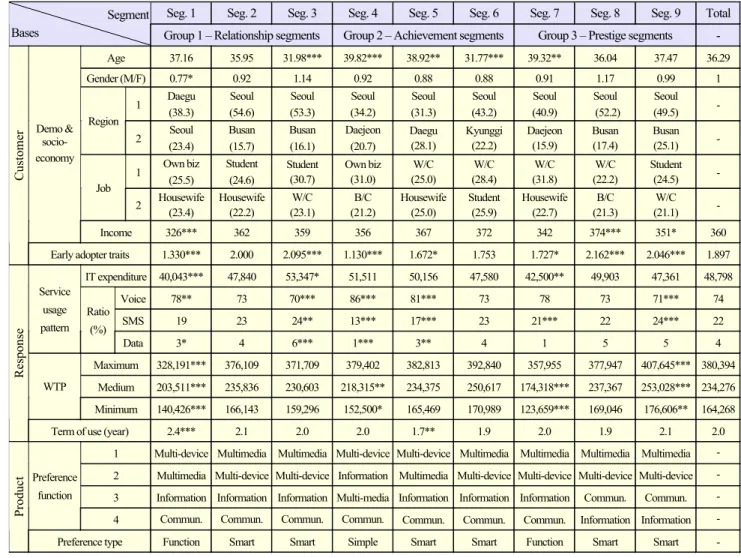
3. Profiling Each Segment of Mobile Handset Market Finally, we profile each segment to draw some diagnostic information in establishing proper marketing strategies. We profile the basic segments from the perspective of certain characteristics, such as customer level (that is, demographics and socioeconomics, early adopter traits), response level (that is, service usage pattern, willingness to pay, terms of use), and product level (that is, preference function, preference type) from Fig. 2. Table 10 shows the results of profiling.
First, customers included in Segs. 3 and 6 are relatively younger than those in the market as a whole, and customers in Segs. 4, 5, and 7 are relatively older than customers in other markets. Second, the rate of female customers is higher than that of male customers in Seg. 1, while the rate of male customers is higher than the rate of female customers in Seg. 8. Third, customers in Segs. 1 and 9 have lower income levels than the customers in other markets, whereas customers in Seg. 8 show a higher income level than the customers of other markets. Fourth, the customers in Segs. 1, 4, and 5 are relatively conservative, and customers who have a propensity toward innovation can be included in Segs. 3, 8, and 9. Fifth, customers included in Segs. 1 and 7 have less IT expenditure than other customers; on the other hand, customers included in Seg. 3 have a relatively higher IT expenditure than other customers. Sixth, regarding the usage pattern, the customers included in Segs. 1, 4, and 5 use voice services more frequently than other customers, while it seems likely that customers in Segs. 3 and 9 are more willing to use SMS and data services than other customers. Seventh, the customers included in Segs. 1, 4, and 7 have a lower willingness to pay for a mobile handset than other customers, whereas customers included in Seg. 9 exhibit a higher willingness to pay for a mobile handset than other customers. Customers included in Seg. 1 use their mobile handsets longer than other customers, and customers in Seg. 5 show an opposite pattern.
VI. Discussion
We would like to discuss some important issues. First, given
the stability of segments, Group 2 (achievement segments, Seg. 4 to Seg. 6) is shown to be very stable compared with Group 1 (relationship segments, Seg. 1 to Seg. 3) and Group 3 (prestige segments, Seg. 7 to Seg. 9). The customers in this group are inclined to strongly pursue social achievement and consider human relationships as important. In particular, these customers seem likely to have a lower tendency to be early adopters. Based on these results, it might be argued that they not only want to maintain their own characteristics but also pursue their personal interests. As mentioned earlier in checking the stability of segments, it can be inferred that those in Group 2 have fewer inner conflicts in that their general values correspond with their domain-specific values.
Second, Group 1 consists of relatively stable segmented markets. Customers within Group 1 have a strong value system in pursuing human relationships and consider prestige as important. In this case, customers have a tendency to have a low intention toward IT expenditure and willingness-to-pay for mobile handsets. In particular, it seems likely that they will tend to hold onto a certain mobile handset without switching to another item. Therefore, because customers within this group are less likely to be interested in a mobile handset, we regard them to be neutral regarding stability and instability. As a matter of fact, Group 3 is unstable with a value system of pursuing prestige through social achievement. In particular, these customers show a tendency toward being early adopters. Given these results, we can argue that they are not only eager for innovative products but also want to show off their social status to others. Despite these needs, few mobile handsets can satisfy customer desires and needs. Therefore, we infer that those in Group 3 have a discontentment with their own mobile handsets. For this reason, they may have considerable inner conflict owing to a disharmony between general and domain-specific values. Thus, there is a strong possibility of the customers’ moving to other segments.
In essence, both Groups 1 and 2 are commonly relationship-oriented segments. In particular, the customers included in these groups emphasize their human relationships. Meanwhile, Group 3 can be defined as a collection of self-oriented segments. The customers included in this group are interested in their own achievement and prestige rather than human relationships. The customers in relationship-oriented segments commonly have conservative traits, showing a harmonious state within the two value structures (that is, general and domain-specific values). On the other hand, those in self-oriented segments have an innovative propensity, showing an unstable state.
VII. Conclusion
Table 10. Results of profiling basic segments.
Seg. 1 Seg. 2 Seg. 3 Seg. 4 Seg. 5 Seg. 6 Seg. 7 Seg. 8 Seg. 9 Total Segment
Bases Group 1 – Relationship segments Group 2 – Achievement segments Group 3 – Prestige segments -
Age 37.16 35.95 31.98*** 39.82*** 38.92** 31.77*** 39.32** 36.04 37.47 36.29 Gender (M/F) 0.77* 0.92 1.14 0.92 0.88 0.88 0.91 1.17 0.99 1 1 Daegu (38.3) Seoul (54.6) Seoul (53.3) Seoul (34.2) Seoul (31.3) Seoul (43.2) Seoul (40.9) Seoul (52.2) Seoul (49.5) - Region 2 Seoul (23.4) Busan (15.7) Busan (16.1) Daejeon (20.7) Daegu (28.1) Kyunggi (22.2) Daejeon (15.9) Busan (17.4) Busan (25.1) - 1 Own biz (25.5) Student (24.6) Student (30.7) Own biz (31.0) W/C (25.0) W/C (28.4) W/C (31.8) W/C (22.2) Student (24.5) - Job
2 Housewife (23.4) Housewife (22.2) (23.1) W/C (21.2) B/C Housewife (25.0) Student (25.9) Housewife (22.7) (21.3) B/C (21.1) W/C - Demo & socio- economy Income 326*** 362 359 356 367 372 342 374*** 351* 360 Cus tomer
Early adopter traits 1.330*** 2.000 2.095*** 1.130*** 1.672* 1.753 1.727* 2.162*** 2.046*** 1.897 IT expenditure 40,043*** 47,840 53,347* 51,511 50,156 47,580 42,500** 49,903 47,361 48,798 Voice 78** 73 70*** 86*** 81*** 73 78 73 71*** 74 SMS 19 23 24** 13*** 17*** 23 21*** 22 24*** 22 Service usage pattern Ratio (%) Data 3* 4 6*** 1*** 3** 4 1 5 5 4 Maximum 328,191*** 376,109 371,709 379,402 382,813 392,840 357,955 377,947 407,645*** 380,394 Medium 203,511*** 235,836 230,603 218,315** 234,375 250,617 174,318*** 237,367 253,028*** 234,276 WTP Minimum 140,426*** 166,143 159,296 152,500* 165,469 170,989 123,659*** 169,046 176,606** 164,268 Respon se
Term of use (year) 2.4*** 2.1 2.0 2.0 1.7** 1.9 2.0 1.9 2.1 2.0 1 Multi-device Multimedia Multimedia Multi-device Multi-device Multimedia Multimedia Multimedia Multimedia - 2 Multimedia Multi-device Multi-device Information Multimedia Multi-device Multi-device Multi-device Multi-device - 3 Information Information Information Multi-media Information Information Information Commun. Commun. - Preference
function
4 Commun. Commun. Commun. Commun. Commun. Commun. Commun. Information Information -
Produc
t
Preference type Function Smart Smart Simple Smart Smart Function Smart Smart -
Difference from average: *(p<0.1), **(p<0.05), ***(p<0.01)
the field of high-tech markets. As we mentioned, market segmentation methods based in customers’ general values allow us to understand customers’ value structures and to gain stable results of market segmentation. Despite the methodological advantages, these methods do not provide abundant information directly associated with a product. By contrast, product-specific benefit-based market segmentation methods offer considerable product-related information, but we should not expect to obtain better results with regard to the predictability and stability of the segments. Thus, the main objective of this study was to gain more abundant and predictable information on high-tech markets by considering both customer traits and product characteristics.
Based on our results, we expect that marketers, strategists, and product developers can practically apply the method to real market segmentation. Using our suggested method, users might be able to accurately forecast market changes. For
instance, if the target market is stable, they should establish simpler marketing strategies reflecting the current customer needs owing to a lesser possibility of market changes. For further study, we recommend the following to researchers interested in our new approach: 1) It is necessary for researchers to conduct more diverse case studies that can generally be applicable to high-tech markets; 2) They should also track the switching history of customers in each segment; Through this tracking analysis, they can predict what product customers wish to buy, what needs change and why, how their value structure changes, and so on. If further studies are elaborately conducted, taking into account the aforementioned two concerns, significant solutions can be developed for high-tech markets.
References
Product and Company Development, Chichester, UK: John Wiley
and Sons, 1990.
[2] E. Bridges, C.K. Yim, and R.A. Briesch, “A High-Tech Product Market Share Model with Customer Expectations,” Marketing
Sci., vol. 14, no. 1, 1995, pp. 61-81.
[3] W.H. Davidow, Marketing High Technology: An Insider’s View, New York: The Free Press, 1986.
[4] S. Dibb and L. Simkin, The Marketing Casebook, London: Routledge, 1994.
[5] R. Tamosaitis and L. Gargasaite, “Simulation of Virtual Time Norms for Technological Processes,” J. Business Econ. Manag., vol. 4, no. 4, 2003, pp. 235-240.
[6] D.Y. Koh and J.S. Lee, “Analysis of Consumers’ Choices and Time-Consumption Behaviors for Various Broadcasting and Telecommunication Convergence Services,” ETRI J., vol. 32, no. 2, Apr. 2010, pp. 302-311.
[7] H.R. Jeon et al., “User Adoption Model under Service Competitive Market Structure for Next-Generation Media Services,” ETRI J., vol. 33, no. 1, Feb. 2011, pp. 110-120.
[8] I.W. Seo, D.H. Lee, and B.W. Kim, “Market Efficiency Analysis between Facility-Based and Service-Based Competition,” ETRI J., vol. 30, no. 4, Aug. 2008, pp. 587-596.
[9] J. West and M. Mace, “Browsing as the Killer App: Explaining the Rapid Success of Apple’s iPhone,” Telecommun. Policy, vol. 34, 2010, pp. 270-286.
[10] E.H. Chamberlin, Theory of Monopolistic Competition, Cambridge, MA: Harvard University Press, 1933.
[11] J. Robinson, The Economics of Imperfect Competition, London: MacMillan, 1933.
[12] W. Smith, “Product Differentiation and Market Segmentation as Alternative Marketing Strategies,” J. Marketing, vol. 21, no. 1, July 1956, pp. 3-8.
[13] M. Wedel and W. Kamakura, Market Segmentation; Conceptual
and Methodological Foundations, 2nd ed., Boston: Kluwer
Academic Publishers, 2000.
[14] S. Dibb and L. Simkin, “Market Segmentation: Diagnosing and Treating the Barriers,” Ind. Marketing Manag., vol. 30, 2001, pp. 609-625.
[15] Y. Wind and R. Cardoza, “Industrial Market Segmentation,”
Harvard Business Rev., vol. 42, Mar.-Apr. 1974, pp. 83-90.
[16] B.S. Everitt, “Maximum Likelihood Estimation of the Parameters in a Mixture of Two Univariate Normal Distributions: A Comparison of Different Algorithms,” The Statistician, vol. 33, 1984, pp. 205-215.
[17] P. Vyncke, “Lifestyle Segmentation: From Attitudes, Interests and Opinions to Values, Aesthetic Styles, Life Visions and Media Preferences,” European J. Commun., vol. 17, Dec. 2002, pp. 445-463.
[18] C.R. Allred, S.M. Smith, and W.R. Swinyard, “E-Shopping Lovers and Fearful Conservatives: A Market Segmentation
Analysis,” Int. J. Retail Distrib. Manag., vol. 34, no. 4/5, 2006, pp. 308-333.
[19] A. Mitchell, The Nine American Life-styles, New York: Warner, 1983.
[20] W.L. Wilkie and J.B. Cohen, “An Overview of Market Segmentation: Behavioral Concepts and Research Approaches,” working paper, Cambridge, MA: Marketing Science Institute, 1977.
[21] B. Gunter and A. Furnham, Consumer Profiles: An Introduction to
Psychographics, London: Routledge, 1992.
[22] W.J. McDonald, “Home Shopping Channel Customer Segments: A Cross-Cultural Perspective,” J. Direct Marketing, vol. 9, no. 4, 1995, pp. 57-67.
[23] L.R. Kahle, S.E. Beatty, and P. Holmer, “Alternative Measurement Approaches to Consumer Values: The List of Values (LOV) and Values and Life Style (VALS),” J. Marketing Research, vol. 25, 1986, pp. 157-167.
[24] C. Hung and C.F. Tsai, “Market Segmentation Based on Hierarchical Self-Organizing Map for Markets of Multimedia on Demand,” Expert Syst. Appl., vol. 34, no. 1, 2008, pp. 780-787. [25] Y. Liu et al., “Multicriterion Market Segmentation: A New Model,
Implementation, and Evaluation,” Marketing Sci., vol. 29, no. 5, Sept. 2010, pp. 880-894.
[26] M. Cleveland, N. Papadopoulos, and M. Laroche, “Identity, Demographics, and Consumer Behaviors: International Market Segmentation across Product Categories,” Int. Marketing Rev., vol. 28, no. 3, 2011, pp. 244-266.
[27] A. Lemmens, C. Croux, and S. Stremersch, “Dynamics in the International Market Segmentation of New Product Growth,” Int.
J. Research Marketing, vol. 29, no. 1, 2012, pp. 81-92.
[28] W.A. Kamakura and T.P. Novak, “Value-System Segmentation: Exploring the Meaning of LOV,” J. Consumer Research, vol. 19, no. 1, June 1992, pp. 119-132.
[29] C. Mazzoni, L. Castaldi, and F. Addeo, “Consumer Behavior in the Italian Mobile Telecommunication Market,” Telecommun.
Policy, vol. 31, 2007, pp. 632-647.
[30] Q. Mu and K. Lee, “Knowledge Diffusion, Market Segmentation and Technological Catch-up: The Case of the Telecommunication Industry in China,” Research Policy, vol. 34, 2005, pp. 759-783. [31] H. Zhu et al., “Are Consumers What They Consume? – Linking
Lifestyle Segmentation to Product Attributes: An Exploratory Study of the Chinese Mobile Phone Market,” J. Marketing
Manag., vol. 25, no. 3-4, 2009, pp. 295-314.
[32] K.G. Grunert and S.C. Gunert, “Measuring Subjective Meaning Structures by the Laddering Method: Theoretical Considerations and Methodological Problems,” Int. J. Research in Marketing, vol. 12, 1995, pp. 209-225.
[33] R.J. Thomas and J. Gutman, “Laddering Theory, Method, Analysis, and Interpretation,” J. Advertising Research, vol. 28, no. 1, 1988, pp. 11-31.
[34] P. Vallette-Florence and B. Rapacchi, “Improvements in Means-End Chain Analysis Using Graph Theory and Correspondence Analysis,” J. Advertising Research, vol. 31, no. 1, 1991, pp. 30-45. [35] D.E. Vinson, J.E. Scott, and L.M. Lamont, “The Role of Personal Values in Marketing and Consumer Behavior,” J. Marketing, vol. 41, 1977, pp. 44-50.
[36] W.F. van Raaij and T.M. Verhallen, “Domain-Specific Market Segmentation,” European J. Marketing, vol. 28 no. 10, 1994, pp. 49-66.
[37] S. Young and B. Feigin, “Using the Benefit Chain for Improved Strategy Formulation,” J. Marketing, vol. 39, 1975, pp. 72-74. [38] J. Gutman, “A Means-End Chain Model Based on Consumer
Categorization Processes,” J. Marketing, vol. 46, no. 2, 1982, pp. 60-72.
[39] R.E. Burnkrant and H.R. Unnava, “Effects of Self-Referencing on Persuasion,” J. Consum. Research, vol. 22, no.1, June 1995, pp. 17-26.
[40] M. Rokeach, The Nature of Human Value, New York: Free Press, 1973.
[41] J.N. Sheth, B.I. Newman, and B.L. Gross, “Why We Buy What We Buy: A Theory of Consumption Values,” J. Business
Research, vol. 22, 1991, pp. 159-170.
[42] P.E. Green, “An AID/Logit Procedure for Analyzing Largen Multiway Contingency Tables,” J. Marketing Research, vol. 15, Feb. 1978, pp. 132-136.
[43] J. Magidson, TWCHAID Approach to Segmentation Modeling:
Chi Square Automatic Interaction Detector, Advanced Marketing Research, Cambridge, MA: Blackwell Publishing, 1994.
[44] M.S. Aldenderfer and R.K. Blashfield, Cluster Analysis, Newbury Park, CA: Sage Publications, Inc., 1984.
[45] D.A. Aaker, V. Kumar, and G.S. Day, Marketing Research, 5th ed., New York: John Wiley & Sons, Inc., 1995.
[46] G.A. Churchill Jr., Marketing Research: Methodological
Foundations, 5th ed., Chicago: The Dryden Press, 1991.
[47] C.C. Liu, “Mobile Phone User Types by Q Methodology: an Exploratory Research,” Int. J. Mobile Commun.,, vol. 6, no. 1, 2008, pp. 16-31.
[48] M.J. Rokeach, Belief, Attitudes and Values, San Francisco: Jossey Bass, 1968.
[49] G Kendall, Multivariate Analysis, London: Charles Griffin, 1975.
Yonghee Shin graduated from Sogang
University, Seoul, Rep. of Korea, in 1999 with a BBA and received his MS in IT business administration from the Korea Advanced Institute of Science and Technology (KAIST), Daejeon, Rep. of Korea, in 2001. Since 2001, he has worked at ETRI, Daejeon, Rep. of Korea, as a researcher. His major research interests include high-tech marketing, IT policy and strategy, management of technology, and new media
business models.
Hyori Jeon graduated from Handong
University, Pohang, Rep. of Korea, in 1999 with a BBA in economics. She received her MS in IT business administration in 2001 and PhD in management science in 2011, both from the Korea Advanced Institute of Science and Technology (KAIST), Daejeon, Rep. of Korea. She worked at ETRI for four years as a researcher. Since 2009, she has worked at the Research Planning Center at KAIST as a research assistant professor. Her major research interests include IT marketing, R&D management, high-tech marketing, and management of technology.
Munkee Choi graduated from Seoul National
University, Seoul, Rep. of Korea, in 1974 with a BS in applied mathematics, received his MS in Industrial Engineering from the Korea Advanced Institute of Science and Technology (KAIST), Daejeon, Rep. of Korea, in 1978, and received his PhD in operations research from North Carolina State University, Raleigh, North Carolina, USA, in 1989. He worked at ETRI, Daejeon, Rep. of Korea, for 21 years as a researcher and for three years as the president. Currently, he is a professor in the Management Science Department at KAIST. His major research interests include innovation systems, R&D management, technology commercialization, business on network, and new media business.
Eoksoo Han received his BBA, MS, and PhD
in business administration from Hannam University, Daejeon, Rep. of Korea, in 1987, 1993, and 1997, respectively. He has worked at ETRI, Daejeon, Rep. of Korea, for 15 years as a researcher. His major research interests include IT marketing, R&D management, and NPD.
Sungyoung Jung received his BS in economics
and PhD in institutional economics from Chonbuk National University, Jeonju, Rep. of Korea, in 1984 and 1998, respectively. He has worked for ETRI, Daejeon, Rep. of Korea, for 23 years in the area of IT policy, institutional infrastructure, business strategy of telecommunications companies, and national innovation systems.