Edited by: Ping Zhou, University of Texas Health Science Center at Houston, United States Reviewed by: Lining Zhang, PLA General Hospital, China Amanda Fang Lin, Rosalind Franklin University of Medicine and Science, United States *Correspondence: Li-Qun Zhang l-zhang@som.umaryland.edu
Specialty section: This article was submitted to Neurotrauma, a section of the journal Frontiers in Neurology Received: 28 June 2018 Accepted: 25 September 2018 Published: 26 October 2018 Citation: Wu Y-N, Park H-S, Chen J-J, Ren Y, Roth EJ and Zhang L-Q (2018) Position as Well as Velocity Dependence of Spasticity—Four-Dimensional Characterizations of Catch Angle. Front. Neurol. 9:863. doi: 10.3389/fneur.2018.00863
Position as Well as Velocity
Dependence of
Spasticity—Four-Dimensional
Characterizations of Catch Angle
Yi-Ning Wu1, Hyung-Soon Park2, Jia-Jin Chen3, Yupeng Ren4, Elliot J. Roth5andLi-Qun Zhang6,7*
1Department of Physical Therapy and Kinesiology, University of Massachusetts Lowell, Lowell, MA, United States, 2Department of Mechanical Engineering, Korean Advanced Institute of Science and Technology, Daejeon, South Korea, 3Department of Biomedical Engineering, National Cheng Kung University, Tainan, Taiwan,4Rehabtek LLC, Glenview, IL, United States,5Department of Physical Medicine and Rehabilitation, Northwestern University, Chicago, IL, United States, 6Department of Physical Therapy and Rehabilitation Science, Department of Orthopaedics, University of Maryland, Baltimore, MD, United States,7Department of Bioengineering, University of Maryland, College Park, MD, United States
We investigated the muscle alterations related to spasticity in stroke quantitatively using a portable manual spasticity evaluator.
Methods: Quantitative neuro-mechanical evaluations under controlled passive elbow stretches in stroke survivors and healthy controls were performed in a research laboratory of a rehabilitation hospital. Twelve stroke survivors and nine healthy controls participated in the study. Spasticity and catch angle were evaluated at 90◦/s and 270◦/s with the
velocities controlled through real-time audiovisual feedback. The elbow range of motion (ROM), stiffness, and energy loss were determined at a slow velocity of 30◦/s.
Four-dimensional measures including joint position, torque, velocity and torque change rate were analyzed jointly to determine the catch angle.
Results: The catch angle was dependent on the stretch velocity and occurred significantly later with increasing velocity (p < 0.001), indicating position dependence of spasticity. The higher resistance felt by the examiner at the higher velocity was also due to more extreme joint position (joint angle) since the spastic joint was moved significantly further to a stiffer elbow position with the higher velocity. Stroke survivors showed smaller ROM (p < 0.001), higher stiffness (p < 0.001), and larger energy loss (p = 0.005). Compared to the controls, stroke survivors showed increased reflex excitability with higher reflex-mediated torque (p < 0.001) and at higher velocities (p = 0.02).
Conclusion: Velocity dependence of spasticity is partially due to joint angle position dependence with the joint moved further (to a stiffer position where higher resistance was felt) at a higher velocity. The “4-dimensional characterization” including the joint angle, velocity, torque, and torque change rate provides a systematic tool to characterize catch angle and spasticity quantitatively.
INTRODUCTION
Spasticity commonly occurs to patients with neurological disorders, such as stroke, spinal cord injuries, cerebral palsy, and multiple sclerosis (1–3). Spasticity is commonly defined as “a motor disorder characterized by a velocity-dependent increase in tonic stretch reflexes (muscle tone) with exaggerated tendon jerks, resulting from hyperexcitability of the stretch reflex, as one component of the upper motor neuron syndrome” (4). Various measures have been used to assess muscle alterations associated with spasticity. In the clinical setting, spastic muscle is usually evaluated by grading the resistance to a passive stretch felt by a clinician using the Ashworth scale, modified Ashworth scale (MAS), and the Tardieu scale (5,6). The felt resistance could be caused by a combination of neural and peripheral origins (i.e., biomechanical factors such as soft tissues or muscle properties). Although clinical measures are convenient to use, they can be subjective, less sensitive and qualitative rather than quantitative to varying degrees. Previous studies raised questions about reliability of the MAS assessment of spasticity (7–10). On the other hand, the Tardieu scale has been suggested as an alternative to the MAS (6). Tardieu scale is conducted using various stretch velocities rather than using only one velocity in MAS while determining the angle where resistance felt (i.e., catch angle). It is argued that the MAS does not differentiate between spasticity and contracture, while the Tardieu scale is not confounded by the presence of contracture (11). However, with either scale, determinations of the catch angle (12,13) and range of motion (ROM) are influenced by stretch velocities and stretch force and subject to errors in reading the joint angle during assessments.
A quantitative assessment with controlled passive stretches is needed to improve the reliability of the clinical measures. Well-controlled quantitative measures, based on motorized mechanical perturbations and electrophysiological approaches, are mostly used in laboratory settings (5,14–16), but size and ease-of-use issues limit their applications in clinical settings (17–19). Several portable devices have also been developed and spasticity evaluations were performed by deriving viscous neuro-mechanical properties of the limb from passive movement kinematics and joint reaction torques (19–22). However, those measurements did not translate easily to the common clinical assessments of ROM and catch angle. Reflex threshold measured in joint angle during passive movement has been used effectively to evaluate spasticity by investigating the onset of muscle activation to applied disturbance (23–25).
In spite of the current development of spasticity quantification, in clinical setting thus far, clinicians evaluate spasticity based on how much resistance they feel as well as where they feel the reactive resistance while manipulating the joint quickly. The relation with regard to velocity dependence between stretch-induced muscle activation onset and the resistance (catch) felt by the clinicians in the stroke survivors has not been investigated thoroughly. Furthermore, it is not clear whether catch angle is also joint angle position dependent. In other words, whether joint angle might play a role in the increasing resistance felt by clinicians at a higher velocity and being judged as velocity-dependent spasticity is uncertain. A
comprehensive but simple way considering stretch velocities, reflex-mediated muscle torque and joint angle is needed to assist clinicians understand the muscle alteration due to neurological disorders and interventions. Therefore, the purpose of this study was to introduce an innovative and quantitative way to depict the spasticity according to the concept of Tardieu scale and further examined the contribution of joint angle position dependence to the catch felt by the examiner.
MATERIALS AND METHODS
Subjects
Twelve chronic stroke survivors (53.0 ± 8.5 years old, ten males and two females) who had a stroke more than 1 year (9.3 ± 5.6 years) and nine healthy controls (51.4 ± 24.9 years old, nine males) were included in this study. The stroke survivors with elbow flexors spasticity were recruited in the study. The subjects who had shoulder or elbow contractures were excluded from the participation. Table 1 depicts the characteristics of the stroke survivors. The healthy controls had no history of neurophysiologic or musculoskeletal disorders. The study was approved by the Institutional Review Board of Northwestern University. All subjects gave written informed consent before the experiment.
Instrumentation
The manual spasticity evaluator (MSE) used in this study was set up as a portable device to assess spastic muscles. A torque sensor (Transducer Techniques, CA, USA) and a hollow-shaft potentiometer (Vert-X51, Contelec AG, Switzerland) comprising MSE, were used to measure joint torques and joint positions respectively (26,27). Adjustable braces and supports were used to position the forearm and upper arm properly with respect to the MSE (Figure 1). Two mechanical stops were used to restrict the moving range of device that prevents over-stretching of the spastic joint. Biceps and triceps muscles activations were monitored using surface EMG electrodes (Bagnoli-8, Delsys Inc., Boston, USA). The torque, position and EMG signals were
TABLE 1 | Characteristics of subjects. Subject No. Gender Age (years) Years since the onset Hemiparetic side MAS Sbj1 M 60 10 R 2 Sbj2 M 38 9 R 2 Sbj3 M 62 6 R 1 Sbj4 M 38 7 R 1 Sbj5 M 57 9 R 1 Sbj6 M 58 26 L 3 Sbj7 M 53 9 R 3 Sbj8 M 50 6 R 3 Sbj9 M 70 2 L 1 Sbj10 F 54 9 R 3 Sbj11 F 48 12 R 2 Sbj12 M 48 6 R 3
FIGURE 1 | Experimental setup. The participant sat next to the MSE with 75◦
shoulder abduction. The participant’s upper arm and forearm were then strapped onto the supporting braces with the elbow flexion axis aligned with the MSE rotation axis. A torque sensor and a hollow-shaft potentiometer were used to measure the joint torque and joint position, respectively. Surface EMG electrodes were used to record EMG signals of biceps brachii and triceps brachii.
sampled at 1,000 Hz with a 16-bit resolution. A custom data acquisition program was used to provide real-time audio and visual feedback to help an examiner control the peak stretch velocity and the peak stretch torque (terminal torque) (26). When the examiner passively moved the subject’s forearm, the target velocity and torque profile with boundary lines (e.g., ±10% of target velocity or target torque), as well as the instantaneous joint velocity and torque were displayed on the monitor. At fast velocities (90◦/sec and 270◦/sec), the data acquisition program
provided audio feedback for controlling peak velocities during passive stretching. At the slow velocity of 30◦/sec, audio feedback was used to indicate that the designated torque limit had been reached and to stop the passive stretching. By doing so, the applied stretch force could be consistent while quantifying the spastic muscle each time.
A test-retest reliability investigation of the MSE was performed on the healthy controls by the same rater twice with 1 day apart. Excellent reproducibility was found in measures derived from fast stretching (ICC= 0.88) and from slow stretch (ICC= 0.89 for passive ROM, 0.84 for stiffness and 0.75 for energy loss). Excellent intra-rater reliability was also shown while using MSE in the pediatric population (28,29).
Experimental Procedures
In a quiet room, a therapist assessed the spastic elbows of the stroke survivors using MAS (30). The therapist followed the procedure described previously (31) with the exception of the body position. In the current study, the subjects sat upright comfortably instead of lying down. The therapist stabilized the upper arm by holding it proximal to the elbow and moved the forearm in a quick passive motion (∼1 sec) throughout the available elbow range of motion from the end of flexion to maximal extension.
During the experiment, the subject sat next to the MSE with the elbow flexion axis aligned with the rotation axis of the MSE. The shoulder was positioned at 75◦ of abduction and the
forearm and upper arm were secured to the supporting braces. Surface EMG electrodes were placed on the biceps brachii and triceps brachii with the reference electrode placed on the lateral epicondyle.
In the clinical practice, the modified Tardieu R1 is the angle of the catch thought to be due to induced stretch reflex at an as fast as possible velocity. The passive ROM (R2) is graded under a slow velocity, which would not trigger the stretch reflex (12). In the current study, we chose 30◦/sec as the slow velocity to measure R2 and chose two fast velocities (90 and 270◦/sec) to detect the catch angle (R1) using MSE. The slow velocity of 30◦/sec was chosen
because it did not induce stretch reflex during manual tests that may confound the R2 measurement. Two high velocities (90 and 270◦/sec) were chosen because 90◦(right angle) and its multiples
are relatively easier for the rater to perceive during manual tests. Initially, the torque and position offset were recorded with the subject’s elbow in the neutral position, defined as the position where subjects felt the most comfortable, not being stretched or restrained (79.6◦±10.9◦elbow flexion for stroke survivors, and
75.0◦±6.5◦elbow flexion for healthy controls with full extension defined as 0◦elbow flexion). To determine the passive ROM and stiffness of the elbow, we then moved the elbow at 30◦/sec until
reaching a pre-defined torque (3 Nm) or a mechanical stop. Three trials of passive stretch separated by 1 min were performed at each of 90◦/s and 270◦/sec to evaluate the velocity-dependence
of spasticity and catch angle. With practice, the examiner was able to control the peak velocity of passive stretch to match the target velocity as shown on the display (±10% of target velocity). One stretch cycle was defined from full flexion to full extension then back to full flexion. Since spasticity may be altered by repeated stretching (32), the elbow was not stretched more than three cycles in each trial. We also instructed the subjects relax during the tests. If voluntary muscle contractions to assist the stretch were detected by the examiner and shown as intermittent or continuous EMG activities of triceps brachii muscles, and/or EMG activities of the biceps brachii preceding the stretch initiation, the trial was discarded. The examiner would then let the subject rest before stretching the joint again.
The MAS scores, the biomechanical measures and MSE-measured R1 and R2 were taken by the same examiner.
Data Analysis and Statistics
Biomechanical Measurement: Torque and position signals were filtered with a low-pass cutoff frequency of 50 Hz. The derivative of torque with respect to time, dτ (t)/dt was calculated from the acquired torque signals. All the biomechanical measures captured at 30◦/sec were determined within the torque limits of 3 Nm, including the passive ROM [also described as the R2 angle (12)], elastic stiffness (K), energy loss, and elbow flexor torque at several joint angles. Stiffness, K, was defined as the slope of the torque-angle relationship of ascending arm at 70◦ of elbow flexion, a
common range among the subjects. The energy loss was the area between the ascending and descending limbs of the torque–angle curve during rotation (5). Since different subjects had different
ROMs and limb inertias, the energy loss was normalized by the transverse inertia and the individual’s range of motion. The transverse inertia was estimated from the length of the forearm, the perimeter of the elbow, and maximum forearm and wrist circumference (33, 34). Joint angle position dependence of the resistance torque was evaluated at three selected elbow flexion angles (45◦, 60◦, and 75◦) in the two groups and normalized by the body weight and height (35). The angles were near the end of stretch and around the common range (70◦).
EMG Signal Processing: The EMG signals were filtered with a passband of 10–450 Hz. To determine the onset of muscle activations (reflex-mediated responses) for verifying the catch angle, EMG signals were presented in a linear envelope (LE) form: with the filtered EMG data full-wave rectified and then low-pass filtered at 10 Hz. The onset of the reflex EMG was determined when the amplitude of the EMG LE was larger than the mean plus three standard deviations (SD) of the background EMG (36). The background EMG was measured during the quiescent period before the passive stretch. The elbow flexion angle corresponding to the reflex EMG onset was thus determined.
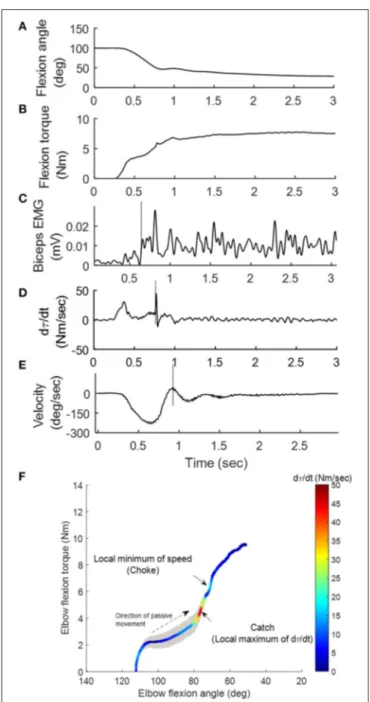
Catch Angle Determination and Characterization of spastic muscles: Catch angle is where a sudden occurrence of increased muscle activations in response to a quick passive stretch, which leads to an abrupt stop or increased resistance (torque) before the joint rotation reaches the end of ROM (37). This behavior can be captured using MSE as shown in Figure 2: the elbow flexor torque increased with elbow flexors being stretched (flexion angle decreased in Figures 2A,B). When the passive stretch triggered a stretch reflex (EMG firing shown in Figure 2C), the elbow flexors contracted strongly causing the abruptly increased torque rate (dτ (t)/dt) as indicated by the second positive peak in Figure 2D where the catch angle was determined. Figure 2E shows that the examiner responded to the abruptly increased resistance with a decreased velocity to avoid over-stretching the joint (value of velocity changed toward zero). We then developed a systematic way to determine R1. Since dτ (t)/dt was affected considerably by the inertia during the initial acceleration (the first peak of dτ (t)/dt), the local minimum of velocity was selected as the first landmark (the dashed vertical line in Figure 2E), which occurred shortly after the catch. Next, the joint angle corresponding to the peak dτ (t)/dt in the 300-ms window preceding this landmark was determined as the catch, R1 (26). The ratio R1/R2 was derived through dividing the angular displacement between R1 and flexion angle by the overall ROM, to represent the portion, which is free from the catch. A four-dimensional display, including the variables of joint angle, velocity, torque (τ ), and dτ (t)/dt, was developed to illustrate the events involved in the catch that provides a more comprehensive quantification of spastic muscles group around the tested joint (Figure 2F) at various stretch velocities. The width of the shaded area in Figure 2F represents velocity. Note the increased width as the high velocity was maintained. The torque increased as the elbow was moved into extension indicated by the dashed arrow. When a catch occurred, dτ (t)/dt increased abruptly and reached a local maximum (the relatively hot color of the dτ (t)/dt line). The abruptly increased resistance and the examiner’s reaction to the catch resulted in a
FIGURE 2 | Representative kinematic, kinetic and EMG signals during the passive stretch. As the elbow was moved from 100◦flexion to extension (A),
the elbow flexion torque τ (B) generated by the examiner on the stretched flexor muscles increased accordingly. Sequentially, the stretch induced a reflex response in the biceps (vertical line in C). The operator felt the sudden increase in resistance (vertical line in D) during the “catch,” and responded by decreasing the stretch velocity (vertical line in E). A four-dimensional display (F) was developed to illustrate the aforementioned events.
quick velocity reduction to a local minimum (choke, the narrow shaded area).
Statistics: Since the data was not normally distributed, non-parametric statistics (Friedman test) were used for comparisons of catch angles at different stretch velocities with a significance level of p < 0.05. To investigate differences in the biomechanical measures (ROM, stiffness, torque at three joint positions, energy
loss) and the velocity-dependent properties of muscle compared between the control and CVA groups, a Mann-Whitney U-test with a significance level of p < 0.05 was conducted. Spearman correlation was used for correlating the MAS with all biomechanical measures as well as the catch angle. Correlation was significant at p < 0.05. The intra-class correlation coefficient was chosen as the test statistic to evaluate the test-retest reliability. The two-way mixed model of intra-class correlation coefficient was used. An intra-class correlation coefficient ≥ 0.75 indicated significant reproducibility (38). SPSS software (SPSS Inc., Chicago, Illinois) was used to perform all statistical analysis.
RESULTS
4-D Characterization of Catch Angle
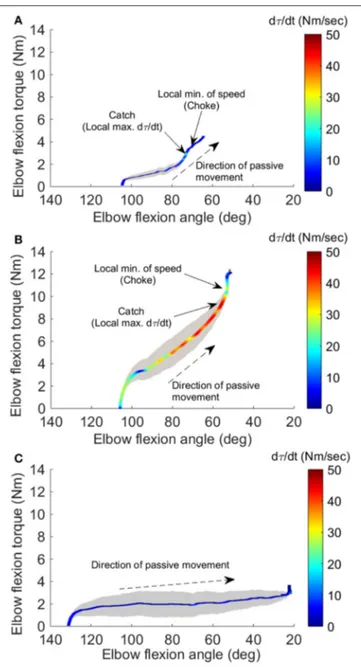
Figures 3A,B show the representative result of spasticity
and catch angle evaluations at velocity of 90◦/s and 270◦/s
respectively. Figure 3C shows the representative curve in a healthy control, the dτ (t)/dt remained at a constant lower value (below 10 Nm/s) throughout the available range of motion. In addition, for healthy controls the joint resistance was much lower when compared to stroke survivors (p < 0.05).
Dependence of R1 on Stretch Velocity and
Velocity-Dependent Properties of Spastic
Muscles
During the passive elbow extension, the catch angle in stoke survivors was significantly smaller (elbow more extended, p < 0.001) with increasing stretch velocity (Figure 4A). This indicates that the catch angle occurred later at faster stretch velocities. Furthermore, the R1/R2 was significantly higher at higher stretch velocities (Figure 4B, p < 0.001). As expected, catch was not observed in any healthy controls. In the representative case shown in Figures 3A,B, catch occurred at 78.2◦and 58.8◦elbow
flexion at the stretch velocities of 90◦/s and 270◦/s, respectively.
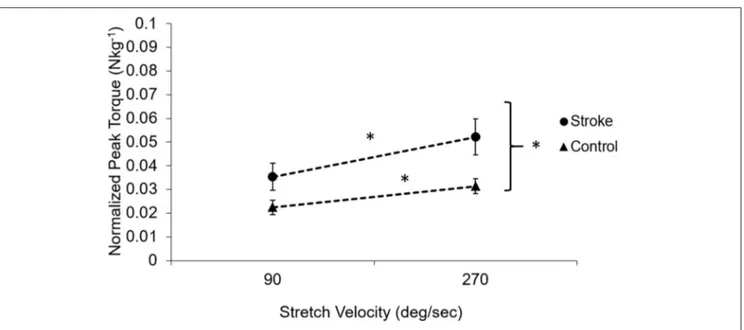
As a feature of spasticity, the peak resistance torque during a stretch increased with the increasing stretch velocity in the stroke survivors (p < 0.005, Figure 5). Healthy controls also showed increased peak resistance at the velocity of 270◦/s when
compared to the velocity of 90◦/s (p = 0.005). The slope of the
relationship between the peak torque and the stretch velocity was significantly higher in stroke (9.34 nu × 10−5 ±4 × 10⁻⁵ Nkg−1deg−1s) than that in healthy controls (4.99 × 10⁻⁵ ± 2.95 × 10⁻⁵Nkg−1deg−1s; p = 0.02).
Biomechanical Measures of the Spastic
Muscles
ROM measured at a controlled torque of 3 Nm was significantly reduced in the stroke survivors as compared to that of the healthy controls (74.2◦±21.5◦vs. 107.6◦±8.7◦, p < 0.001; Figure 6A). During extension with a 3 Nm torque limit, the stroke survivors stopped earlier at larger flexion angles (30.0◦±17.6◦) compared
to healthy controls (10.2◦±10.8◦; p < 0.01). Figure 7 shows the
examples of restricted ROMs for the severely spastic (MAS=3), mildly spastic (MAS=1) and healthy controls that were 36◦-93◦, 3◦-104◦, and −1◦-106◦elbow flexion, respectively.
FIGURE 3 | Four-dimensional characterization of the spastic muscles. Four variables: elbow flexion angle, elbow flexion torque, velocity, and torque change rate dτ (t)/dt, during the passive stretch were plotted simultaneously for a representative stroke survivor at 90◦/sec (A), at 270◦/sec (B), and a healthy
control at 270◦/sec (C). The X-axis and Y-axis correspond to the elbow flexion
angle and torque, respectively. The resistance torque generated by the stretched flexor muscles is positive. The dashed arrow indicates the direction of movement. Velocity is proportional to the width of the gray shaded area. The color of the line gives dτ (t)/dt, with the hot color (red) corresponding to a high rate of dτ (t)/dt. The two small arrows in (A) indicate the local maximum of dτ (t)/dt where the catch occurred and local minimum of velocity resulting from the examiner’s reaction to the abruptly increased torque, respectively.
Stiffness measured at a prescribed elbow flexion angle of 70◦
was significantly larger in stroke survivors when compared to healthy controls (Figure 6C; 0.058 ± 0.028 Nm/deg vs. 0.017 ± 0.008 Nm/deg, p < 0.001). The stiffness for the severely spastic, mildly spastic and healthy controls was 0.162 Nm/deg, 0.042
FIGURE 4 | Dependence of catch angle on the passive movement velocity. The catch angle (R1) and the ratio of the angular displacement between catch angle and initial flexion angle over ROM (R1/R2) with a controlled torque limit are shown in (A,B), respectively. Each symbol represents a stroke survivor. Friedman test was used for multiple comparisons of catch angles at different stretch velocities with a significance level of p < 0.05.
Nm/deg, and 0.014 Nm/deg respectively (Figure 7, slope of the lines).
Stroke survivors lost more energy (24.14 ± 8.07 Jdeg−1kg−1m−2) than healthy controls (12.66 ± 5.38 Jdeg−1kg−1m−2; p = 0.005; Figure 6B). In addition, stroke survivors showed higher torque compared to healthy controls at 45◦, 60◦, and 75◦ of elbow flexion (stroke vs. healthy: 0.0116 ±
0.001 Nkg−1vs. 0.0062 ± 0.0008 Nkg−1, 0.0088 ± 0.0031 Nkg−1
vs. 0.0045 ± 0.00084 Nkg−1, and 0.0069 ± 0.0021 Nkg−1 vs. 0.0035 ± 0.001 Nkg−1, respectively; Figure 6D).
Correlations Between the MAS, R1 and
Biomechanical Measures
Table 2 shows the correlations among the variables evaluated.
The catch angle showed significant correlations with ROM (r = −0.685, p = 0.014) and with energy loss (r = −0.679, p =0.047). The MAS showed significant correlations with ROM (r = −0.897, p = 0.001), as well as stiffness of the joint (r = 0.828, p = 0.006). Reflex-mediated EMG responses at different stretch velocities did not show any significant correlations with MAS, R1 or biomechanical measures (p > 0.05).
DISCUSSION
This study demonstrates 4-D plot, a comprehensive, and systematic way, to investigate the group of spastic muscles around the elbow. Spasticity-related biomechanical characteristics, including joint ROM, joint torque, stiffness and energy loss, at various controlled velocities can also be acquired at the same single setting. During a controlled slow stretch, the MSE assesses biomechanical properties of the joint including the ROM, stiffness and energy loss using a controlled slow stretch and determine the catch angle at controlled fast stretch velocities. Convenient spasticity quantification has been a challenge. In order to evaluate stretch reflex responses accurately, the way to elicit spasticity should be standardized. Many factors including the pre-activation of muscles, position of the joints involved, and applied stretch torque and velocity, as well as the experience of clinicians may result in different outcomes and interpretations. Clinical measures, such as the MAS or Tardieu scales, have been used to identify the catch angle during passive stretch. However, the angles determined using these scales may not be accurate; they generally occur later than a biomechanically-detected catch and suffer from poor inter-rater reliability (39). As shown in Figures 2, 3, the examiner reacted to the abruptly increased joint resistance by slowing or stopping the passive stretch. However, the catch occurred up to 300 ms prior to this slowing or stopping point. Therefore, peak dτ (t)/dt, instead of the stopping point, should be used as the indicator of the catch angle. In the current study, the instantaneous velocity change along with dτ (t)/dt were used to determine the catch angle reliably and to minimize potential human error. As one can see in Figures 2,
3, the human’s reaction characterized as local minimum of speed (choke) was further away from the catch determined by dτ (t)/dt. The discrepancy between human’s reaction and the true catch implies the potential human errors in the subjective clinical measures of “catch angle.” As seen in the examples in Figures 2,
3, the differences ranged from 3 to 8◦. In a clinical setting, the
catch angle reading is usually from eyeballing of a goniometer moving with the joint, which may introduce even a larger error in determining the catch angle. It should be noted that another peak of torque change rate, which occurred earlier during the passive stretch, was when an examiner overcame the resistance from the limb inertia and was not related to catch angle.
Velocity-dependent increase in muscle tone is a key attribute to spasticity as shown in the current study as well that the stretch velocity has obvious effects on the normalized peak torque of catch (larger slope in Figure 5). However, the velocity dependence of spasticity might be partially due to joint angle position dependence. The delayed catch angle associated with fast velocities in our study showed the joint angle position dependence of the increased resistance. At a faster stretch velocity, the joint was quickly stretched further into an angle position where higher resistance existed. Assuming reflex-mediated torque developed 60 ms after the stretch reflex was triggered, the joint would have been moved 10.8◦further in 60 ms
at 270◦/s as compared to the stretch at 90◦/s ((270◦/s-90◦/s) ×
0.06 s = 10.8◦). The extra 10.8◦ moved the joint to a stiffer position, which might make the examiner feel higher resistance at
FIGURE 5 | Velocity-dependent property of the muscle in subjects post-stroke (solid circles) and healthy controls (solid triangles). The dotted lines demonstrate the dependence on the velocity. Subjects post-stroke had a stronger velocity dependence compared to healthy controls (p = 0.02) and had higher torque at all velocities than healthy controls (p < 0.001). Asterisks (*) indicates significant differences between two velocities.
FIGURE 6 | Comparisons of passive properties of elbow flexors between the healthy controls (n = 9) and stroke survivors (n = 12). Patients post stroke showed reduced ROM (A), higher energy loss (B), increased stiffness (C), and increased resistance torque at several angles (D), represented as mean ± SE (standard error of mean). Asterisks (*) indicate significant difference (p < 0.05) between the two groups (D). Mann-Whitney U test with significance level of P < 0.05 was used to determine the differences.
a faster velocity. Similar results were reported that greater catch angles were associated with higher applied angular velocities (28,40). Velocity-dependence of the catch angle further confirms that a standardized method to evaluate spastic muscles is essential
since the interpretation of catch angle can be confounded by the stretch velocities.
In the current study, passive properties were measured under real-time feedback control by moving the elbow slowly without
TABLE 2 | Spearman correlation coefficient p (and p-value) between the parameters.
MAS R1 EMG ROM EL K
MAS ρ 1.000 p R1 ρ 0.539 1.000 p 0.054 EMG ρ −0.223 0.405 1.000 p 0.282 0.160 ROM ρ −0.897** −0.685* 0.050 1.000 p 0.001 0.014 0.449 EL ρ 0.091 0.679* 0.086 −0.067 1.000 p 0.408 0.047 0.436 0.432 K ρ 0.828** 0.613 −0.319 −0.934** −0.371 1.000 p 0.006 0.072 0.269 0.001 0.234
MAS, modified Ashworth Scale; R1, catch angle; EMG, electromyography onset; EL, energy loss; K, stiffness.*indicates P < 0.05**indicates P < 0.01.
eliciting a reflex response. The lack of a reflex response was corroborated by silence in the EMG signals of the stretched muscle. Significant changes in the passive properties of the spastic elbow of stroke survivors were observed when compared to healthy controls, including increased stiffness and flexors resistance, decreased ROM, and increased energy loss (Figure 6). Similar changes were also found in the spastic ankle of stroke survivors with hemiparesis (5). In general, the changes in stiffness and ROM were consistent with what have been reported previously (14,41,42). Since the supporting braces fixed to the MSE might hinder the ROM near the end of flexion, the value of elbow ROM shown in current study was smaller than the observations in previous studies (43–45). In addition, Figure 7 also shows that the reduced ROM was not only in one end, the stroke survivors may lose the range toward flexion or extension that can be relevant to daily functions.
The correlation between passive stiffness and MAS demonstrates that the MAS is more closely related to the passive stiffness of the joint than to joint spasticity, even though it has been commonly used for assessing spasticity in both clinical and laboratory settings. MAS only includes as single stretch velocity and is scored by the amplitude of joint resistance that potentially make MAS reflect passive stiffness over spasticity. Because the felt joint resistance could be from either spastic responses and/or passive stiffness (46, 47) and without various stretch velocities those could not be distinguished. The consequence of this ambiguous assessment may mislabel patients who have increased passive stiffness alone as having spasticity and being treated with inappropriate interventions. Damiano et al. indicated that evaluating patients at different velocities may help to distinguish passive stiffness from spasticity (46), which we adopted in our developed method for spasticity quantification. Administering the Tardieu scale using the MSE could provide proper spasticity characterization under various controlled velocities. The intra-rater reliability of clinical assessments can be improved using the MSE that contains accurate sensors and
FIGURE 7 | Representative torque-angle curves of stroke survivors [mild (B) and severe (C)] and a healthy control (A). Full elbow extension = 0◦. The slope
of the thick black lines indicates the elastic stiffness of the elbow recorded at a common angle.
provides real-time audiovisual feedback instead of the examiner’s subjective manipulation and scoring.
LIMITATIONS OF THE STUDY
The brace of the system we used might prevent the all range of motion toward the end of flexion due to the contact of muscle bulks and brace. When there was no compromise using this system to assess the elbow flexors spasticity, one should interpret the passive flexion ROM with cautions. The sample size of the current study is relatively small. A larger size of sample should be considered in a future study.
ETHICS STATEMENT
This study was carried out in accordance with the recommendations of Northwestern University Institutional Review Board with written informed consent from all subjects. All subjects gave written informed consent in accordance with
the Declaration of Helsinki. The protocol was approved by the Northwestern University Institutional Review Board.
AUTHOR CONTRIBUTIONS
Y-NW, L-QZ, H-SP, and YR designed and carried out the experiment. Y-NW and L-QZ performed the data analysis.
Y-NW, H-SP, YR, and L-QZ wrote the manuscript with support from J-JC and ER.
FUNDING
This work was supported in part by grants from the NSF (award no. IIP-0750515) and NIH (award no. R01-HD044295).
REFERENCES
1. Brown P. Pathophysiology of spasticity. J Neurol Neurosurg Psychiatry (1994) 57:773–7. doi: 10.1136/jnnp.57.7.773
2. Rymer WZ, Katz RT. Mechanical quantification of spastic hypertonia. Phys Med Rehabil State Art Rev. (1994) 8:455–63.
3. Sheean GL, Murray NM, Rothwell JC, Miller DH, Thompson AJ. An electrophysiological study of the mechanism of fatigue in multiple sclerosis. Brain (1997) 120 (Pt 2):299–315. doi: 10.1093/brain/120.2.299
4. Lance JW. Symposium synopsis. In: Feldman R. G, Young R. R, Koella W. P, editors. Chicago: Yearbook Meidcal (1980). p. 485–94.
5. Chung SG, Van Rey E, Bai Z, Roth EJ, Zhang LQ. Biomechanic changes in passive properties of hemiplegic ankles with spastic hypertonia. Arch Phys Med Rehabil. (2004) 85:1638–46. doi: 10.1016/j.apmr.2003.11.041
6. Haugh AB, Pandyan AD, Johnson GR. A systematic review of the Tardieu Scale for the measurement of spasticity. Disabil Rehabil. (2006) 28:899–907. doi: 10.1080/09638280500404305
7. Pandyan AD, Johnson GR, Price CI, Curless RH, Barnes MP, Rodgers H. A review of the properties and limitations of the Ashworth and modified Ashworth Scales as measures of spasticity. Clin Rehabil. (1999) 13:373–83. doi: 10.1191/026921599677595404
8. Bakheit AM, Maynard VA, Curnow J, Hudson N, Kodapala S. The relation between Ashworth scale scores and the excitability of the alpha motor neurones in patients with post-stroke muscle spasticity. J Neurol Neurosurg Psychiatry (2003) 74:646–8. doi: 10.1136/jnnp.74.5.646
9. Cooper A, Musa IM, van Deursen R, Wiles CM. Electromyography characterization of stretch responses in hemiparetic stroke patients and their relationship with the Modified Ashworth scale. Clin Rehabil. (2005) 19:760–6. doi: 10.1191/0269215505cr888oa
10. Kumar RT, Pandyan AD, Sharma AK. Biomechanical measurement of post-stroke spasticity. Age Ageing (2006) 35:371–5. doi: 10.1093/ageing/ afj084
11. Patrick E, Ada L. The Tardieu Scale differentiates contracture from spasticity whereas the Ashworth Scale is confounded by it. Clin Rehabil. (2006) 20:173– 82. doi: 10.1191/0269215506cr922oa
12. Boyd R, Graham HK. Objective measurement of clinical findings in the use of botulinum toxin type A for the management of children with CP. Eur J Neurol. (1999) 6:S23–35. doi: 10.1111/j.1468-1331.1999.tb00031.x
13. Mehrholz J, Wagner K, Meissner D, Grundmann K, Zange C, Koch R, et al. Reliability of the modified Tardieu Scale and the modified Ashworth Scale in adult patients with severe brain injury: a comparison study. Clin Rehabil. (2005) 19:751–9. doi: 10.1191/0269215505cr889oa
14. Dietz V, Trippel M, Berger W. Reflex activity and muscle tone during elbow movements in patients with spastic paresis. Ann Neurol. (1991) 30:767–79. doi: 10.1002/ana.410300605
15. Lee HM, Huang YZ, Chen JJ, Hwang IS. Quantitative analysis of the velocity related pathophysiology of spasticity and rigidity in the elbow flexors. J Neurol Neurosurg Psychiatry (2002) 72:621–9. doi: 10.1136/jnnp.72.5.621
16. Condliffe EG, Clark DJ, Patten C. Reliability of elbow stretch reflex assessment in chronic post-stroke hemiparesis. Clin Neurophysiol. (2005) 116:1870–8. doi: 10.1016/j.clinph.2005.02.030
17. Given JD, Dewald JPA, Rymer WZ. Joint dependent passive stiffness in paretic and contralateral limbs of spastic patients with hemiparetic stroke. J Neurol Neurosurg Psychiat. (1995) 59:271–9. doi: 10.1136/jnnp.59.3.271
18. Schmit BD, Dhaher Y, Dewald JPA, Rymer WZ. Reflex torque response to movement of the spastic elbow: theoretical analyses and implications
for quantification of spasticity. Ann Biomed Eng. (1999) 27:815–29. doi: 10.1114/1.234
19. Lee HM, Chen JJ, Ju MS, Lin CC, Poon PP. Validation of portable muscle tone measurement device for quantifying velocity-dependent properties in elbow spasticity. J Electromyogr Kinesiol. (2004) 14:577–89. doi: 10.1016/j.jelekin.2004.02.002
20. Zhang L-Q, Wang G, Nishida T, Xu D, Sliwa JA, Rymer WZ. Hyperactive tendon reflexes in spastic multiple sclerosis: measures and mechanisms of action. Arch Phys Med Rehab. (2000) 81:901–9. doi: 10.1053/apmr.20 00.5582
21. Zhang LQ, Chung SG, Bai Z, Xu D, van Rey EM, Rogers MW, et al. Intelligent stretching of ankle joints with contracture/spasticity. IEEE Trans Neural Syst Rehabil Eng. (2002) 10:149–57. doi: 10.1109/TNSRE.2002.802857
22. Chen JJ, Wu YN, Huang SC, Lee HM, Wang YL. The use of a portable muscle tone measurement device to measure the effects of botulinum toxin type a on elbow flexor spasticity. Arch Phys Med Rehabil. (2005) 86:1655–60. doi: 10.1016/j.apmr.2005.03.019
23. Levin MF, Selles RW, Verheul MH, Meijer OG. Deficits in the coordination of agonist and antagonist muscles in stroke patients: implications for normal motor control. Brain Res. (2000) 853:352–69. doi: 10.1016/S0006-8993(99)02298-2
24. Allison SC, Abraham LD. Sensitivity of qualitative and quantitative spasticity measures to clinical treatment with cryotherapy. Int J Rehabil Res. (2001) 24:15–24. doi: 10.1097/00004356-200103000-00003
25. Calota A, Feldman AG, Levin MF. Spasticity measurement based on tonic stretch reflex threshold in stroke using a portable device. Clin Neurophysiol. (2008) 119:2329–37. doi: 10.1016/j.clinph.2008.07.215
26. Peng Q, Shah P, Selles RW, Gaebler-Spira DJ, Zhang LQ. Measurement of ankle spasticity in children with cerebral palsy using a manual spasticity evaluator. Conf Proc IEEE Eng Med Bi.ol Soc (2004) 7:4896–9. doi: 10.1109/IEMBS.2004.1404354
27. Park HS, Peng Q, Zhang LQ. A portable tele-assessment system for remote evaluations of impaired elbows in neurological disorders. IEEE Trans Neural Syst Rehabil Eng. (2008) 16:245–54. doi: 10.1109/TNSRE.2008.920067 28. Wu YN, Ren Y, Goldsmith A, Gaebler D, Liu SQ, Zhang LQ. Characterization
of spasticity in cerebral palsy: dependence of catch angle on velocity. Dev Med Child Neurol. (2010) 52:563–9. doi: 10.1111/j.1469-8749.2009. 03602.x
29. Peng Q, Park HS, Shah P, Wilson N, Ren Y, Wu YN, et al. Quantitative evaluations of ankle spasticity and stiffness in neurological disorders using manual spasticity evaluator. J Rehabil Res Dev. (2011) 48:473–81. doi: 10.1682/JRRD.2010.04.0053
30. Bohannon RW, Smith MB. Interrater reliability of a modified Ashworth scale of muscle spasticity. Phys Ther. (1987) 67:206–7. doi: 10.1093/ptj/67.2.206 31. Gregson JM, Leathley M, Moore AP, Sharma AK, Smith TL, Watkins CL.
Reliability of the Tone Assessment Scale and the modified Ashworth scale as clinical tools for assessing poststroke spasticity. Arch Phys Med Rehabil. (1999) 80:1013–6. doi: 10.1016/S0003-9993(99)90053-9
32. Nuyens GE, De Weerdt WJ, Spaepen AJ Jr, Kiekens C, Feys HM. Reduction of spastic hypertonia during repeated passive knee movements in stroke patients. Arch Phys Med Rehabil. (2002) 83:930–5. doi: 10.1053/apmr.2002.33233 33. Hinrichs RN. Regression equations to predict segmental moments of inertia
from anthropometric measurements: an extension of the data of Chandler et al. (1975). J Biomech. (1985) 18:621–4. doi: 10.1016/0021-9290(85)90016-8 34. Challis JH, Kerwin DG. Calculating upper limb inertial parameters. J Sports
35. Kang SH, Lee SJ, Ren Y, Zhang LQ. Real-time knee adduction moment feedback training using an elliptical trainer. IEEE Trans Neural Syst Rehabil Eng. (2014) 22:334–43. doi: 10.1109/TNSRE.2013.2291203
36. Di Fabio RP. Reliability of computerized surface electromyography for determining the onset of muscle activity. Phys Ther. (1987) 67:43–8. doi: 10.1093/ptj/67.1.43
37. Scholtes VA, Becher JG, Beelen A, Lankhorst GJ. Clinical assessment of spasticity in children with cerebral palsy: a critical review of available instruments. Dev Med Child Neurol. (2006) 48:64–73. doi: 10.1017/S0012162206000132
38. Rosner B. Fundamentals of Biostatistics. Duxbury, MA (1999).
39. Johnson GR. Outcome measures of spasticity. Eur J Neurol. (2002) 9 (Suppl. 1):10–16. doi: 10.1046/j.1468-1331.2002.0090s1010.x
40. Mackey AH, Walt SE, Lobb G, Stott NS. Intraobserver reliability of the modified Tardieu scale in the upper limb of children with hemiplegia. Dev Med Child Neurol. (2004) 46:267–72. doi: 10.1111/j.1469-8749.2004. tb00481.x
41. Dietz V, Berger W. Normal and impaired regulation of muscle stiffness in gait: a new hypothesis about muscle hypertonia. Exp Neurol. (1983) 79:680–7. doi: 10.1016/0014-4886(83)90032-8
42. Lee WA, Boughton A, Rymer WZ. Absence of stretch reflex gain enhancement in voluntarily activated spastic muscle. Exp Neurol. (1987) 98:317–35. doi: 10.1016/0014-4886(87)90245-7
43. Allander E, Bjornsson OJ, Olafsson O, Sigfusson N, Thorsteinsson J. Normal range of joint movements in shoulder, hip, wrist and thumb with special reference to side: a comparison between two populations. Int J Epidemiol. (1974) 3:253–61. doi: 10.1093/ije/3.3.253
44. Ahlberg A, Moussa M, Al-Nahdi M. On geographical variations in the normal range of joint motion. Clin Orthop Relat Res. (1988) 234:229–31. doi: 10.1097/00003086-198809000-00040
45. Gunal I, Kose N, Erdogan O, Gokturk E, Seber S. Normal range of motion of the joints of the upper extremity in male subjects, with special reference to side. J Bone Joint Surg Am. (1996) 78:1401–4. doi: 10.2106/00004623-199609000-00017
46. Damiano DL, Quinlivan JM, Owen BF, Payne P, Nelson KC, Abel MF. What does the Ashworth scale really measure and are instrumented measures more valid and precise? Dev Med Child Neurol. (2002) 44:112–8. doi: 10.1017/S0012162201001761
47. Singer BJ, Dunne JW, Singer KP, Allison GT. Velocity dependent passive plantarflexor resistive torque in patients with acquired brain injury. Clin Biomech. (2003) 18:157–65. doi: 10.1016/S0268-0033(02) 00173-0
Conflict of Interest Statement: The authors declare that the research was conducted in the absence of any commercial or financial relationships that could be construed as a potential conflict of interest.
Copyright © 2018 Wu, Park, Chen, Ren, Roth and Zhang. This is an open-access article distributed under the terms of the Creative Commons Attribution License (CC BY). The use, distribution or reproduction in other forums is permitted, provided the original author(s) and the copyright owner(s) are credited and that the original publication in this journal is cited, in accordance with accepted academic practice. No use, distribution or reproduction is permitted which does not comply with these terms.


![FIGURE 7 | Representative torque-angle curves of stroke survivors [mild (B) and severe (C)] and a healthy control (A)](https://thumb-ap.123doks.com/thumbv2/123dokinfo/5084995.75410/8.892.67.439.127.380/figure-representative-torque-curves-stroke-survivors-healthy-control.webp)
