Brain and Behavior. 2017;7:e00766.
|
1 of 9 https://doi.org/10.1002/brb3.766wileyonlinelibrary.com/journal/brb3 O R I G I N A L R E S E A R C H
Predicting neurocognitive function with hippocampal volumes
and DTI metrics in patients with Alzheimer’s dementia and mild
cognitive impairment
Geumsook Shim
1* | Kwang-Yeon Choi
2* | Dohyun Kim
3,4| Sang-il Suh
5| Suji Lee
6|
Hyun-Ghang Jeong
2,6| Bumseok Jeong
1,3,4This is an open access article under the terms of the Creative Commons Attribution License, which permits use, distribution and reproduction in any medium, provided the original work is properly cited.
© 2017 The Authors. Brain and Behavior published by Wiley Periodicals, Inc. *These authors contributed equally to this work.
1KAIST Clinic Pappalardo Center, KAIST, Daejeon, Korea 2Department of Psychiatry, Korea University College of Medicine, Seoul, Korea 3Computational Affective Neuroscience and Development Laboratory, KAIST, Graduate School of Medical Science and Engineering, Daejeon, Korea 4KAIST Institute for Health Science and Technology, KAIST, Daejeon, Korea 5Department of Radiology, Korea University Guro Hospital, Korea University College of Medicine, Seoul, Korea 6Department of Biomedical Sciences, Korea University Graduate School, Seoul, Korea Correspondence Hyun-Ghang Jeong, Department of Psychiatry, Korea University College of Medicine, Guro Hospital, Seoul, Korea. Email: [email protected] Bumseok Jeong, Korea Advanced Institute of Science and Technology (KAIST), Graduate School of Medical Science and Engineering, Daejeon, Korea. Email: [email protected] Funding information Korea Health Technology R&D Project; Korea Health Industry Development Institute (KHIDI); Ministry of Health & Welfare, Republic of Korea, Grant/Award Number: HC15C1509; Brain Research Program through the National Research Foundation of Korea (NRF); Ministry of Science, ICT & Future Planning, Grant/Award Number: NRF-2016M3C7A1914448
Abstract
Introduction: Cognitive performance in patients with Alzheimer’s dementia (AD) and mild cognitive impairment (MCI) has been reported to be related to hippocampal atro- phy and microstructural changes in white matter (WM). We aimed to predict the neu-rocognitive functions of patients with MCI or AD using hippocampal volumes and diffusion tensor imaging (DTI) metrics via partial least squares regression (PLSR).Methods: A total of 148 elderly female subjects were included: AD (n = 49), MCI
(n = 66), and healthy controls (n = 33). Twenty- four hippocampal subfield volumes and the average values for fractional anisotropy (FA) and mean diffusivity (MD) of 48 WM tracts were used as predictors, CERAD- K total scores, scores of CERAD- K 7 cognitive subdomains and K- GDS were used as dependent variables in PLSR. Results: Regarding MCI patients, DTI metrics such as the MD values of the left retro- lenticular part of the internal capsule and left fornix (cres)/stria terminalis were signifi-cant predictors, while hippocampal subfield volumes, like the left CA1 and hippocampal tail, were main contributors to cognitive function in AD patients, although global FA/MD values were also strong predictors. The 10- fold cross- validation and stricter 300- iteration tests proved that global cognition measured by the CERAD- K total scores and the scores of several CERAD- K subdomains can be reliably predicted using the PLSR models.
Conclusions: Our findings indicate different structural contributions to cognitive
func-tion in MCI and AD patients, implying that diffuse WM microstructural changes may precede hippocampal atrophy during the AD neurodegenerative process.
K E Y W O R D S
Alzheimer’s dementia, diffusion tensor imaging, hippocampal volume, mild cognitive impairment, partial least squares regression
1 | INTRODUCTION
Alzheimer’s dementia (AD) usually progresses slowly for a decade or more before a diagnosis of dementia, and a mild cognitive impairment (MCI) is proposed to capture the prodromal stages of various etiol-ogies of dementia, including AD. To date, molecular, functional, and structural biomarkers have been developed to accurately diagnose AD (Ishii, 2014) and to predict conversion from MCI to AD at an early time (Forlenza, Diniz, Teixeira, Stella, & Gattaz, 2013). Among these biomarkers, structural MRI is indispensable, and atrophy of the medial temporal lobe including the hippocampus is considered as a valid di-agnostic marker (Frisoni, Fox, Jack, Scheltens, & Thompson, 2010) and as a risk factor of conversion to AD (Grundman et al., 2002). A link be-tween the hippocampal volume and cognitive function, such as verbal memory and language, has been reported in AD, amnestic MCI, and the normal elderly population (Chetelat et al., 2003; Petersen et al., 2000), and hippocampal atrophy is generally accepted as being cor-related with cognitive performance in AD.
Compared to hippocampal atrophy, white matter (WM) alter-ations have not received much attention until recently, since cog-nitive performance has been considered to be associated with gray matter atrophy rather than with WM alterations (Grundman et al., 2002; Loewenstein et al., 2009). However, a recent meta- analysis of diffusion tensor imaging (DTI) revealed that microstructural alter-ations in WM in MCI and AD are widespread throughout the brain (Sexton, Kalu, Filippini, Mackay, & Ebmeier, 2011), particularly in limbic fibers connected directly to the medial temporal lobe (Salat et al., 2010). Subtle impairments in nonmemory performance in MCI patients are postulated to be mainly related to pathology outside the hippocampus (Grundman et al., 2003), and disruption of para-hippocampal WM fibers contributes to memory decline by partially disconnecting the hippocampus from incoming sensory information (Stoub et al., 2006).
Two main diffusion metrics are generally calculated from DTI data: fractional anisotropy (FA) and mean diffusivity (MD). FA and MD mea-sure the directional dominance and overall degree of water diffusion in tissue, respectively. FA is generally interpreted as reflecting the den-sity of nerve fibers and their myelin sheaths (Beaulieu, 2002), while MD reflects the breakdown of tissue cytoarchitecture and demyelin- ating process (Le Bihan & Johansen- Berg, 2012). Aging and WM neu-ropathology often result in a decrease in anisotropy, and age- related FA decline is correlated with slower responses in the visual task (Lebel et al., 2012; Madden et al., 2004).
In the hypothetical model of dynamic biomarkers related to the AD pathological cascade, the production of soluble amyloid beta (Aβ) oligomers, which can directly injure WM integrity (Lee et al., 2004; Roth, Ramirez, Alarcon, & Von Bernhardi, 2005), happens first, and neurodegenerative biomarkers such as cerebral atrophy, synaptic dysfunction, and cognitive symptoms are manifested later (Jack et al., 2010). According to the neurovascular hypothesis of AD, vascular- derived insults are considered to initiate neuronal degeneration. That is, cerebral hypoxia and blood–brain barrier leakage, caused by the vascular risk factors lead to the accumulation of neurotoxic molecules
and WM micro- injury (Zlokovic, 2011). Vascular injury also hampers the normal clearance of Aβ, leading to the accelerated accumulation of Aβ. Therefore, microstructural changes in WM can be a good bio- marker for both early diagnosis of AD and to monitor disease progres-sion (Oishi & Lyketsos, 2016). Several researches have reported that DTI metrics are associated with several domains of cognitive function in patients with MCI or AD. Mielke and colleagues (Mielke et al., 2012) found that fornix FA is correlated with cross- sectional memory and predicts memory decline in MCI patients. In studies using linear regression analysis, parietal or temporal lobe FA values and the mean MD values from cinguli were significant predictors for global cognition or episodic memory of am-nestic MCI and AD (Bozzali et al., 2012; Wang et al., 2013). However, above- mentioned studies extracted DTI measures from a priori se- lected brain areas such as fornix and cinguli, and examined the pre-dictability using linear regression analysis or multivariate model. In a multiple regression model, collinearity, a phenomenon in which two or more predictors are highly correlated, can affect the calculations for individual predictors and distort the interpretation of a model (Tu, Kellett, Clerehugh, & Gilthorpe, 2005; Wold, Ruhe, Wold, & Dunn, 1984). Unfortunately, variables from neuroimaging data are usually quite numerous and are likely to be collinear.
Partial least squares regression (PLSR) combines features from and generalizes principal component analysis and multiple linear re-gression (Abdi, 2010), and it is particularly useful when we need to predict a set of dependent variables from numerous, highly collinear independent variables or predictors (Tobias, 1995). This prediction is achieved by extracting a set of orthogonal factors from the predictors (i.e., latent variables, LVs) explaining the covariance between predic-tors and dependent variables as much as possible with the best pre-dictive power (Abdi, 2010). In this study, we aimed to predict neurocognitive functions of pa-tients with MCI or AD using hippocampal volumes and DTI metrics with PLSR. We hypothesized that several variables among hippocam- pal subfield volumes and DTI metrics, such as FA and MD, might sig-nificantly contribute to the cognitive functions of both patients, but DTI measures might be more predictive for cognitive function in MCI patients compared to AD patients since microstructural changes in WM were considered to precede hippocampal atrophy.
2 | METHODS
2.1 | Subjects and imaging data
The potential patients were recruited from the Psychiatric Department, Korea University Guro Hospital, and control subjects were sought from the community population via an advertisement. All subjects received a Korean version of the Consortium to Establish a Registry for AD Assessment Packet (CERAD- K) (Lee et al., 2002), Korean Geriatric Depression Scales (K- GDS) (Bae & Cho, 2004), the Korean version of the Clinical Dementia Rating (CDR) scale (Choi et al., 2001). The CERAD Neuropsychological Battery (CERAD- NB) was devel-oped as a reliable, standardized battery to measure primary cognitive
manifestations of AD (Morris et al., 1989). The original CERAD- NB included five cognitive tests: Verbal Fluency, 15- item Boston Naming Test, Mini- Mental State Examination (MMSE), 10- item Word List Learning, Recall and Recognition Test, and Constructional Praxis and Constructional Recall. The CERAD total score was calculated as the sum of the scores of CERAD subdomains except for MMSE and Constructional Recall, as previously described (Chandler et al., 2005).
The AD diagnosis was made based on the criteria for probable or possible AD, developed by the National Institute of Neurological and Communicative Disorders and Stroke and the Alzheimer’s Disease and Related Disorders Association (NINCDS- ADRDA)(McKhann et al., 1984). Individuals were categorized as MCI based on the cri-teria proposed by Peterson and colleagues (Petersen et al., 1999). Healthy controls (HCs) met the following criteria: a MMSE score >−1.5 SD (adjusted for age, sex, and educational years) and no objec-tive cognitive impairment (all scores of CERAD- K cognitive domains >−1.5 SD).
2.2 | MRI image acquisition
All subjects underwent an MRI examination at the Brain Imaging Center, Korea University. Multiple diffusion- weighted images, with 20 encoding directions and an additional T2- weighted scan, were acquired twice at a single- scan session using a 3.0- T Siemens Trio Tim scanner with a standard single- shot, spin echo, echo planar ac-quisition sequence with eddy current balanced diffusion weight-ing gradient pulses to reduce distortion (Reese, Heid, Weisskoff, & Wedeen, 2003). The scan parameters were: b = 1000 s/mm2,
TE/TR = 84 ms/6.3 s; matrix = 128 × 128 on 230 × 230 mm FOV; 3- mm slices without a gap resulting in voxels of 1.8 × 1.8 × 3.0 mm. Four magnitude averages provided sufficient signal- to- noise ratios. Volumetric T1- weighted anatomic reference images were acquired using a magnetization- prepared rapid gradient echo sequence (TE/TR/TI = 2.60 ms/1.9 s/900 ms; 256 × 256 × 176 matrix for 0.86 × 0.86 × 1 mm voxels). A total of 60 AD patients, 93 MCI patients, and 48 HCs partici-pated in the MRI examination, and the gender ratios were as follows: (F:M) AD 49:11, MCI 66:27, HCs 33:15. After considering significant differences between the genders in the total intracranial volume (ICV) (F, 1319 ± 103; M, 1512 ± 110, t- value = −11.51, p < .001) and a rel-atively small proportion of male subjects (26%), only female subjects were included into this study.
2.3 | Image preprocessing: hippocampal
subfield volumes
Individually, 24 hippocampal subfields were automatically segmented on the T1- weighted images using Freesurfer v6.0 (Iglesias et al., 2015), which provides volumes for Cornu Ammonis (CA) regions 1, 2 and 3 combined, and 4 (CA1, CA2/3, and CA4), fimbria, hippocampal fissure, presubiculum, subiculum, hippocampal tail, parasubiculum, granule cell layer- molecular layer- dentate gyrus (GC- ML- DG), molecular layer, and the hippocampus- amygdala- transition- area (HATA).
2.4 | Image preprocessing: DTI metrics
Preprocessing for DTI analysis, including skull stripping and Eddy cur-rent correction, was performed using the FMRIB Software Library (FSL; Oxford, UK; http://www.fmrib.ox.ac.uk/fsl). A diffusion tensor model was arranged for each voxel with the generation of FA and MD images using FMRIB’s diffusion toolbox in FSL. The Tract- Based Spatial Statistics (TBSS) pipeline was used to identify a common reg- istration target, and all subjects’ FA images were aligned to this tar-get using nonlinear registration. The aligned FA images were affine transformed into 1.0 × 1.0 × 1.0 mm3 Montreal Neurological Institute 152 space, and a mean FA image was generated from the transformed FA images. A mean skeleton image was created from the mean FA image, and each of the subject’s aligned FA image was projected onto the mean FA skeleton by filling the structure with FA values from the nearest relevant tract center. Finally, this skeletonized FA image was thresholded using an FA value of 0.2 to reduce intersubject variability and to represent each tract as a single line running down the center of the tract. The MD images were projected onto the skeleton using the transformation matrix produced by processing the FA images. The average values for FA and MD were calculated within the TBSS skel-eton of 48 WM tracts based on the International Consortium of Brain Mapping DTI- 81 WM labels atlas (Smith et al., 2006).
2.5 | Cognitive function prediction
PLSR modeling was performed using the package “pls” (Mevik, Wehrens, & Liland, 2015) in the R program (R Core Team, 2017). Two kinds of PLSR model were made for each group, and all models used hippocam-pal subfield volumes and FA/MD values as predictors. As for dependent variables, one used CERAD- K total scores, while the other used scores of seven CERAD- K subdomains and K- GDS, simultaneously. All predic-tors and dependent variables were transformed into z- scores, but they were not adjusted to ICV or age since this study’s aim was to test the predictability of the hippocampal volumes and DTI metrics per se, prob-ably containing the information of ICV or age, on cognitive function for each group, which is also related with ICV or age (Royle et al., 2013; Wolf, Julin, Gertz, Winblad, & Wahlund, 2004). The optimal number of LVs was determined based on the mean squared error of prediction (MSEP) and the predicted residual estimated sum of squares (PRESS). The number of LVs showing the lowest MSEP and PRESS were selected in the PLSR using CERAD- K total scores as one dependent variable, and in the case of PLSR using multiple dependent variables, the ma-jority rule was applied, which means that the most common number was selected among the numbers of LVs with the lowest MSEP and PRESS for each of the dependent variables. For all predictors per group, jackknife approximate t- tests of regression coefficients (i.e., jack.test in the package “pls”) were performed to identify important predictors that are significantly correlated with each of the LVs with regard to each of the dependent variables separately. To validate the predictability of each group’s PLSR models, a 10- fold cross- validation and linear regres-sion analysis between observed and predicted scores was conducted. Finally, we randomly split data into 2/3 and 1/3 for the training and
test set and predicted the scores of dependent variables with a PLSR model using training set and then performed a linear regression analysis between the observed and predicted scores for the testing set, which was repeated 300 times.
3 | RESULTS
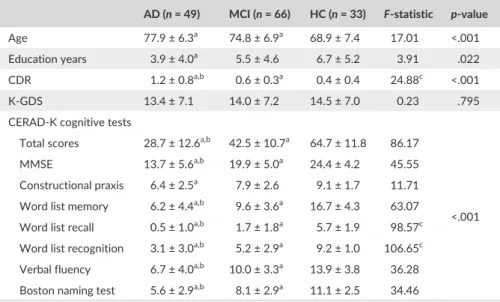
The demographic data and scores on the CERAD- K cognitive test, CDR, and K- GDS are presented in Table 1. The AD and MCI groups are significantly older than the HCs, and AD patients were less edu-cated compared to the HCs. Naturally, the three groups differed from each other in the scores for the CDR and CERAD- K cognitive test except for the constructional praxis scores, for which the AD group only differed significantly from the MCI and HC groups.
Figure S1 shows the MSEP of the three groups’ PSLR models using CERAD- K total scores as a dependent variable, respectively. According to these plots, the optimal numbers of LVs were 1, 1, and 4 for the AD, MCI, and HC groups, respectively. In the case of the PLSR models using scores of CERAD- K 7 subdomains and K- GDS as dependent variables, the optimal numbers of LVs were all 1 for all three groups. For the AD, MCI, and HC groups, the selected LV num-ber(s) explained 59.7%, 43.2%, and 94.0% of the variance for the CERAD- K total scores, respectively. For the other dependent vari-ables and predictors, the relevant information is presented in Table S1. As a whole, the CERAD- K total score was the highest explained dependent variable, and the MMSE score was the second- highest explained variable, whereas the K- GDS score was the least- explained variable.
Table 2 shows the most important hippocampal subfields and fiber tracts that are significantly (p < .005) correlated with the LV(s) with regard to the CERAD- K total scores of each group. As shown in Table 2, the volumes of the hippocampal subfields, including CA1, CA2/3, CA4, molecular layer, subiculum, parasubiculum, hippocampal fissure, hippocampal tail, and GC- ML- DG, were significant predictors, although the global FA/MD values, (i.e., average of all regional FA/MD values) and several FA/MD values of regional fiber tracts, such as the anterior corona radiata, were also important predictors related to CERAD- K total scores in the AD patients. In contrast with the AD pa- tients, the FA/MD values were only significant contributors to the se-lected LV(s) in MCI patients and healthy controls. As shown in Figure 1, the important fiber tracts of the MCI patients were anterior/posterior limb and retrolenticular part of the internal capsule, genu of the cor-pus callosum, fornix (cres)/stria terminalis, sagittal stratum, posterior corona radiata, superior fronto- occipital fasciculus (SFOF), etc., while important fiber tracts of healthy controls were cerebral peduncle, genu of corpus callosum, etc. Similar to the CERAD- K total scores, the hip-pocampal subfield volumes were the main predictors of the scores for the CERAD- K subdomains, including MMSE, Word list memory, Verbal fluency, etc. in AD patients (See Table S2), while the FA/MD values were main predictors for the scores of the CERAD- K subdomains in MCI patients and healthy controls (See Tables S3 and S4). There was no significant predictor for the K- GDS scores. As shown in Figure 2, the PLSR model of patients with AD or MCI significantly predicted the CERAD- K total scores in 10- fold cross- validation (AD: R2 = .47, coefficient = .50, t- value = 6.08, p = 3.32E-
07; MCI: R2 = .30, coefficient = .35, t- value = 5.29, p = 1.60E- 06),
while the PLSR model of the HCs did not predict the CERAD- K total
AD (n = 49) MCI (n = 66) HC (n = 33) F- statistic p- value
Age 77.9 ± 6.3a 74.8 ± 6.9a 68.9 ± 7.4 17.01 <.001
Education years 3.9 ± 4.0a 5.5 ± 4.6 6.7 ± 5.2 3.91 .022
CDR 1.2 ± 0.8a,b 0.6 ± 0.3a 0.4 ± 0.4 24.88c <.001
K- GDS 13.4 ± 7.1 14.0 ± 7.2 14.5 ± 7.0 0.23 .795
CERAD- K cognitive tests
Total scores 28.7 ± 12.6a,b 42.5 ± 10.7a 64.7 ± 11.8 86.17
<.001
MMSE 13.7 ± 5.6a,b 19.9 ± 5.0a 24.4 ± 4.2 45.55
Constructional praxis 6.4 ± 2.5a 7.9 ± 2.6 9.1 ± 1.7 11.71
Word list memory 6.2 ± 4.4a,b 9.6 ± 3.6a 16.7 ± 4.3 63.07
Word list recall 0.5 ± 1.0a,b 1.7 ± 1.8a 5.7 ± 1.9 98.57c
Word list recognition 3.1 ± 3.0a,b 5.2 ± 2.9a 9.2 ± 1.0 106.65c
Verbal fluency 6.7 ± 4.0a,b 10.0 ± 3.3a 13.9 ± 3.8 36.28
Boston naming test 5.6 ± 2.9a,b 8.1 ± 2.9a 11.1 ± 2.5 34.46
AD, Alzheimer’s dementia; K-GDS, Korean Geriatric Depression Scales; MCI, Mild cognitive impair-ment; HC, Healthy control; CDR, Clinical Dementia Rating; MMSE, Mini- Mental State Examination. As for the scores of CERAD- K cognitive test and K- GDS, complete data were available for 38 AD pa-tients, 64 MCI paAs for the scores of CERAD- K cognitive test and K- GDS, complete data were available for 38 AD pa-tients, and 30 HCs, and one or more data were not available for the remaining subjects.
aIndicates significance compared to HC group (p < .05). bIndicates significance compared to MCI group (p < .05).
cWelch’s ANOVA with Games- Howell post hoc test. Otherwise, ANOVA with Tukey’s post hoc test.
T A B L E 1 Demographic and clinical characteristics of participants
scores (R2 = .12, coefficient = .22, t- value = 1.98, p = .057). In addition to the CERAD- K total scores, the scores of five or six CERAD- K sub-domains, such as MMSE, Word list memory, Verbal fluency etc., can also be predicted using the PLSR model of patients with AD or MCI, respectively (for more information, see Table S5). Finally, a total of 300 iterations of the linear regression between the predicted and observed values from the PLSR models, using 2/3 for training and 1/3 as a test set, exhibited that only CERAD- K total scores and Verbal fluency can be significantly predicted using the PLSR models in patients with AD (CERAD- K total scores: R2 = .51,
T A B L E 2 Hippocampal subfields and fiber tracts that are significantly (p < .005) correlated with the latent variable(s) with regard to CERAD- K total scores in three groups
Alzheimer’s disease reg.coef. t- value p- value Mild cognitive impairment reg.coef. t- value p- value
Hippocampal subfields FA
CA1 (L) .0221 5.31 .0005 Anterior limb of internal capsule
(L) .0189 5.93 .0002
Hippocampal tail (L) .0149 4.85 .0009 Genu of corpus callosum .0176 4.86 .0009
Whole hippocampus (L) .0228 4.66 .0012 SFOF (R) .0203 4.82 .0009
CA1 (R) .0216 4.57 .0013 Retrolenticular part of internal
capsule (L) .0136 4.42 .0017
Molecular layer (L) .0233 4.41 .0017 Fornix (cres)/stria terminalis (R) .0156 4.40 .0017
Whole hippocampus (R) .0212 4.40 .0017 Anterior limb of internal
capsule (R) .0194 3.95 .0033
Subiculum (R) .0222 4.35 .0019 MD
Molecular layer (R) .0219 4.30 .0020 Retrolenticular part of internal capsule (L) −.0177 −6.62 .0001 GC- ML- DG (L) .0217 4.08 .0027 Fornix (cres)/stria terminalis (L) −.0251 −6.35 .0001 CA4 (L) .0218 4.08 .0028 Sagittal stratum (L) −.0175 −6.14 .0002 CA2/3 (L) .0198 3.94 .0034 Posterior corona radiata (R) −.0220 −5.84 .0002 Hippocampal.fissure (R) .0207 3.86 .0038 Anterior limb of internal capsule (L) −.0195 −5.47 .0004
Parasubiculum (L) .0184 3.70 .0049 Posterior limb of internal
capsule (R) −.0149 −5.10 .0006 FA Fornix (cres)/stria terminalis (R) −.0228 −4.48 .0015 FA global .0132 4.95 .0008 Anterior corona radiata (R) −.0202 −4.35 .0018 Anterior corona radiata (L) .0187 4.36 .0018 Genu of corpus callosum −.0204 −4.35 .0018 Genu of corpus callosum .0177 4.25 .0021 Superior corona radiata (R) −.0172 −4.23 .0022
Posterior corona radiata (R) .0134 3.85 .0039 Posterior limb of internal capsule (L)
−.0186 −4.20 .0023
MD Retrolenticular part of internal
capsule (R)
−.0160 −4.14 .0025
MD global −.0191 −4.32 .0019 Sagittal stratum (R) −.0242 −3.87 .0038
Fornix (cres)/stria terminalis (L)
−.0185 −4.23 .0022 Body of corpus callosum −.0162 −3.86 .0038
Anterior corona radiata (R) −.0192 −3.96 .0033 Posterior corona radiata (L) −.0180 −3.86 .0039 Cingulum (cingulate gyrus) (R) −.0199 −3.84 .0039 Anterior limb of internal capsule (R) −.0181 −3.81 .0041 Healthy controls MD FA Genu of corpus callosum1 −.0178 −3.98 .0032 Cerebral peduncle (L)2 −.0730 −4.14 .0025 Anterior corona radiata (L)1 −.0146 −3.86 .0039
Cerebral_peduncle (L)3 −.0702 −3.91 .0036 Retrolenticular part of internal
capsule (L)1 −.0203 −3.79 .0043
CA, Cornu Ammonis; FA, fractional anisotropy; MD, mean diffusivity; GC- ML- DG, granule cell layer- molecular layer- dentate gyrus; SFOF, superior fronto- occipital fasciculus.
coefficient = 1.09, t- value = 3.74, p = .018; Verbal fluency: R2 = .41,
coefficient = 1.26, t- value = 3.07, p = .046). The same iterative test-ing also revealed that the CERAD- K total scores of the MCI patients can be predicted from the PLSR models of the MCI patients (R2 = .38,
coefficient = 1.02, t- value = 3.58, p = .025), and that no dependent variables can be predicted from the PLSR models in the HCs (for more information, see Table S6).
4 | DISCUSSION
In this study, we found that cognitive function of MCI and AD pa-tients can be predicted using PLSR models in which the predictors are the hippocampal subfield volumes and DTI metrics (FA/MD). As for
the MCI patients, DTI metrics were mostly significant predictors of cognitive function, whereas hippocampal subfield volumes were the main contributors to cognitive function in AD patients, although global FA/MD values were also significant predictors. The 10- fold cross- validation of the PLSR models of patients with AD or MCI showed that CERAD- K total scores and scores of the several CERAD- K subdomains can be significantly predicted, and further, stricter 300 iterative tests clearly proved that the global cognition measured by the CERAD- K total scores can be reliably predicted using PLSR models with hip-pocampal volumes and DTI metrics in patients with AD or MCI.
As for the cognitive impairment of AD, Bozzali and colleagues (Bozzali et al., 2012) suggested that brain deafferentation through the cingulum is likely to play a remarkable role. In this hypothesis, neuro-nal loss of the medial temporal lobe at early stages of AD may lead to F I G U R E 1 Significant fiber tracts obtained by thresholding p- values <0.005 to the coefficients of three groups’ PLSR models using CERAD- K total scores as dependent variables
F I G U R E 2 Predicted versus measured CERAD- K total scores of three groups. Predicted values are obtained by 10- fold cross- validation in each PLSR model
axonal loss, and then deafferentation of other brain regions, where these axons project, is considered to contribute to the cognitive dis-abilities in AD. On the other hand, the myelin model of the human brain proposed by Bartzokis (Bartzokis, 2011) considers AD as homeo-static responses to age- related myelin breakdown, and a key protein of AD (i.e., Aβ and tau) is a byproduct of the myelin repair process rather than the primary cause of AD. In this model, the spread pattern of the AD lesion “recapitulates the myelination pattern in reverse” (Braak & Braak, 1996), that is, later- myelinated neocortical projection fibers are affected first, while early- myelinated large- diameter from motor and sensory areas are affected least and last (Bartzokis, Lu, & Mintz, 2007) since the myelin sheaths are structurally more vulnerable when they are produced later during brain development (Amlien & Fjell, 2014).
Our findings imply that the myelin breakdown model is more plau-sible for pre- or early AD pathogenesis than the brain deafferentation model, since cognitive impairment of the MCI patients is predicted by the DTI metrics of cortico- cortical association fibers like corpus callosum and corona radiata, while the brain deafferentation model is more readily explainable for cognitive impairment of late- stage AD since AD patients’ cognitive disabilities are mainly influenced by hip-pocampal atrophy, MD of the cingulum, and so on. WM microscopic changes may occur before neuronal degradation and atrophy can be detectable on a macroscopic level (Muller et al., 2005). Accordingly, as other researchers have contended, DTI might be a more sensitive and quantifiable tool for early detection of AD than conventional MRI techniques (Neil, Miller, Mukherjee, & Huppi, 2002; Sun et al., 2005).
Our findings indicate that higher FA and lower MD values pre-dicted higher cognitive functions in MCI or AD patients, and these are in agreement with previous studies reporting a significant asso-ciation between decreased MMSE and reduced FA (Bai et al., 2009) or increased MD (Muller et al., 2007), either within or across groups. A recent meta- analysis (Sexton et al., 2011) revealed that impaired global cognitive functions of AD patients were associated with an absolute effect size for FA in the parietal region while those of MCI patients were associated with an absolute effect size of FA in the frontotemporal and parietal regions and MD in the frontal region and corpus callosum. These findings suggest that in pre- AD stages, diffuse WM alterations are more involved in cognitive functions than in AD stages, which is consistent with our results. It is plausible that myelin breakdown may result in a slow progression of the disruption in neural transmissions, which leads to the degradation of temporal synchrony in widely distributed neural networks. Such impaired synchronization of large- scale neural networks may impair higher cognitive functions, including memory (Bartzokis, 2004).
In our study, the FA or MD value of the genu of corpus callosum was a significant predictor for global cognition in all three groups and for Word list memory in MCI patients, and the MD value of the body of corpus callosum was a significant predictor for global cognition in MCI patients. Atrophies and FA/MD changes in the anterior (genu) and the posterior (splenium) subregions of corpus callosum are widely accepted in AD (Sexton et al., 2011), and these alterations are sug-gested to be present in the early stages of AD (Di Paola, Spalletta, & Caltagirone, 2010). The genu receives axons directly from the
prefrontal cortex and myelinates later than the splenium, which re- ceives axons from temporo- parietal regions that typically exhibit at-rophy and hypometabolism in the AD (Ishii, 2014). Our findings that fiber tracts located in not the splenium but the genu predicted cog-nitive functions for MCI patients imply that the myelin breakdown model is more plausible than the Wallerian degeneration model in the early stage of AD pathogenesis.
Burgess and colleagues (Burgess, Maguire, & O’Keefe, 2002) men-tioned that the right or left hippocampus has a different role according to the type of memory. For example, the right hippocampus is particu-larly involved in visuo- spatial memory, with the left hippocampus more involved in episodic or autobiographical memory (Burgess et al., 2002). In our study, verbal memory and fluency are also largely predicted by the vol- ume of the left hippocampal subfields, and this is compatible with a previ-ous study reporting a significant association between the shrinkage of the left hippocampus and impaired verbal memory of AD (Laakso et al., 1995). Meanwhile, a meta- analysis of the relationship between memory performance and hippocampal volumes showed little evidence for the bigger- is- better hypothesis in older adults (Van Petten, 2004). In this analysis, studies showed extreme variability in the relationship between hippocampal size and episodic memory in older adults. However, in the case in which hippocampal atrophy becomes obvious with marked cognitive disabilities as AD progresses, the hippocampal volume itself seems to be an important biomarker to predict the degree of cognitive dysfunction, as our study implied. In our study, the CA1 volume was an important predictor of global cognition of AD patients. CA1 is known to be the first hippocampal area affected by neurofibrillary tangles, and it shows a maximal volume decrease (about 27%) in AD patients (La Joie et al., 2013; Schonheit, Zarski, & Ohm, 2004). Since CA1 and subiculum are the hippocampal subfields that show highly significant atrophy and neuronal loss in AD (West, Coleman, Flood, & Troncoso, 1994), follow- up volumetry of these subfields will be useful to predict progression for MCI patients.
4.1 | Limitations
There are several limitations of our study. First, a significant portion of the participants exhibited depressive symptoms since we did not ex-clude participants based on their K- GDS scores. In one meta- analysis of depression, patients exhibited about 8–10% reduced hippocampal volumes (Videbech & Ravnkilde, 2004). Thus, it is possible that the depressive symptoms of the subjects may affect the hippocampal vol-umes and general cognitive functions. However, depression is very common, and 30–40% of patients with AD or MCI have comorbid depression (Chi et al., 2015; Ismail et al., 2015). Therefore, our pre-diction model has a strength in that it can be generalized to a clinical situation. Second, predictor variables were not corrected by ICV or age, thus the whole brain volume as well as hippocampal atrophy and age- related WM alterations may have influenced the evaluation of the importance of predictors. Third, only female subjects were included in our analysis, which limits the generalizability of our findings. Last but not least, a substantial portion of the patients with MCI will not progress to AD, so DTI metrics- cognition associations in MCI patients
should not be interpreted as equal to findings of prodromal AD, which warrants further longitudinal follow- up research.
5 | CONCLUSION
Our findings show different structural contributions to cognitive func- tion between MCI and AD patients and imply that diffuse microstruc-tural changes in WM may precede hippocampal atrophy during AD neurodegenerative processes. Our study also clearly showed that the cognitive function of MCI and AD patients can be predicted using hip-pocampal subfield volumetry and DTI metrics. In the future, a more objective evaluation will be possible on cognitive function and disease progression in patients with MCI or AD.
ACKNOWLEDGMENT
This research was supported by a grant of the Korea Health Technology R&D Project through the Korea Health Industry Development Institute (KHIDI), funded by the Ministry of Health & Welfare, Republic of Korea (HC15C1509 to H.- G.J.) and the Brain Research Program through the National Research Foundation of Korea (NRF), funded by the Ministry of Science, ICT & Future Planning (NRF- 2016M3C7A1914448 to B.J.). CONFLICT OF INTEREST None declared. REFERENCES Abdi, H. (2010). Partial least squares regression and projection on latent structure regression (PLS Regression). Wiley Interdisciplinary Reviews: Computational Statistics, 2, 97–106. Amlien, I. K., & Fjell, A. M. (2014). Diffusion tensor imaging of white mat-ter degeneration in Alzheimer’s disease and mild cognitive impairment. Neuroscience, 276, 206–215. Bae, J. N., & Cho, M. J. (2004). Development of the Korean version of the Geriatric Depression Scale and its short form among elderly psychiatric patients. Journal of Psychosomatic Research, 57, 297–305.
Bai, F., Zhang, Z. J., Watson, D. R., Yu, H., Shi, Y. M., Yuan, Y. G., … Jia, J. P. (2009). Abnormal integrity of association fiber tracts in amnestic mild cognitive impairment. Journal of the Neurological Sciences, 278, 102–106.
Bartzokis, G. (2004). Age- related myelin breakdown: A developmental model of cognitive decline and Alzheimer’s disease. Neurobiology of Aging, 25, 5–18.
Bartzokis, G. (2011). Alzheimer’s disease as homeostatic responses to age- related myelin breakdown. Neurobiology of Aging, 32, 1341–1371. Bartzokis, G., Lu, P. H., & Mintz, J. (2007). Human brain myelination and
amyloid beta deposition in Alzheimer’s disease. Alzheimer’s & Dementia: the Journal of the Alzheimer’s Association, 3, 122–125.
Beaulieu, C. (2002). The basis of anisotropic water diffusion in the nervous system - a technical review. NMR in Biomedicine, 15, 435–455. Bozzali, M., Giulietti, G., Basile, B., Serra, L., Spano, B., Perri, R., … Cercignani,
M. (2012). Damage to the cingulum contributes to alzheimer’s disease pathophysiology by deafferentation mechanism. Human Brain Mapping, 33, 1295–1308.
Braak, H., & Braak, E. (1996). Evolution of the neuropathology of Alzheimer’s disease. Acta Neurologica Scandinavica. Supplementum, 165, 3–12. Burgess, N., Maguire, E. A., & O’Keefe, J. (2002). The Human hippocampus
and spatial and episodic memory. Neuron, 35, 625–641.
Chandler, M. J., Lacritz, L. H., Hynan, L. S., Barnard, H. D., Allen, G., Deschner, M., … Cullum, C. M. (2005). A total score for the CERAD neuropsychological battery. Neurology, 65, 102–106.
Chetelat, G., Desgranges, B., de la Sayette, V., Viader, F., Berkouk, K., Landeau, B., … Eustache, F. (2003). Dissociating atrophy and hypome-tabolism impact on episodic memory in mild cognitive impairment. Brain, 126, 1955–1967.
Chi, S., Wang, C., Jiang, T., Zhu, X. C., Yu, J. T., & Tan, L. (2015). The prev-alence of depression in Alzheimer’s disease: A systematic review and meta- analysis. Current Alzheimer Research, 12, 189–198.
Choi, S. H., Na, D. L., Lee, B. H., Hahm, D. S., Jeong, J. H., Yoon, S. J., … Group, D. R. (2001). Estimating the validity of the Korean version of expanded clinical dementia rating (CDR) scale. Journal of the Korean Neurological Association, 19, 585–591.
Di Paola, M., Spalletta, G., & Caltagirone, C. (2010). In vivo structural neu- roanatomy of corpus callosum in Alzheimer’s disease and mild cogni-tive impairment using different MRI techniques: A review. Journal of Alzheimer’s Disease, 20, 67–95.
Forlenza, O. V., Diniz, B. S., Teixeira, A. L., Stella, F., & Gattaz, W. (2013). Mild cognitive impairment (part 2): Biological markers for diagnosis and prediction of dementia in Alzheimer’s disease. Revista Brasileira de Psiquiatria, 35, 284–294. Frisoni, G. B., Fox, N. C., Jack, C. R., Scheltens, P., & Thompson, P. M. (2010). The clinical use of structural MRI in Alzheimer disease. Nature Reviews. Neurology, 6, 67–77. Grundman, M., Jack, C. R., Petersen, R. C., Kim, H. T., Taylor, C., Datvian, M., … Van Dyck, C. (2003). Hippocampal volume is associated with mem-ory but not nonmem… Van Dyck, C. (2003). Hippocampal volume is associated with mem-ory cognitive performance in patients with mild cognitive impairment. Journal of Molecular Neuroscience, 20, 241–248. Grundman, M., Sencakova, D., Jack, C. R., Petersen, R. C., Kim, H. T.,
Schultz, A. (2002). Brain MRI hippocampal of clinical status in a mild volume and prediction cognitive impairment trial. Journal of Molecular Neuroscience, 19, 23–27.
Iglesias, J. E., Augustinack, J. C., Nguyen, K., Player, C. M., Player, A., Wright, M., … Van Leemput, K. (2015). A computational atlas of the hippocam-pal formation using ex vivo, ultra- high resolution MRI: Application to adaptive segmentation of in vivo MRI. NeuroImage, 115, 117–137. Ishii, K. (2014). PET approaches for diagnosis of dementia. AJNR. American
Journal of Neuroradiology, 35, 2030–2038.
Ismail, Z., Elbayoumi, H., Fischer, C. E., Hogan, D., Millikin, C., Schweizer, T., … Fiest, K. M. (2015). A systematic review and meta- analysis for the prevalence of depression in mild cognitive impairment. Alzheimer’s & Dementia: The Journal of the Alzheimer’s Association, 11, P516–P517. Jack, C. R., Knopman, D. S., Jagust, W. J., Shaw, L. M., Aisen, P. S., Weiner,
M. W., … Trojanowski, J. Q. (2010). Hypothetical model of dynamic bio-markers of the Alzheimer’s pathological cascade. The Lancet. Neurology, 9, 119–128.
La Joie, R., Perrotin, A., de La Sayette, V., Egret, S., Doeuvre, L., Belliard, S., … Chetelat, G. (2013). Hippocampal subfield volumetry in mild cognitive impairment, Alzheimer’s disease and semantic dementia. NeuroImage. Clinical, 3, 155–162.
Laakso, M. P., Soininen, H., Partanen, K., Helkala, E.-L., Hartikainen, P., Vainio, P., … Riekkinen, P. J. Sr (1995). Volumes of hippocampus, amyg-dala and frontal lobes in the MRI- based diagnosis of early Alzheimer’s disease: Correlation with memory functions. Journal of Neural Transmission - Parkinson’s Disease and Dementia Section, 9, 73–86. Le Bihan, D., & Johansen-Berg, H. (2012). Diffusion MRI at 25: Exploring
brain tissue structure and function. NeuroImage, 61, 324–341. Lebel, C., Gee, M., Camicioli, R., Wieler, M., Martin, W., & Beaulieu, C.
(2012). Diffusion tensor imaging of white matter tract evolution over the lifespan. NeuroImage, 60, 340–352.
Lee, J. H., Lee, K. U., Lee, D. Y., Kim, K. W., Jhoo, J. H., Kim, J. H., … Woo, J. I. (2002). Development of the Korean Version of the Consortium to Establish a Registry for Alzheimer’s Disease Assessment Packet (CERAD- K): Clinical and neuropsychological assessment batteries. The Journals of Gerontology Series B: Psychological Sciences and Social Sciences, 57, P47–P53. Lee, J. T., Xu, J., Lee, J. M., Ku, G., Han, X. L., Yang, D. I., … Hsu, C. Y. (2004).
Amyloid- beta peptide induces oligodendrocyte death by activating the neutral sphingomyelinase- ceramide pathway. Journal of Cell Biology, 164, 123–131.
Loewenstein, D. A., Acevedo, A., Potter, E., Schinka, J. A., Raj, A., Greig, M. T., … Duara, R. (2009). Severity of medial temporal atrophy and amnes-tic mild cognitive impairment: Selecting type and number of memory tests. The American Journal of Geriatric Psychiatry, 17, 1050–1058. Madden, D. J., Whiting, W. L., Huettel, S. A., White, L. E., MacFall, J. R., &
Provenzale, J. M. (2004). Diffusion tensor imaging of adult age differ-ences in cerebral white matter: Relation to response time. NeuroImage, 21, 1174–1181.
McKhann, G., Drachman, D., Folstein, M., Katzman, R., Price, D., & Stadlan, E. M. (1984). Clinical diagnosis of Alzheimer’s disease: Report of the NINCDS- ADRDA Work Group* under the auspices of Department of Health and Human Services Task Force on Alzheimer’s Disease. Neurology, 34, 939. Mevik, B.-H., Wehrens, R., & Liland, K.H. (2016). pls: partial least squares and principal component regression. R package version 2.6-0. https:// CRAN.R-project.org/package=pls. Mielke, M. M., Okonkwo, O. C., Oishi, K., Mori, S., Tighe, S., Miller, M. I., … Lyketsos, C. G. (2012). Fornix integrity and hippocampal volume predict memory decline and progression to Alzheimer’s disease. Alzheimer’s & Dementia: The Journal of the Alzheimer’s Association, 8, 105–113. Morris, J., Heyman, A., Mohs, R., Hughes, J. P., Van Belle, G., Fillenbaum,
G., … Clark, C. (1989). The Consortium to Establish a Registry for Alzheimer’s Disease (CERAD). Part I. Clinical and neuropsychological assesment of Alzheimer’s disease. Neurology, 39, 1159–1165. Muller, M. J., Greverus, D., Dellani, P. R., Weibrich, C., Wille, P. R., Scheurich,
A., … Fellgiebel, A. (2005). Functional implications of hippocampal volume and diffusivity in mild cognitive impairment. NeuroImage, 28, 1033–1042. Muller, M. J., Greverus, D., Weibrich, C., Dellani, P. R., Scheurich, A., Stoeter, P., & Fellgiebel, A. (2007). Diagnostic utility of hippocampal size and mean diffusivity in amnestic MCI. Neurobiology of Aging, 28, 398–403.
Neil, J., Miller, J., Mukherjee, P., & Huppi, P. S. (2002). Diffusion tensor im- aging of normal and injured developing human brain - a technical re-view. NMR in Biomedicine, 15, 543–552.
Oishi, K., & Lyketsos, C. G. (2016). Alzheimer’s disease and the fornix. Frontiers in Aging Neuroscience, 8, 2.
Petersen, R. C., Jack, C. R., Xu, Y. C., Waring, S. C., O’Brien, P. C., Smith, G. E., … Kokmen, E. (2000). Memory and MRI- based hippocampal volumes in aging and AD. Neurology, 54, 581–587.
Petersen, R. C., Smith, G. E., Waring, S. C., Ivnik, R. J., Tangalos, E. G., & Kokmen, E. (1999). Mild cognitive impairment: Clinical characterization and outcome. Archives of Neurology, 56, 303–308.
R Core Team (2017). R: A language and environment for statistical comput-ing. R Foundation for Statistical Computing, Vienna, Austria. https:// www.R-project.org/.
Reese, T. G., Heid, O., Weisskoff, R. M., & Wedeen, V. J. (2003). Reduction of eddy- current- induced distortion in diffusion MRI using a twice- refocused spin echo. Magnetic Resonance in Medicine, 49, 177–182. Roth, A. D., Ramirez, G., Alarcon, R., & Von Bernhardi, R. (2005).
Oligodendrocytes damage in Alzheimer’s disease: Beta amyloid toxicity and inflammation. Biological Research, 38, 381–387.
Royle, N. A., Booth, T., Valdés Hernández, M. C., Penke, L., Murray, C., Gow, A. J., … Wardlaw, J. M. (2013). Estimated maximal and current brain volume predict cognitive ability in old age. Neurobiology of Aging, 34, 2726–2733. Salat, D. H., Tuch, D. S., van der Kouwe, A. J. W., Greve, D. N., Pappu, V., Lee, S. Y., … Rosas, H. D. (2010). White matter pathology isolates the hippocam-pal formation in Alzheimer’s disease. Neurobiology of Aging, 31, 244–256.
Schonheit, B., Zarski, R., & Ohm, T. G. (2004). Spatial and temporal re-lationships between plaques and tangles in Alzheimer- pathology. Neurobiology of Aging, 25, 697–711.
Sexton, C. E., Kalu, U. G., Filippini, N., Mackay, C. E., & Ebmeier, K. P. (2011). A meta- analysis of diffusion tensor imaging in mild cognitive impairment and Alzheimer’s disease. Neurobiology of Aging, 32, 2322. e5-2322.e18. Smith, S. M., Jenkinson, M., Johansen-Berg, H., Rueckert, D., Nichols, T. E., Mackay, C. E., … Behrens, T. E. J. (2006). Tract- based spatial statistics: Voxelwise anal-ysis of multi- subject diffusion data. NeuroImage, 31, 1487–1505.
Stoub, T. R., DeToledo-Morrell, L., Stebbins, G. T., Leurgans, S., Bennett, D. A., & Shah, R. C. (2006). Hippocampal disconnection contributes to memory dysfunction in individuals at risk for Alzheimer’s disease. Proceedings of the National Academy of Sciences of the United States of America, 103, 10041–10045.
Sun, S. W., Song, S. K., Harms, M. P., Lin, S. J., Holtzman, D. M., Merchant, K. M., & Kotyk, J. J. (2005). Detection of age- dependent brain injury in a mouse model of brain amyloidosis associated with Alzheimer’s dis-ease using magnetic resonance diffusion tensor imaging. Experimental Neurology, 191, 77–85.
Tobias, R.D. (1995). An introduction to partial least squares regression (pp. 1250–1257). Proceedings of the twentieth annual SAS users group in-ternational conference: SAS Institute Cary, NC.
Tu, Y. K., Kellett, M., Clerehugh, V., & Gilthorpe, M. S. (2005). Problems of correlations between explanatory variables in multiple regression analyses in the dental literature. British Dental Journal, 199, 457–461. Van Petten, C. (2004). Relationship between hippocampal volume and
memory ability in healthy individuals across the lifespan: Review and meta- analysis. Neuropsychologia, 42, 1394–1413.
Videbech, P., & Ravnkilde, B. (2004). Hippocampal volume and depression: A meta- analysis of MRI studies. The American Journal of Psychiatry, 161, 1957–1966.
Wang, J. H., Lv, P. Y., Wang, H. B., Li, Z. L., Li, N., Sun, Z. Y., … Huang, Y. (2013). Diffusion tensor imaging measures of normal appearing white matter in patients who are aging, or have amnestic mild cognitive impairment, or Alzheimer’s disease. Journal of Clinical Neuroscience, 20, 1089–1094. West, M. J., Coleman, P. D., Flood, D. G., & Troncoso, J. C. (1994).
Differences in the pattern of hippocampal neuronal loss in normal aging and alzheimers- disease. Lancet, 344, 769–772.
Wold, S., Ruhe, A., Wold, H., & Dunn, W. J. (1984). The collinearity problem in linear- regression - the partial least- squares (PLS) approach to gener-alized inverses. SIAM Journal on Scientific Computing, 5, 735–743. Wolf, H., Julin, P., Gertz, H. J., Winblad, B., & Wahlund, L. O. (2004).
Intracranial volume in mild cognitive impairment, Alzheimer’s disease and vascular dementia: Evidence for brain reserve? International Journal of Geriatric Psychiatry, 19, 995–1007.
Zlokovic, B. V. (2011). Neurovascular pathways to neurodegeneration in Alzheimer’s disease and other disorders. Nature Reviews Neuroscience, 12, 723–738.
SUPPORTING INFORMATION
Additional Supporting Information may be found online in the supporting information tab for this article.
How to cite this article: Shim G, Choi K-Y, Kim D, et al. Predicting neurocognitive function with hippocampal
volumes and DTI metrics in patients with Alzheimer’s dementia and mild cognitive impairment. Brain Behav. 2017;7:e00766.