Contents lists available atScienceDirect
Nuclear Materials and Energy
journal homepage:www.elsevier.com/locate/nmeBeryllium global erosion and deposition at JET-ILW simulated with ERO2.0
J. Romazanov
⁎,a, S. Brezinsek
a, D. Borodin
1,a, M. Groth
b, S. Wiesen
a, A. Kirschner
a, A. Huber
a,
A. Widdowson
c, M. Airila
d, A. Eksaeva
a,e, I. Borodkina
a,e, Ch. Linsmeier
a, JET Contributors
2 aForschungszentrum Jülich GmbH, Institut für Energie- und Klimaforschung – Plasmaphysik, Partner of the Trilateral Euregio Cluster (TEC), Jülich 52425, Germany bAssociation EURATOM-Tekes, Aalto University, Espoo, FinlandcCulham Centre for Fusion Energy, Abingdon OX14 3DB, UK
dVTT Technical Research Centre of Finland Ltd., PO Box 1000, FI-02044 VTT, Finland eNational Research Nuclear University MEPhI, 31, Kashirskoe sh., Moscow 115409, Russia
A R T I C L E I N F O
Keywords:
Beryllium Erosion ERO2.0 JET ITER-like wall
A B S T R A C T
The recently developed Monte-Carlo code ERO2.0 is applied to the modelling of limited and diverted discharges at JET with the ITER-like wall (ILW). The global beryllium (Be) erosion and deposition is simulated and com-pared to experimental results from passive spectroscopy. For the limiter configuration, it is demonstrated that Be self-sputtering is an important contributor (at least 35%) to the Be erosion. Taking this contribution into account, the ERO2.0 modelling confirms previous evidence that high deuterium (D) surface concentrations of up to ∼ 50% atomic fraction provide a reasonable estimate of Be erosion in plasma-wetted areas. For the divertor configuration, it is shown that drifts can have a high impact on the scrape-off layer plasma flows, which in turn affect global Be transport by entrainment and lead to increased migration into the inner divertor. The modelling of the effective erosion yield for different operational phases (ohmic, L- and H-mode) agrees with experimental values within a factor of two, and confirms that the effective erosion yield decreases with increasing heating power and confinement.
1. Introduction
The JET ITER-like wall (ILW) is an ideal test bed for ITER-relevant studies of main chamber beryllium (Be) erosion and its migration into the tungsten (W) divertor[1]. Be erosion can limit the lifetime of the respective main chamber wall components [2]. Migration of Be im-purities into the divertor can lead to W erosion[3]as well as fuel re-tention by co-deposition[1,4–6].
The new Monte-Carlo code ERO2.0 has been recently applied to the modelling of Be erosion and migration in JET-ILW limiter plasmas[7]. It has been demonstrated that due to massive parallelization and other technical improvements, ERO2.0 is capable of simulating the three-di-mensionally (3D) shaped wall of the entire torus. This ”global” mod-elling approach reduces uncertainties of the ”local” one pursued with the previous code version ERO1.0, in which only a few adjacent Be limiter tiles are simulated [8]. In particular, the concentration and charge state distribution of intrinsic Be impurities in the plasma are now a result of the code, which allows a self-consistent treatment of Be transport and self-sputtering. Furthermore, the increased simulation
volume allows the validation with a larger number and variety of ex-perimental diagnostics, situated at different locations. These include two-dimensional (2D) camera images (infra-red for heat flux and fil-tered Be I, Be II line or BeD band emission for particle fluxes) as well as line-of-sight (LOS) integrated spectroscopy chords.
In the present contribution, we focus on experimental verification of ERO2.0 using a particular horizontal spectroscopy LOS and 2D camera images of Be II emission in the divertor view. We examine the Be ero-sion for different plasma conditions in limiter configuration, paying special attention to the contribution of self-sputtering. We also study the effect of deuterium (D) concentration in the Be surface interaction layer on the erosion. Furthermore, we present the first ERO2.0 mod-elling of JET-ILW discharges in divertor configuration. We compare the total Be erosion in limiter and divertor configuration for different heating power and operational phases (ohmic, L- and H-mode). 2. The ERO2.0 code
The physics basis of the ERO1.0 code, on which ERO2.0 is based, is
https://doi.org/10.1016/j.nme.2019.01.015
Received 14 August 2018; Received in revised form 7 January 2019; Accepted 14 January 2019
⁎Corresponding author.
E-mail address:j.romazanov@fz-juelich.de(J. Romazanov).
1JARA-HPC, Jülich Supercomputing Centre, Forschungszentrum Jülich GmbH, Jülich 52425, Germany.
2See the author list of ”Overview of the JET results in support to ITER” by X. Litaudon et al., Nucl. Fusion 57 102001.
Available online 06 February 2019
2352-1791/ © 2019 The Authors. Published by Elsevier Ltd. This is an open access article under the CC BY license (http://creativecommons.org/licenses/BY/4.0/).
described e.g. in [9]. Both ERO1.0 and ERO2.0 simulate plasma-wall interaction (PWI) for specific plasma-facing components (PFCs), taking into account edge impurity transport (leading to re-erosion and re-de-position) by calculating test particle trajectories. The relevant changes between the two codes are described in[7], with the increased simu-lation volumes (covering an entire tokamak plasma edge in 3D) used in ERO2.0 being the most significant change. The main ingredients for the present ERO2.0 modelling are:
•
the plasma background (PBG).•
the wall model.•
the basic PWI data and models.•
the impurity transport model.The PBG contains the spatial distribution of electromagnetic fields and density, temperature and flow velocity of electrons and ions. It is obtained as an external input from other codes. PBGs, which are typi-cally provided on field-aligned grids in the (R, z)-plane, are transformed by inter-/extrapolation and stored in ERO2.0 on a simple rectangular grid in the (R, z)-plane, so that they can be quickly accessed using bi-linear interpolation during the simulation. In this work, the grid extents are chosen large enough to cover the JET-ILW limiters and divertor. A grid resolution of ∼ 1cm is used, which is sufficient to resolve the details. Toroidal symmetry is assumed.
The wall model is the 3D geometry and material distribution of the PFCs. The wall model of JET-ILW used in ERO2.0 is described in[7]. Note that currently the wall is treated as static in ERO2.0, so that Be limiter tiles and W divertor tiles are treated as pure throughout the simulation. To account for material mixing, one could use the homo-geneous mixing model (HMM) or coupling to the binary-collision ap-proximation (BCA) code SDTrimSP as described for ERO1.0[10].
The basic PWI data are for instance the parametrized sputtering yields and reflection coefficients, which are obtained from BCA or molecular dynamics (MD) codes [11]. Similar to the local ERO1.0 modelling described in[8], we use two extreme assumptions about the atomic fraction of D in the Be surface, namely (1) 0% D (”ERO-max”, leading to the highest erosion) and (2) 50% D atomic fraction (”ERO-min”, leading to lower Be erosion due to dilution effects[12]). The second assumption is motivated by observations in the literature of Be efficiently retaining implanted or co-deposited fuel. The assumed con-centration of 50% D, or D/Be = 1, can be seen as an upper limit to the highest concentrations observed in experiments (D/Be = 0.5[13]) and multi-scale modelling (D/Be = 1[14,15]).
The impurity transport is modelled in a kinetic picture using the trace impurity approximation: an ensemble of independent test particle trajectories (here: 106) is simulated, which are solutions of the
Fokker–Planck equation[16, p. 20]. Each test particle is weighted to represent a certain number of real sputtered particles[17,18]. After each impact on the wall, a test particle retains only a fraction of its initial weight, determined by the reflection coefficient. After its weight falls below a threshold (chosen here as 1% of its initial value), the test particle’s trajectory calculation is stopped. The trajectories of additional particles created by self-sputtering during the impacts are followed iteratively, until the erosion rate converges. The test particles are as-sumed to start as neutrals, with an initial velocity stochastically sam-pled from the cosine and Thompson distributions for the angle and energy, respectively[11, p. 235].
Their 3D trajectories are simulated taking into account ionization and recombination, with the corresponding rates obtained from the Atomic Data and Analysis Structure (ADAS)[19]. The gyro-orbits of ions are fully resolved using the Boris algorithm[20], so thatE ×B or
×
B B drifts and electric field forces (especially in the sheath) are automatically accounted for. The sheath electric field is calculated on the fly using an analytic expression described in[21], while other field components are currently neglected.
Coulomb collisions are modelled by friction and diffusion terms in the Fokker–Planck equation, so that effects such as entrainment of test particles with scrape-off layer (SOL) flows present in the PBG are in-cluded. Anomalous transport is taken into account by an additional diffusive term, with a constant diffusion coefficient D =1m2/s
as-sumed throughout the simulations in this paper.
Note that in ERO1.0, most test particles leave the simulation volume boundaries and are ”lost” (except for heavy atoms like W, which are strongly affected by prompt deposition[9]). A particular advantage of ERO2.0 is that no particles are lost since the simulation volume covers the entire plasma edge and the material migration is treated ”globally”. In the following two sections, ERO2.0 is applied to JET-ILW dis-charges in limiter and divertor configuration. The different plasma conditions are entirely determined by the input PBGs. Other parameter variations are (1) the two different D surface content assumptions and (2) the switching on and off of self-sputtering inSection 3.
3. Be erosion in limiter configuration
In this section, we focus on the JET-ILW experiment described in[22]. The Be erosion yield is spectroscopically determined using a series of ohmic limited discharges with identical magnetic configura-tion. The plasma contact point is on the Be inner wall (IW) limiter. The gas fuelling rate is varied, resulting in a variation of the electron density and temperature. The spectroscopy LOS is horizontal and directed on a Be IW limiter tile close to the midplane[23]. InFig. 1, the black squares show the total effective Be sputtering yield Yefftot. It is for simplicity
de-noted as ”effective yield” in the following text (not to confuse with the distribution-averaged effective yields as defined in[8]). The effective yield is experimentally determined from the Be and D fluxes, which are calculated from the respective line emission intensities using ADAS inverse photon efficiencies (called S/XB)[19]. The S/XB values were calculated using local plasma parameters ne and Te which were
ob-tained spectroscopically using Be II and Balmer line ratio analysis, as described in[22]. The effective yield values are plotted against the line-averaged central electron density nc =1.0×10
e 19m 3–2.6 × 10¹⁹m 3.
The effective yield increases with decreasing density nc
e . This
re-flects the dependence of the sputtering yield on the impact energy: at lower densities, the temperature is higher (since heating power and pressure remain constant), which leads to a higher average particle impact energy and sputtering yield. It is possible to estimate the local temperature from Be II line ratios [22]: Teloc 35 eV at
= ×
nc 1.0 10
e 19 m 3 and Teloc 8eV at nec =2.6×10¹⁹ m 3.
Ac-cording to the ERO2.0 simulations, the Be+cloud has a width of 4cm 5cm with a peak at about 1cm above the surface, which means that the given Tevalues should be somewhat larger than the actual values at the
surface.
The experimentally determined effective yield inFig. 1 contains physical sputtering contributions from different impacting particles: D ions, Be ions (self-sputtering) and D charge-exchange neutrals (CXN). The last contribution is negligible for the plasma-wetted surface areas studied here, though it is generally significant for diverted discharges, in particular for recessed (”shadowed”) areas. Be self-sputtering is the dominant erosion mechanism in the area marked inFig. 1with the shaded patch, which corresponds to a low-density, high-temperature and Be-rich plasma (Zeff∼ 4). This ”self-sputtering regime” is outside
the normal operational window of JET-ILW, where the limiter phase is limited in operational time and Zeff is less than 2[24]. Only in
ex-periments dedicated to the study of Be erosion, the full operational window is explored with intentionally high electron temperatures[22]. The effective yield also contains a contribution from chemically assisted physical sputtering (CAPS) with release of BeD molecules, which de-pends strongly on the Be surface temperature. At 200°C (the normal limiter temperature at JET-ILW achieved by active pre-heating), CAPS can account for about 1/3 of the erosion, while at higher temperatures ( ∼ 520°C) its contribution vanishes[1,2,22].
For the ERO2.0 modelling, the input PBGs are based on experi-mentally measured upstream radial plasma profiles. As described in [25], the downstream plasma parameters are calculated using the two-point model[26, p. 224], while interpolation along field lines is applied to obtain a full map in the (R, z)-plane. Four such PBGs are available for different plasma densities[27]. In order to obtain a PBG for each particular central density nc
e modelled with ERO2.0 inFig. 1,
the initial four PBGs are interpolated in nc
e . In addition to the PBG
variation, we investigate the influence of the assumed concentration of D implanted in the Be surface.
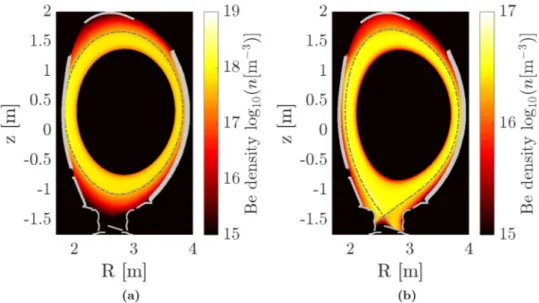
The major difference to the earlier ERO1.0 modelling described in[8,27]is that the Be self-sputtering is treated here in a self-consistent way, since the transport of eroded Be particles is calculated not just locally, but in the entire plasma edge as shown inFig. 2(a). Note that the impurity transport is calculated in the plasma edge but not in the
entire core region, as illustrated inFig. 2(a). A certain flux surface in-side the core region is specified as an artificial boundary for test par-ticles (here: at about 80% of the plasma minor radius). At this boundary, test particles are ”reflected” towards the edge. It was found that this way, the computational time is reduced by a factor of 10, while the edge physics being in the focus of this work is not affected.
The modelling results for the Be effective yield Yefftot are shown in
Fig. 1compared to the experimental values. The two solid curves for 0% D and 50% D enclose the experimental values, providing low and high erosion estimates. In the high-density range at about
×
nc 2.5 10
e 19 m 3, the low erosion estimate with 50% D
con-centration leads to a better agreement. In the low-density range at ×
nc 1.5 10
e 19m 3and below, the high erosion estimate with 0% D
concentration leads to a better agreement.
For comparison, results from simulations in which self-sputtering is Fig. 1. Total effective Be sputtering yield, integrated in a horizontal spectroscopy line-of-sight directed on the IW near the midplane, for limited ohmic discharges. The plasma conditions are varied using a fuelling scan. The experimental values are taken fromFig. 3in[1], with the JET pulse numbers 80319-80323, 80272, 80274.
Fig. 2. Total Be density, averaged in toroidal direction, in (a) limiter and (b) divertor configuration. The dashed lines show the separatrix. The thick grey stripes show the 3D plasma-facing components used in the simulations, projected into the (R, z) plane.
artificially switched off are shown by the two dashed curves. In the low-density range and using the 0% D concentration assumption, self-sputtering is the dominant contribution to the total erosion. In the re-gion marked by the shaded patch, self-sputtering is even more than 10 times higher than sputtering by D. In the high-density range and using the 50% D assumption, the contribution of self-sputtering is the lowest, but still constitutes about 35% of the total erosion. This shows that Be self-sputtering is an important erosion mechanism in the JET-ILW limiter configuration. Thus, the global modelling approach of ERO2.0 makes an important step forward towards a self-consistent description of the erosion, removing one of the major uncertainties of the previous local modelling approach. The concentration and charge state dis-tributions of Be in the plasma, which are required to calculate the Be self-sputtering, are now a part of the modelling results and thus do not require additional assumptions. With this improvement, we can provide an update on the previous interpretation[8]of the Be erosion experi-ment at hand.
We confirm that the 50% D assumption is the better estimate for plasma-wetted surface areas and high-density (low-temperature) plasma conditions, i.e. nc 2.5×10
e 19m 3and Te∼ 8 eV. These are
also the more relevant conditions for the main chamber SOL in the divertor configuration (where there is a larger gap and thus a colder plasma at the first wall). However, the experimental curve is crossed by the lower modelled curve in the right part of the plot. This suggests that at densities above 2.5 × 10¹⁹m 3,one needs to assume D
concentra-tions higher than 50% in the modelling. Furthermore, the steep slope of the experimental curve cannot be explained solely by the two me-chanisms of (1) sputtering yields increasing with electron temperature and (2) total erosion increasing due to self-sputtering. For this, one needs to assume a reduction of the D surface content with decreasing plasma density, which corresponds to a gradual transition from the lower to the upper modelled curve. This is plausible, since the lower density corresponds to a lower D flux, leading to reduced implantation. The lower density also corresponds to higher ion impact energies, leading to increased release of D trapped in the surface, as well as an increased surface temperature and thus outgassing.
An important source of uncertainty in the modelling is that the contribution of CAPS was neglected. The main difficulty for including
CAPS lies in the lack of the basic erosion yield data in the relevant parameter space (e.g. impact angle and energy, surface temperature). The data can be obtained from numerically extensive models, such as the combined molecular dynamics and object-kinetic Monte-Carlo ap-proach (MD-OKMC)[15]. Significant progress has been recently made in the incorporation of these data into ERO[2].
A second source of uncertainty is the static description of the wall in the modelling, i.e. the surface temperature and D content in the surface are treated as constant, using the minimum and maximum estimates of 0% and 50%. Note that CAPS is particularly strongly affected by the surface temperature and D content[15]. The dynamics of fuel reten-tion, affected by processes such as deposition and implantareten-tion, trap-ping and de-traptrap-ping, diffusion and desorption, could be treated using reaction-diffusion modelling. Codes that use this approach (e.g. TMAP[28]or CRDS[29]) have been recently very successfully applied to the interpretation of thermal desorption spectra (TDS) in Be co-de-posited layers[28]and single-crystalline Be[29].
A third source of uncertainty is the usage of the test particle ap-proximation. It becomes invalid for high impurity concentrations, i.e. for the shaded self-sputtering region inFig. 1with high Be concentra-tions. The modelling results should be taken with caution in that region, even though a good agreement with experimental data is observed for the 0% D assumption. E.g. in the most extreme case considered in the modelling, nc =1.1×10
e 19m 3,a very high effective charge Zeff∼ 3.7
is found experimentally[27]. A detailed analysis of the plasma beha-viour in the vicinity of strong impurity sources, and its impact on ERO modelling, is given in[30,31].
Finally and most importantly, the ERO simulation results are highly dependent on the input PBG. The calculated Be erosion flux is directly proportional to the impinging deuteron flux as well as the sputtering yields, which depend strongly on the local plasma temperature (impact energy)[2]. But also the simulation of Be transport is affected by the plasma parameters, mainly by the ionization rates[19]and the friction and diffusion coefficients[17]. In this section, the PBGs are based on experimental profiles from the JET reciprocating probe[32]and high-resolution Thomson scattering (HRTS)[33]systems, which are mea-suring vertically from the top of the machine and at the outer midplane (OMP), respectively. They are well-verified at those diagnostic Fig. 3. Be gross erosion (left) and deposition (right) flux pattern, obtained for the ohmic phase of the Be monitoring discharge. The toroidal section shown here covers the JET octants 7Z–1X. The red line shows the separatrix. (For interpretation of the references to colour in this figure legend, the reader is referred to the web version of this article.)
measurement locations, but are uncertain at the inner midplane (IMP). 4. Be erosion in divertor configuration
For modelling the divertor configuration, we consider the Be mon-itoring discharge (reference JET pulse number #83393), which has been regularly executed since the start of ILW operation at JET to document the change of the impurity content [34]. The monitoring discharge features the following successive phases of operation: (1) ohmic limiter, (2) ohmic divertor, (3) L-mode and (4) H-mode phase. For this work, we currently neglect the effect of regular fast transients in the modelling, so-called edge localised modes (ELMs), in the H-mode phase and focus solely on the inter-ELM phase. Note that in contrast to W, Be has a low sputtering threshold and is eroded already by main plasma species during the intra-ELM phase. Therefore, and due to their short duration and small interaction areas on the wall, ELMs are not expected to have a significant impact on Be erosion.
The limiter phase of the monitoring discharge includes plasma contact on both inner and outer wall. The plasma shape for the IW contact phase is almost identical to the one used in the above-described Be erosion experiment, seeFig. 2(a). The plasma shape for the divertor phases is indicated by the separatrix shown inFig. 2(b) and inFig. 3. The inner strikeline is located on the vertical target, the outer strikeline on the horizontal target.
The corresponding PBGs for the divertor ohmic, L- and H-mode phases were provided by the coupled fluid plasma edge and kinetic neutral transport code EDGE2D-EIRENE [35–37]. As an illustrative example of the ERO2.0 simulation results,Fig. 3(left) shows the flux of eroded Be, colour-mapped to the 3D wall geometry, for the ohmic phase. One can see comparable levels of erosion on both IW and OW poloidal limiters. Similar patterns are observed for the L- and H-mode phases (not shown here).
In a similar way,Fig. 3(right) shows the flux of Be gross deposition, obtained as a result of the trajectory tracing of Be test particles. Al-though a fraction of the eroded Be is deposited back on the limiters, in particular the OW limiters, the major part migrates into the divertor. The main Be deposition area is found on top of the inner divertor. The same Be deposition zone was identified in the post-mortem ana-lysis [4,5]and modelling with the 2D global erosion and deposition code WallDYN[38,39]. In this zone, thick Be layers are formed, which are responsible for 45% of the overall long-term fuel retention due to co-deposition[6].Fig. 3also shows significant gross deposition at the vertical and horizontal targets close to the strike points.
Note that the net deposition found by post-mortem analysis and WallDYN modelling are much lower than gross deposition in these areas. For the calculation of net deposition and fuel retention in ERO2.0, the growth and re-erosion of deposited Be layers on top of the W should be considered. As a first improvement, the dynamics of de-posited layers could be described using the homogeneous mixing model (HMM), which was already used in ERO1.0[40]but not implemented yet in ERO2.0.
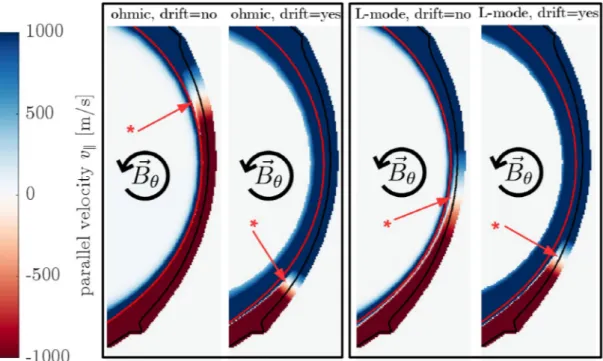
Cross-field drifts are automatically included in the impurity trans-port model of ERO2.0. In the EDGE2D-EIRENE simulations of the PBGs, however, drifts can be switched on and off. Their presence or absence has an indirect effect on ERO2.0 results, namely by affecting the plasma parameters and in particular the SOL plasma flows, which in turn have a strong effect on the long-range Be transport due to entrainment and on the resulting deposition patterns. For the simulation shown inFig. 3, an EDGE2D-EIRENE PBG is used in which drifts (E ×B) were not in-cluded. When drifts are included (results not shown here), the Be de-position decreases in the outer divertor but increases in the IW and inner divertor. The reason is illustrated inFig. 4, which shows the flow velocity component v∥parallel to the magnetic field in plasma edge as
simulated by EDGE2D-EIRENE. For better illustration, only a part of the poloidal cross-section is shown (low-field side) where the stagnation
zone occurs (indicated by red arrows). Parallel flow regions (blue) en-hance the transport towards the IW and inner divertor, anti-parallel regions (red) enhance the transport towards the outer divertor. For the ohmic phase (Fig. 4left), the consideration of drifts shifts the stagnation zone down towards the outer divertor. Thus, a larger OW area adjoins the region of upward flow, which means that the eroded Be is more likely to migrate to the IW and inner divertor. For the L-mode phase (Fig. 4right), which has a higher plasma collisionality than the ohmic phase, the effect is much less pronounced. The higher collisionality results in weaker parallel temperature gradients and electric fields, thus reducing drifts. For the H-mode phase, EDGE2D-EIRENE simulations were available only without drifts at the time of writing this paper, so a comparison could not be done in that case.
Spectroscopically filtered wide-angle cameras are a useful means of illustrating the effect of drifts, but also for a general verification of the erosion and transport modelling.Fig. 5shows experimental and syn-thetic images of Be II line emission at 527 nm in the divertor (JET ”KL11” endoscope[41]). The latter ones are calculated using a syn-thetic diagnostic recently implemented in ERO2.0, which allows ren-dering 2D images from the 3D light emission patterns of impurities si-mulated by the code[7].
The top row of images shows the ohmic phase. In the experiment (top left), the strongest emission is seen as a bright plume at the inner vertical target. This corresponds to the area just above the inner stri-keline, where a high flux of Be particles (coming from the main chamber) is reflected at the target plate and immediately re-ionised. In the synthetic image without drifts (top middle), the main emission comes from the horizontal target, due to the Be particles reflected next to the outer strikeline. When drifts are taken into account (top right), the emission at the horizontal target is reduced in favour of the inner vertical target, which makes the image resemble the experimental one more closely.
The opposite trend is observed for the L-mode phase in the bottom row of images. Here, the main emission is observed in the outer divertor in the experimental image. The synthetic image overestimates the emission in the inner divertor, particularly at its top. This discrepancy is worsened by taking drifts into account, which again enhance the transport to the inner divertor.
Resolving the apparent discrepancy between spectroscopy, post-mortem analysis and modelling requires a more thorough analysis (taking into account e.g. additional camera images with different filters and fields-of-view). Moreover, the experimental and synthetic images cannot be compared one-to-one yet due to uncertainties in the camera parameters assumed in the model (pupil position, view direction, field-of-view angle) and its negligence of aberration effects. These un-certainties should be investigated using specialised camera calibration tools such as Calcam3. Alternatively, one might envisage a comparison
of the simulated Be line emission in the poloidal plane with tomo-graphic reconstructions of the experimental one.
The PBGs are another source of uncertainty, since these determine the Be erosion patterns. The shape of an emission cloud also depends on the Be transport and line emission properties, which are affected by the plasma density and temperature (via the ADAS ionisation rates and photon efficiencies[19]) and flow velocity (via entrainment). A too low density or temperature in the PBG, and thus a too low Be ionisation rate, could explain why the emission clouds in the synthetic images appear more diffuse than those in the experimental images (seen especially in the upper right corner).
Furthermore, as mentioned above, the growth and re-erosion of Be deposited layers is neglected here, which could easily change the ero-sion and thus the emisero-sion patterns in the synthetic images. Regardless of these present uncertainties, we can conclude that drifts and en-trainment play an important role in the global migration of Be. This
highlights the importance of considering drifts in edge codes[42], such as EDGE2D-EIRENE or SOLPS-ITER[43].
Finally, we quantitatively compare the Be limiter erosion in divertor
configuration to the one in limiter configuration, which was discussed in the previous section.Fig. 6shows the experimental and modelled Be effective yield for the different phases of the monitoring discharge. The Fig. 4. Deuteron flow velocity parallel to the magnetic field calculated with EDGE2D-EIRENE for the ohmic (left) and L-mode (right) phases of the Be monitoring discharge. Including the drift moves the flow stagnation region closer to the outer divertor, thus enhancing the migration of ERO2.0 test particles (due to en-trainment) from the outer wall to the inner divertor. The effect of drifts is stronger in low-collisionality plasmas (ohmic phase) and weaker in high-collisionality plasmas (L-mode phase).
Fig. 5. Filtered 2D camera images showing Be II 527 nm line emission intensity (arbitrary units). From left to right: experiment, ERO2.0 modelling (PBG without drifts), ERO2.0 modelling (PBG with drifts). The top row shows the ohmic phase, the bottom row the L-mode phase.
limiter phase of the monitoring discharge has an average density of about nc =1.1×10
e 19 m 3, which corresponds to the low density
range in the Be erosion experiment inFig. 1. Here, the value modelled using the 0% D surface content assumption is shown. For the divertor phases, the local temperature is below Teloc 5eV. Therefore, the 50% D assumption is used for the modelling of these phases.
Quantitatively, the experimental values are reproduced by the modelling within about a factor of two, with the largest discrepancy found for the L-mode. One can also see that the modelling system-atically underestimates the erosion in the diverted phases. Qualitatively, the basic trend seen in the experiment is well reproduced by the modelling: with increasing heating power and improving con-finement, the effective yield drops by more than two orders of magni-tude. However, while in the experiment the H-mode shows less erosion than the L-mode, in the modelling it is vice versa.
As described above, the discrepancy is mainly a consequence of the uncertainty in the input PBGs. The EDGE2D-EIRENE PBGs are well-verified on the divertor targets by experimental Langmuir probe pro-files. However, the verification of upstream profiles is more elaborate: while the density necould be matched to experimental data from the
Lithium beam diagnostic[44], which measures vertically from the top of the machine, the temperature Tecould be compared only to HRTS,
which shows a large scattering in the SOL.
Since the EDGE2D-EIRENE grid extends only a few centimetres into the SOL, a gap between grid boundary and wall remains. The gap is about 4cm to 6cm in the case of the IMP. Extrapolation is required in radial direction to obtain the plasma parameters at all surface locations. The flow velocity is assumed to remain constant, while an exponential decay is assumed for electron density and temperature. The decay length is obtained by exponentially fitting the input PBG radial profile just before the boundary at each poloidal location. Although this ex-ponential decay approach in the SOL is reasonable in the frame of the so-called simple SOL model [26], it is also known that the SOL can exhibit regions in radial direction with different decay lengths (”near” and ”far” SOL)[45]. This is neglected here by taking a single decay length for each poloidal location. The resulting uncertainty highlights the importance of models in which the computational grid extends to the surface, such as those used in the codes SOLEDGE2D-EIRENE[46] and EMC3-EIRENE[47].
Furthermore, neglecting the erosion mechanism of CAPS is less justified in diverted discharges than in limited discharges, in which it is often suppressed by the high limiter surface temperature, so that the
physical sputtering dominates the erosion. Since limiter heating by plasma contact does not play a role in diverted discharges, CAPS can easily explain the systematic underestimation of the effective yields in Fig. 6.
Erosion by CXN impact also deserves more attention in the divertor configuration than in limiter configuration. InFig. 6, it is actually not expected to be the dominant erosion mechanism, since the effective yields are measured in a plasma-wetted area where ion fluxes are ty-pically much stronger than CXN fluxes. However, CXN impact occurs more-or-less homogeneously on the entire wall, including shadowed and recessed regions, while ion impact is strongly localised on plasma-wetted areas. Therefore, CXN is very important if one were to estimate the total Be source, since it is integrated over a larger area. The im-plementation and evaluation of the CXN sputtering mechanism in ERO2.0 is ongoing. Here, the main difficulty lies in obtaining the fluxes of the neutrals, as well as their impact angle and energy distributions. These can be provided by edge codes producing the input PBGs, but again extrapolation to remote locations on the 3D limiter surfaces is necessary. Furthermore, obtaining the distributions for each wall lo-cation requires either large numerical effort or additional assumptions. 5. Conclusions and outlook
The recent modelling analysis of Be erosion at JET-ILW[8]was re-visited with the new code ERO2.0. Due to the global modelling ap-proach of ERO2.0, an important uncertainty of the previous local ERO1.0 modelling is improved, namely the role of Be self-sputtering in the interpretation of the results. After including this erosion mechanism in the modelling, it is shown that the assumption of a high D surface content (50%) in the Be surface does not contradict the experimental observations for the effective sputtering yield, which is consistent with the previous findings in[8]. The present modelling also indicates that the D surface content may be lower during limited discharges with a low-density, high-temperature and Be-rich plasma that were also part of the Be erosion experiment.
The analysis was further extended by applying ERO2.0 to diverted discharges for the first time. We qualitatively confirm the significance of Be migration into the divertor, in particular to the top of the inner divertor, which is in line with post-mortem analysis results. It was found that the Be migration pattern is strongly affected by entrainment with the SOL flows of the main plasma. Those are taken as an input to ERO2.0 from EDGE2D-EIRENE, and change significantly if cross-field drifts are considered in the latter.
This interpretation of the results should not be seen as final, since many uncertainties remain that have a large impact on the simulated effective sputtering yield. They are mainly related to
•
the treatment of additional erosion mechanisms (CAPS and CXN impact).•
the description of the wall dynamics (D content in the Be surface, growth and re-erosion of co-deposited layers in the divertor).•
the test particle approximation, which becomes invalid for verystrong impurity sources.
•
the input PBGs, which require extrapolation to the surface and lack experimental verification there.These uncertainties currently obscure the interpretation of the ef-fective yield. They are also the reason for the observed discrepancies between experimental and synthetic spectroscopically filtered wide-view camera images. This motivates further analysis and refinement of the model.
The uncertainty in the PBG is considered especially important. However, the strong dependence of ERO2.0 results on those can be seen as an advantage, since ERO2.0 provides additional means for the ver-ification of other edge codes, e.g. using its synthetic diagnostics for wide-view camera images. The global modelling approach of ERO2.0 Fig. 6. Total effective Be sputtering yield, integrated in a horizontal
spectro-scopy line-of-sight directed on the IW near the midplane, for different opera-tional phases (limiter, ohmic, L- and H-mode) of the Be monitoring discharge. The experimental values are obtained fromFig. 4in[1].
can be utilized to reduce the uncertainty in PBGs using multiple diag-nostics at different locations in a synergistic verification procedure. Also, the flexible infrastructure of ERO2.0 allows to easily import PBGs from different edge codes, thus it can be used for cross-validating those. Acknowledgements
This work has been carried out within the framework of the EUROfusion Consortium and has received funding from the Euratom research and training programme 2014–2018 under grant agreement no 633053. The views and opinions expressed herein do not necessarily reflect those of the European Commission.
The authors gratefully acknowledge the computing time granted by the JARA-HPC Vergabegremium on the supercomputer JURECA at Forschungszentrum Jülich.
References
[1] S. Brezinsek, et al., Nucl. Fusion 55 (6) (2015) 63021,https://doi.org/10.1088/ 0029-5515/55/6/063021.
[2] D. Borodin et al, this conference. [3] A. Kirschner, et al. this conference.
[4] K. Heinola, et al., Nucl. Fusion 57 (8) (2017) 086024,https://doi.org/10.1088/ 1741-4326/aa747e.
[5] N. Catarino, et al., Nucl. Mater. Energy 12 (2017) 559–563,https://doi.org/10. 1016/J.NME.2016.10.027.
[6] A. Widdowson, et al., Nucl. Fusion 57 (8) (2017) 086045,https://doi.org/10.1088/ 1741-4326/aa7475.
[7] J. Romazanov, et al., Phys. Scr. T170 (T170) (2017) 014018,https://doi.org/10. 1088/1402-4896/aa89ca.
[8] D. Borodin, et al., Nucl. Mater. Energy 9 (2016) 604–609,https://doi.org/10.1016/ j.nme.2016.08.013.
[9] A. Kirschner, et al., Plasma Phys. Control Fusion 60 (1) (2018) 014041,https://doi. org/10.1088/1361-6587/aa8dce.
[10] S. Droste, et al., Plasma Phys. Control Fusion 50 (1) (2008) 015006,https://doi. org/10.1088/0741-3335/50/1/015006.
[11] R. Behrisch, W. Eckstein, Top. Appl. Phys. 110 (2007),https://doi.org/10.1016/ 0030-3992(77)90116-5.
[12] C. Björkas, K. Nordlund, J. Nucl. Mater. 439 (1–3) (2013) 174–179,https://doi.org/ 10.1016/j.jnucmat.2013.04.036.
[13] G. De Temmerman, R.P. Doerner, Nucl. Fusion 49 (4) (2009) 42002,https://doi. org/10.1088/0029-5515/49/4/042002.
[14] M. Reinelt, A. Allouche, M. Oberkofler, C. Linsmeier, New J. Phys. 11 (4) (2009) 043023,https://doi.org/10.1088/1367-2630/11/4/043023.
[15] E. Safi, G. Valles, A. Lasa, K. Nordlund, J. Phys. D. Appl. Phys. 50 (20) (2017) 204003,https://doi.org/10.1088/1361-6463/aa6967.
[16] D.C. Montgomery, D.A. Tidman, (1964).
[17] D. Reiser, D. Reiter, M. Tokar’, Nucl. Fusion 38 (2) (1998) 165–177,https://doi. org/10.1088/0029-5515/38/2/302.
[18] D. Reiser, J. Romazanov, C. Linsmeier, J. Comput. Phys. 377 (2019) 219–231,
https://doi.org/10.1016/J.JCP.2018.07.051.
[19] H.P. Summers, The ADAS User Manual version 2.6, (2004).
[20] H. Qin, Phys. Plasmas 20 (8) (2013) 84503,https://doi.org/10.1063/1.4818428. [21] I. Borodkina, et al., Nucl. Mater. Energy 12 (2017) 341–345,https://doi.org/10.
1016/J.NME.2017.03.031.
[22] S. Brezinsek, et al., Nucl. Fusion 54 (10) (2014) 103001,https://doi.org/10.1088/ 0029-5515/54/10/103001.
[23] D. Borodin, et al., J. Nucl. Mater. 438 (SUPPL) (2013),https://doi.org/10.1016/j. jnucmat.2013.01.043.
[24] J.W. Coenen, et al., Nucl. Fusion 53 (7) (2013) 73043,https://doi.org/10.1088/ 0029-5515/53/7/073043.
[25] J. Miettunen, et al., J. Nucl. Mater. 438 (SUPPL) (2013) S612–S615,https://doi. org/10.1016/j.jnucmat.2013.01.128.
[26] P.C. Stangeby, The Plasma Boundary of Magnetic Fusion Devices, 43 (2000). [27] D. Borodin, et al., Phys. Scr. T159 (T159) (2014) 14057,https://doi.org/10.1088/
0031-8949/2014/T159/014057.
[28] M. Baldwin, T. Schwarz-Selinger, J. Yu, R. Doerner, J. Nucl. Mater. 438 (2013) S967–S970,https://doi.org/10.1016/J.JNUCMAT.2013.01.210.
[29] D. Matveev, et al., Nucl. Instrum. Methods Phys. Res. Sect. B 430 (2018) 23–30. [30] M.Z. Tokar, R. Ding, M. Koltunov, Plasma Phys. Control Fusion 52 (7) (2010)
075003,https://doi.org/10.1088/0741-3335/52/7/075003.
[31] R. Ding, et al., J. Nucl. Mater. 415 (1) (2011) S270–S273,https://doi.org/10.1016/ J.JNUCMAT.2010.09.037.
[32] C. Silva, et al., Nucl. Fusion 54 (8) (2014) 83022, https://doi.org/10.1088/0029-5515/54/8/083022.
[33] L. Frassinetti, et al., Rev. Sci. Instrum. 83 (1) (2012) 013506,https://doi.org/10. 1063/1.3673467.
[34] S. Brezinsek, et al., J. Nucl. Mater. 438 (SUPPL) (2013) S303—-S308,https://doi. org/10.1016/j.jnucmat.2013.01.122.
[35] D. Reiter, J. Nucl. Mater. 196–198 (1992) 80–89, https://doi.org/10.1016/S0022-3115(06)80014-0.
[36] R. Simonini, G. Corrigan, G. Radford, J. Spence, A. Taroni, Contrib. to Plasma Phys. 34 (2–3) (1994) 368–373,https://doi.org/10.1002/ctpp.2150340242.
[37] S. Wiesen, EDGE2D/EIRENE Code Interface Report, JET ITC-Report, Technical Report, (2006).
[38] K. Schmid, et al., Nucl. Fusion 55 (5) (2015) 53015, https://doi.org/10.1088/0029-5515/55/5/053015.
[39] K. Schmid, K. Krieger, S.W. Lisgo, G. Meisl, S. Brezinsek, J. Nucl. Mater. 463 (2015) 66–72,https://doi.org/10.1016/j.jnucmat.2014.11.109.
[40] A. Kirschner, et al., J. Nucl. Mater. 390–391 (2009) 152–155,https://doi.org/10. 1016/j.jnucmat.2009.01.155.
[41] A. Huber, et al., Rev. Sci. Instrum. 83 (10) (2012) 10D511,https://doi.org/10. 1063/1.4731759.
[42] S. Wiesen, et al., Nucl. Mater. Energy 12 (2017) 3–17,https://doi.org/10.1016/J. NME.2017.03.033.
[43] S. Wiesen, et al., J. Nucl. Mater. 463 (2015) 480–484,https://doi.org/10.1016/j. jnucmat.2014.10.012.
[44] M. Brix, et al., Rev. Sci. Instrum. 83 (10) (2012) 10D533,https://doi.org/10.1063/ 1.4739411.
[45] G. Arnoux, et al., Nucl. Fusion 53 (7) (2013) 073016,https://doi.org/10.1088/ 0029-5515/53/7/073016.
[46] H. Bufferand, et al., J. Nucl. Mater. 438 (SUPPL) (2013) S445—-S448,https://doi. org/10.1016/j.jnucmat.2013.01.090.
[47] Y. Feng, et al., Contrib. to Plasma Phys. 54 (4–6) (2014) 426–431,https://doi.org/ 10.1002/ctpp.201410092.