Korean J Intern Med 2017;32:323-334 https://doi.org/10.3904/kjim.2015.400
INTRODUCTION
Epidemiologic studies suggest that sleep duration may
adversely affect one’s health in a number of ways.
Inter-estingly, both short and long sleep durations have been
shown to be associated with increased risks of all-cause
1Department of Public Health,
Yonsei University Graduate School, Seoul; 2Cardiovascular and
Metabolic Disease Etiology Research Center, 3Department of Preventive
Medicine, Yonsei University College of Medicine, Seoul, Korea;
4Department of Preventive Medicine,
Northwestern University Feinberg School of Medicine, Chicago, IL, USA
Received : December 24, 2015 Revised : May 13, 2016 Accepted : May 15, 2016 Correspondence to Hyeon Chang Kim, M.D.
Department of Preventive Medicine, Yonsei University College of Medicine, 50-1 Yonsei-ro, Seodaemun-gu, Seoul 03722, Korea
Tel: +82-2-2228-1883 Fax: +82-2-392-8133 E-mail: [email protected]
Background/Aims:
Sleep duration affects health in various ways. The objective of
this study was to investigate the associations of sleep duration with chronic
kid-ney disease (CKD) in a Korean adult population.
Methods:
This cross-sectional analysis was conducted for total of 1,360
partici-pants who completed baseline health examinations for the Korean Genome and
Epidemiology Study-Kangwha study in 2010 to 2011. Sleep habits were measured
by an interviewer-assisted questionnaire. Sleep duration was calculated based on
the number of hours per day participants had slept over the past 1 year. CKD was
defined as either proteinuria or estimated glomerular filtration rate (eGFR) < 60
mL/min/1.73 m². Multiple logistic regression models were applied to examine
as-sociations between sleep duration and CKD.
Results:
Women with very long sleep duration (≥ 9 hours/day) were at
significant-ly increased odds for having high serum creatinine (odds ratio [OR], 2.936; 95%
confidence interval [CI], 1.176 to 7.326), low eGFR (OR, 3.320; 95% CI, 1.372 to 8.034),
and CKD (OR, 3.112; 95% CI, 1.315 to 7.363), compared those with a typical sleep
duration (7 to < 8 hours/day), after adjusting for sociodemographic status,
socio-economic status, health behaviors, comorbidities, and sleep quality. Among
wom-en, for every 1 hour increase in sleep duration per day, there was a 24.6% increase
in the presence of CKD (OR, 1.246; 95% CI, 1.019 to 1.523). However, among men,
sleep duration was not significantly associated with CKD.
Conclusions:
Very long sleep duration was independently associated with a
high-er prevalence of CKD among Korean women. Gendhigh-er may influence this
associa-tion.
Keywords: Sleep duration; Sleep quantity; Renal insufficiency, chronic; Kidney
function; General population
Sleep duration and chronic kidney disease:
The Korean Genome and Epidemiology Study
(KoGES)-Kangwha study
mortality, cardiovascular disease, and other chronic
diseases [1-3]. Meanwhile, sleeping habits in the general
population reflect a complexity of interactions related
to the presence of comorbid medical conditions and
physical, psychological, social, and lifestyle factors.
Chronic kidney disease (CKD) has emerged as a public
health problem worldwide, with reports of increasing
prevalence and adverse complications [4-7]. Moreover,
CKD has been recognized as a predictor of end-stage
kidney disease and cardiometabolic disease [4].
Nev-ertheless, adverse outcomes of CKD can be prevented
through early detection, education, treatment, and
in-tervention to modify harmful lifestyle factors [8,9]. In
particular, changing one’s sleep duration may be
effec-tive in preventing CKD. Although cross-sectional and
prospective epidemiologic studies have suggested that
sleep quality is a significant risk factor for CKD [10,11],
little is known of the association between sleep quantity
and CKD [8,12,13]. While a few studies have suggested
that sleep duration can influence kidney function,
dis-tinct associations remain unclear. Therefore, we aimed
to investigate the relationships between sleep duration
and CKD in a Korean adult population.
METHODS
Study population
Data for the present study were derived from the Korean
Genome and Epidemiology Study (KoGES)-Kangwha
study, an ongoing rural community-based prospective
cohort. During the baseline survey period from 2006 to
2011, the KoGES-Kangwha study enrolled 4,899
com-munity dwellers from Kangwha Island, Incheon, South
Korea. Current cross-sectional analysis was conducted
for a total of 1,360 participants who completed the
ques-tionnaire concerning sleep (544 men and 816 women
aged 36 to 88 years) in 2010 to 2011. All participants
pro-vided written informed consent, and the Institutional
Review Board of Severance Hospital, Yonsei University
College of Medicine, approved the study protocol.
Measurements
Trained interviewers obtained information on the
par-ticipants’ demographic characteristics, socioeconomic
status (household income, marital status, and working
status), previously known diseases, medication use,
and health behaviors (sleep, cigarette smoking, alcohol
intake, and physical activity) using standardized
ques-tionnaires. Depressive symptoms were assessed using
the Beck Depression Inventory (BDI), and depression
was determined on the basis of BDI score of ≥ 16 or a
self-reported physician’s diagnosis [14]. Smoking
sta-tus, alcohol consumption, and physical activity were
categorized as either current or non-current.
Sleep habits were measured by an
interviewer-assist-ed questionnaire. Participants were askinterviewer-assist-ed to report the
number of hours per day they had slept over the past 1
year, including naps, whether they had trouble falling
asleep, whether they had trouble getting back to sleep
after they had awaken, snoring behaviors, and the
pres-ence of sleep apnea. In the present study, average sleep
durations were defined as the total time in bed per day
(calculated from bedtime, rise time, and naps).
Partici-pants were divided into five groups based upon their
re-ported sleep duration: < 6 hours/day, “very short
sleep-ers”; 6 to < 7 hours/day, “short sleepsleep-ers”; 7 to < 8 hours/
day, “usual sleepers (reference group)”; 8 to < 9 hours/
day, “long sleepers”; and ≥ 9 hours/day, “very long
sleep-ers.”
All participants completed health examinations,
in-cluding anthropometric measurements, blood pressure
measurements, blood laboratory tests, bone mineral
density measurements, and electrocardiography. Body
weight was measured to the nearest 0.1 kg on a
digi-tal scale (GL-60000-20, CAS Korea, Seoul, Korea), and
standing height was measured to the nearest 0.1 cm on
a stadiometer (SECA 225, SECA, Hamburg, Germany).
Body mass index (BMI) was calculated as body weight
(kg) divided by standing height (m²). Resting blood
pres-sures were measured twice at a 5-minute interval using
an automatic sphygmomanometer (Dinamap 1846 SX/P,
GE Healthcare, Waukesha, WI, USA). Additional
surements were performed, if the first and second
mea-surements differed by ≥ 10 mmHg for either systolic or
diastolic blood pressure, and the average of the last two
measurements was used for analysis.
Fasting blood samples were collected from the
ante-cubital vein after at least an 8-hour fast. Blood samples
were sent to an independent research laboratory center
for analysis. Serum creatinine concentrations and blood
urea nitrogen concentrations were measured by the
col-orimetric methods, and serum concentrations of
cho-lesterol were measured by enzymatic methods with an
automatic analyzer (ADVIA 1650, Siemens, Tarrytown,
NY, USA in 2010; ADVIA 1800, Siemens in 2011).
Dia-betes mellitus was determined on the basis of fasting
glucose concentration (≥ 126 mg/dL) or a self-reported
physician’s diagnosis [15]. Hypercholesterolemia was
de-fined (according to the Korean Society of Lipidology and
Atherosclerosis criteria) as a total cholesterol
concentra-tion ≥ 230 mg/dL [16], taking a lipid-lowering drug, or a
self-reported physician’s diagnosis.
Kidney function was estimated by serum creatinine
concentration, presence of proteinuria, and estimated
glomerular filtration rate (eGFR). Serum creatinine
con-centration cutoffs were sex specific, corresponding to
the study design, with cutoffs of > 1.3 mg/dL for men and
> 1.0 mg/dL for women. The intra-assay coefficients of
variation were 1.7% at 1.8 mg/dL and 1.3% at 8.4 mg/dL.
The total coefficients of variation were 3.8% at 1.8 mg/
dL and 3.7% at 8.4 mg/dL. Proteinuria was diagnosed as
1+ or more by semiquantitative dipstick test. An eGFR
was calculated using the modification of diet in renal
disease study equation [17] as follows: 186 ×
(creati-nine/88.4)
–1.154× (age)
–0.203× (0.742 if female). The
diag-nosis of CKD was defined as either kidney damage or
an eGFR of < 60 mL/min/1.73 m², according to criteria
set by the National Kidney Foundation Kidney Disease
Outcomes Quality Initiative [18].
Statistical analysis
The distribution of continuous variables was described
as means with standard deviations and compared
us-ing one-way analysis of variance. Categorical variables
were reported as observed numbers and percentages,
and compared using the chi-square test. A general
linear model using contrast coefficients was used for
linear trend analysis of continuous variables, and
Co-chran-Armitage test and Mantel-Haenszel test were
used for categorical variables. Multiple linear
regres-sion models were used to assess the independent
as-sociation between sleep duration and CKD. Sex, age,
BMI, systolic blood pressure, smoking status, alcohol
consumption, physical activity, diabetes mellitus,
hy-percholesterolemia, depression, history of
cardiovas-cular disease, history of cancer, menopausal status,
so-cioeconomic status (household income, marital status,
and working status), and sleep quality (sleep difficulty,
sleep awakeness, snoring, and sleep apnea) were
con-sidered as covariates in the model. In addition,
mul-tiple logistic regression models were used to estimate
odds ratios (OR) with 95% confidence intervals (CI) for
CKD criteria. We performed statistical analyses on the
total population, as well as men and women separately,
because we found significant sex differences in kidney
function. We plotted serum creatinine concentration
and eGFR versus average sleep duration expressed on
a continuous scale using cubic spline models. In a
sen-sitivity analysis, we calculated age-specific
sex-strat-ified ORs for CKD across the average sleep duration.
An additional multiple logistic regression analysis was
conducted excluding participants with hypertension
(n = 516), diabetes mellitus (n = 165), and a history of
cardiovascular disease (n = 103). All statistical analyses
were performed using SAS software version 9.2 (SAS,
Cary, NC, USA), and statistical significance was defined
as a two-sided p value of less than 0.05.
RESULTS
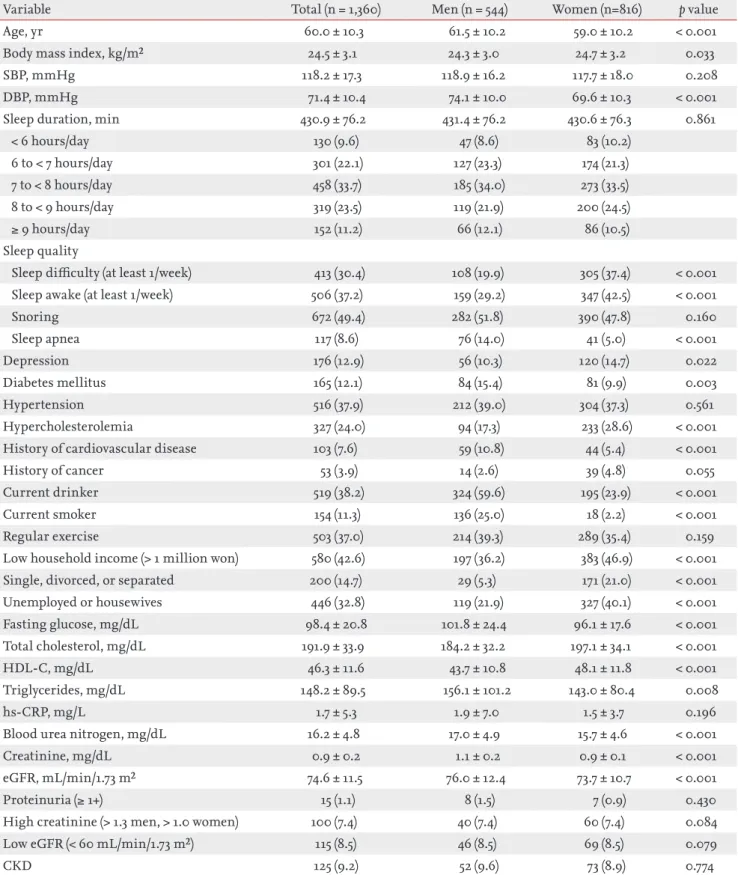
The baseline characteristics of all participants are
presented in Table 1. Of 1,360 participants, there were
130 very short sleepers (< 6 hours/day, 9.6%), 301 short
sleepers (6 to < 7 hours/day, 22.1%), 458 usual sleepers (7
to < 8 hours/day, 33.7%), 319 long sleepers (8 to < 9 hours/
day, 23.5%), and 152 very long sleepers (≥ 9 hours/day,
11.2%). Among men, the percentages of participants
who slept < 6 and ≥ 9 hours were 8.6% and 12.1%,
re-spectively. Among women, the corresponding
percent-ages were 10.2% and 10.5%, respectively. The number
of participants with a very short sleep duration was
greater for women than for men, and the number of
participants with a very long sleep duration was
small-er for women than for men. The mean sleep duration
was 431.4 minutes/day for men and 430.6 minutes/day
for women. The mean serum creatinine concentration
was 1.1 mg/dL for men and 0.9 mg/dL for women, and
was thus significantly higher among men. The
preva-lence of high serum creatinine concentration was 7.4%
among both men and women. The mean eGFR was
76.0 mL/min/1.73 m² for men and 73.7 mL/min/1.73 m²
for women, and was thus significantly higher among
Table 1. Baseline characteristics of the study population (n = 1,360)
Variable Total (n = 1,360) Men (n = 544) Women (n=816) p value
Age, yr 60.0 ± 10.3 61.5 ± 10.2 59.0 ± 10.2 < 0.001
Body mass index, kg/m² 24.5 ± 3.1 24.3 ± 3.0 24.7 ± 3.2 0.033
SBP, mmHg 118.2 ± 17.3 118.9 ± 16.2 117.7 ± 18.0 0.208
DBP, mmHg 71.4 ± 10.4 74.1 ± 10.0 69.6 ± 10.3 < 0.001
Sleep duration, min 430.9 ± 76.2 431.4 ± 76.2 430.6 ± 76.3 0.861
< 6 hours/day 130 (9.6) 47 (8.6) 83 (10.2) 6 to < 7 hours/day 301 (22.1) 127 (23.3) 174 (21.3) 7 to < 8 hours/day 458 (33.7) 185 (34.0) 273 (33.5) 8 to < 9 hours/day 319 (23.5) 119 (21.9) 200 (24.5) ≥ 9 hours/day 152 (11.2) 66 (12.1) 86 (10.5) Sleep quality
Sleep difficulty (at least 1/week) 413 (30.4) 108 (19.9) 305 (37.4) < 0.001 Sleep awake (at least 1/week) 506 (37.2) 159 (29.2) 347 (42.5) < 0.001
Snoring 672 (49.4) 282 (51.8) 390 (47.8) 0.160 Sleep apnea 117 (8.6) 76 (14.0) 41 (5.0) < 0.001 Depression 176 (12.9) 56 (10.3) 120 (14.7) 0.022 Diabetes mellitus 165 (12.1) 84 (15.4) 81 (9.9) 0.003 Hypertension 516 (37.9) 212 (39.0) 304 (37.3) 0.561 Hypercholesterolemia 327 (24.0) 94 (17.3) 233 (28.6) < 0.001
History of cardiovascular disease 103 (7.6) 59 (10.8) 44 (5.4) < 0.001
History of cancer 53 (3.9) 14 (2.6) 39 (4.8) 0.055
Current drinker 519 (38.2) 324 (59.6) 195 (23.9) < 0.001
Current smoker 154 (11.3) 136 (25.0) 18 (2.2) < 0.001
Regular exercise 503 (37.0) 214 (39.3) 289 (35.4) 0.159
Low household income (> 1 million won) 580 (42.6) 197 (36.2) 383 (46.9) < 0.001 Single, divorced, or separated 200 (14.7) 29 (5.3) 171 (21.0) < 0.001
Unemployed or housewives 446 (32.8) 119 (21.9) 327 (40.1) < 0.001 Fasting glucose, mg/dL 98.4 ± 20.8 101.8 ± 24.4 96.1 ± 17.6 < 0.001 Total cholesterol, mg/dL 191.9 ± 33.9 184.2 ± 32.2 197.1 ± 34.1 < 0.001 HDL-C, mg/dL 46.3 ± 11.6 43.7 ± 10.8 48.1 ± 11.8 < 0.001 Triglycerides, mg/dL 148.2 ± 89.5 156.1 ± 101.2 143.0 ± 80.4 0.008 hs-CRP, mg/L 1.7 ± 5.3 1.9 ± 7.0 1.5 ± 3.7 0.196
Blood urea nitrogen, mg/dL 16.2 ± 4.8 17.0 ± 4.9 15.7 ± 4.6 < 0.001
Creatinine, mg/dL 0.9 ± 0.2 1.1 ± 0.2 0.9 ± 0.1 < 0.001
eGFR, mL/min/1.73 m² 74.6 ± 11.5 76.0 ± 12.4 73.7 ± 10.7 < 0.001
Proteinuria (≥ 1+) 15 (1.1) 8 (1.5) 7 (0.9) 0.430
High creatinine (> 1.3 men, > 1.0 women) 100 (7.4) 40 (7.4) 60 (7.4) 0.084
Low eGFR (< 60 mL/min/1.73 m²) 115 (8.5) 46 (8.5) 69 (8.5) 0.079
CKD 125 (9.2) 52 (9.6) 73 (8.9) 0.774
Values are presented as mean ± SD or number (%).
SBP, systolic blood pressure; DBP, diastolic blood pressure; HDL-C, high density lipoprotein cholesterol; hs-CRP, high-sensi-tivity C-reactive protein; eGFR, estimated glomerular filtration rate; CKD, chronic kidney disease.
men. The prevalence of low eGFR was 8.5% among both
men and women. The overall prevalence of CKD was
9.6% among men and 8.9% among women; the
differ-ence was not statistically significant. The prevaldiffer-ences
of CKD according to stage are presented in
Supplemen-tary Table 1.
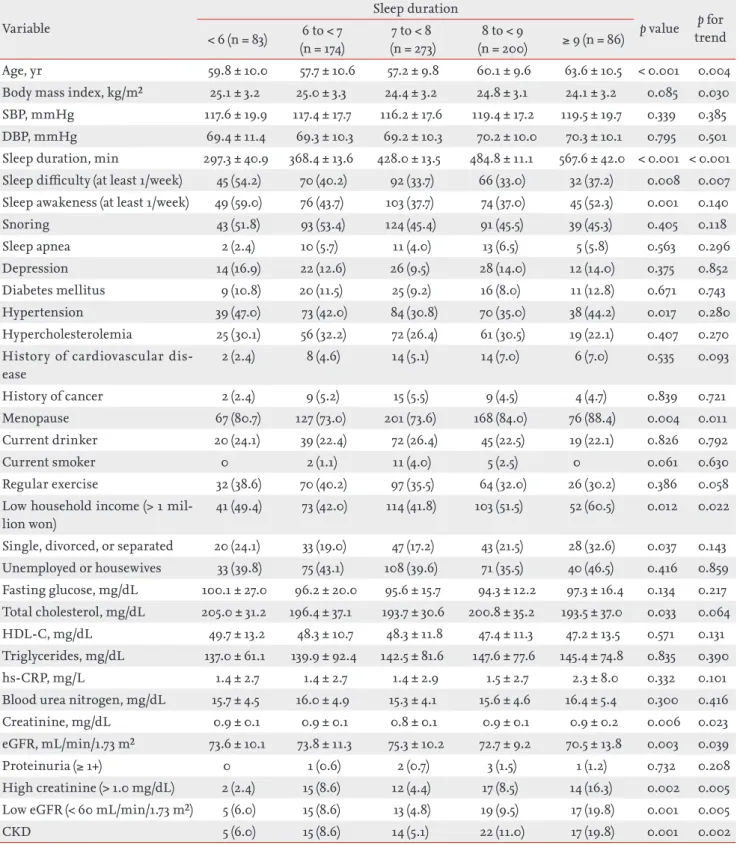
The general characteristics of the male and female
participants are presented according to sleep duration
category in Tables 2 and 3. In both men and women,
mean age was highest among very long sleepers. In men,
individuals with a very long sleep duration were more
likely to be short, weigh less, and comprise a higher
frequency of unemployed men. Among men, we noted
no significant associations between sleep duration and
serum creatinine concentration, eGFR, and CKD
preva-lence. In women, individuals with a very long duration
were more likely to have a lower BMI, a higher
frequen-cy of menopause, and the lowest household income.
Moreover, among women, we observed significantly
dif-ferent distributions for serum creatinine levels, eGFR,
and CKD prevalence according to sleep duration.
Nev-ertheless, in both men and women, very long sleepers
showed the highest prevalences of CKD.
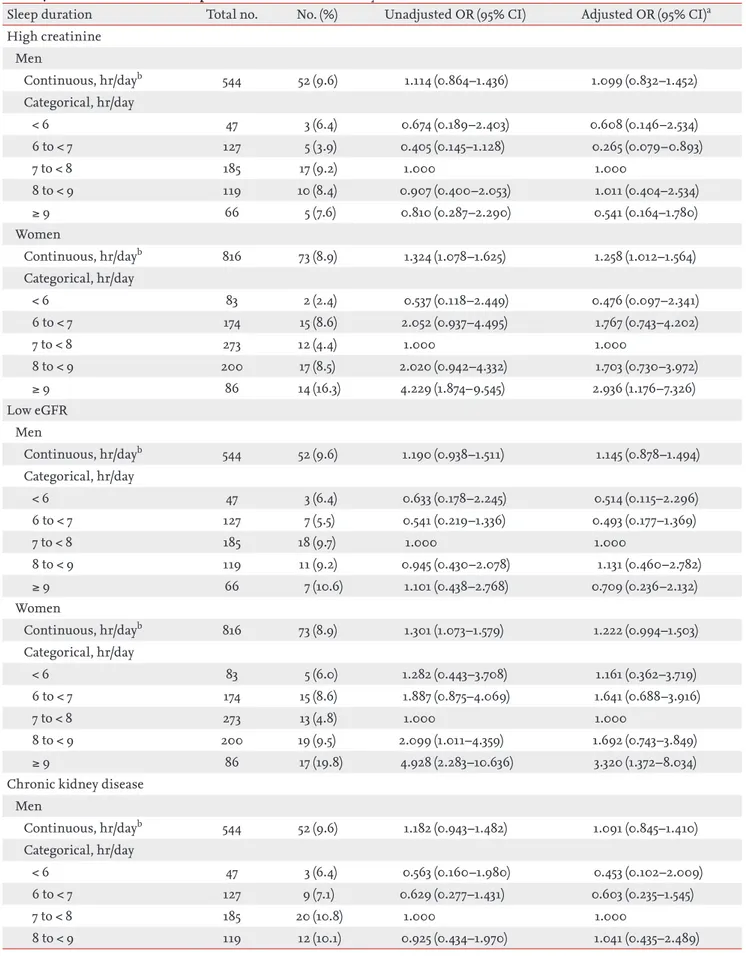
Table 4 showed the result of the multiple linear
re-gression analysis of the associations between sleep
du-ration and CKD. Adjusted ORs for kidney functions and
its components were estimated in separate models with
average sleep duration assessed as a continuous variable
in one and a categorical variable in the other. Among
women, the longest sleep duration was significantly
as-sociated with high serum creatinine concentrations, low
eGFR, and presence of CKD in the unadjusted model.
Af-ter additional adjustment for sociodemographic status,
socioeconomic status, health behaviors, comorbidities,
and sleep quality, the associations remained significant.
Women who slept ≥ 9 hours/day showed significantly
increased odds for having high serum creatinine
con-centrations (OR, 2.936; 95% CI, 1.176 to 7.326), low eGFR
(OR, 3.320; 95% CI, 1.372 to 8.034), and CKD (OR, 3.112;
95% CI, 1.315 to 7.363), compared to the reference group
(sleep duration of 7 to < 8 hours/day). Among women, for
every 1 hour increase in sleep duration per day, there was
a 24.6% increase in the presence of CKD after adjusting
for covariates. As a further visual cue, cubic splines were
used to display the relationship between average sleep
duration and kidney function (Supplementary Fig. 1).
Women who slept more than 8 hours per day exhibited
higher serum creatinine concentration and lower eGFR
than the reference group. As shown in Fig. 1, the ORs
(95% CI) for high serum creatinine concentration, low
eGFR, and presence of CKD was the highest among
fe-male very long sleepers. Among men, there were no
sig-nificant associations between sleep duration and high
serum creatinine concentration, low eGFR, and
pres-ence of CKD.
In the sensitivity analysis (Supplementary Tables 2
and 3), we found that sleeping more than 8 hours was
significantly associated with CKD (OR, 2.699; 95% CI,
1.065 to 6.841) in women of older age (60 years or
old-er) when stratified according to the median age. Among
younger women (less than 60 years), there were no
sig-nificant associations between sleep duration and kidney
function; however, increases in average sleep duration
tended to increase the risk for CKD. Additionally, we
repeated the logistic regression analysis after excluding
participants with hypertension, diabetes mellitus, and a
history of cardiovascular disease (Supplementary Table
4), and the association trend was quite consistent.
DISCUSSION
We investigated the associations between sleep
dura-tion and CKD in a Korean adult populadura-tion. Herein,
sleeping more than 9 hours was significantly
associ-ated with CKD in women; however, sleep duration was
not significantly associated with CKD in men.
In recent decades, the average sleep duration in most
individuals has reduced, and many studies have
in-vestigated shorter sleep durations and their effects on
health. In particular, the average sleep duration of
Ko-reans was 7 hours and 49 minutes per day, which was
the lowest among 18 OECD (Organisation for Economic
Co-operation and Development) member countries [19].
Notwithstanding, epidemiological evidence of
associa-tions between sleep duration and CKD is insufficient.
Previous studies reported that sleeping less than 5 hours
was associated with proteinuria in the Japanese
pop-ulation [8,20] and higher risk of CKD among the shift
workers [13]. More recently, an increasing number of
studies have linked prolonged sleep duration with poor
health effects [21,22]. However, studies have yet to
iden-tify whether these same relationships exists in people
who sleep longer.
In the present study of 1360 Koreans, the overall
prev-alence of CKD was 9.2% (9.6% for men and 8.9% in
women), similar to other results. According to data from
the National Health and Nutrition Examination Surveys
Table 2. Characteristics of the study participants according to sleep duration in men (n = 544)Variable Sleep duration p value trendp for
< 6 (n = 47) 6 to < 7 (n = 127) 7 to < 8 (n = 185) 8 to < 9 (n = 119) ≥ 9 (n = 66)
Age, yr 59.4 ± 10.6 59.5 ± 10.4 61.4 ± 9.8 62.3 ± 9.2 65.6 ± 11.2 0.001 < 0.001 Body mass index, kg/m² 24.2 ± 3.5 24.3 ± 3.0 24.6 ± 2.9 24.1 ± 3.1 23.9 ± 2.7 0.424 0.510 SBP, mmHg 117.4 ± 16.0 118.4 ± 14.9 119.1 ± 15.5 119.0 ± 17.3 120.0 ± 18.4 0.935 0.387 DBP, mmHg 73.2 ± 10.6 74.1 ± 10.6 73.7 ± 9.1 75.1 ± 9.7 73.6 ± 11.1 0.765 0.714 Sleep duration, min 290.9 ± 38.4 368.0 ± 13.6 428.1 ± 13.3 487.2 ± 13.2 561.8 ± 33.1 < 0.001 < 0.001 Sleep difficulty (at least 1/week) 17 (36.2) 29 (22.8) 31 (16.8) 13 (10.9) 18 (27.3) 0.001 0.058 Sleep awakeness (at least 1/week) 17 (36.2) 35 (27.6) 55 (29.7) 33 (27.7) 19 (28.8) 0.840 0.573
Snoring 29 (61.7) 68 (53.5) 91 (49.2) 63 (52.9) 31 (47.0) 0.528 0.209 Sleep apnea 8 (17.0) 20 (15.7) 25 (13.5) 16 (13.4) 7 (10.6) 0.848 0.265 Depression 6 (12.8) 8 (6.3) 10 (5.4) 8 (6.7) 6 (9.1) 0.451 0.755 Diabetes mellitus 6 (12.8) 14 (11.0) 27 (14.6) 26 (21.8) 11 (16.7) 0.194 0.069 Hypertension 21 (44.7) 42 (33.1) 69 (37.3) 52 (43.7) 28 (42.4) 0.384 0.339 Hypercholesterolemia 7 (14.9) 20 (15.7) 36 (19.5) 22 (18.5) 9 (13.6) 0.783 0.935 History of cardiovascular disease 4 (8.5) 7 (5.5) 25 (13.5) 16 (13.4) 7 (10.6) 0.185 0.152
History of cancer 2 (4.3) 1 (0.8) 5 (2.7) 5 (4.2) 1 (1.5) 0.447 0.769
Current drinker 26 (55.3) 78 (61.4) 117 (63.2) 65 (54.6) 38 (57.6) 0.577 0.596 Current smoker 11 (23.4) 35 (27.6) 44 (23.8) 27 (22.7) 19 (28.8) 0.827 0.965 Regular exercise 18 (38.3) 58 (45.7) 68 (36.8) 53 (44.5) 17 (25.8) 0.058 0.145 Low household income
(> 1 million won)
20 (42.6) 48 (37.8) 59 (31.9) 40 (33.6) 30 (45.5) 0.264 0.929 Single, divorced, or separated 4 (8.5) 10 (7.9) 6 (3.2) 3 (2.5) 6 (9.1) 0.096 0.438 Unemployed or housewives 8 (17.0) 23 (18.1) 38 (20.5) 26 (21.8) 24 (36.4) 0.040 0.009 Fasting glucose, mg/dL 98.4 ± 28.7 100.4 ± 23.8 102.5 ± 23.5 101.7 ± 22.4 105.5 ± 28.5 0.558 0.115 Total cholesterol, mg/dL 183.9 ± 32.0 185.6 ± 31.2 184.7 ± 32.0 182.9 ± 34.0 182.3 ± 32.3 0.947 0.697 HDL-C, mg/dL 44.0 ± 10.6 43.7 ± 11.2 43.9 ± 10.7 43.9 ± 11.0 42.5 ± 10.5 0.911 0.490 Triglycerides, mg/dL 141.4 ± 80.4 163.1 ± 114.7 158.3 ± 99.6 156.4 ± 100.2 147.1 ± 94.2 0.700 0.859 hs-CRP, mg/L 1.6 ± 2.3 2.0 ± 7.7 1.5 ± 2.4 2.8 ± 12.3 1.3 ± 1.8 0.516 0.967 Blood urea nitrogen, mg/dL 17.4 ± 4.9 16.5 ± 4.6 16.9 ± 4.6 17.4 ± 5.6 17.6 ± 5.1 0.441 0.545 Creatinine, mg/dL 1.1 ± 0.1 1.1 ± 0.2 1.1 ± 0.2 1.1 ± 0.2 1.1 ± 0.2 0.919 0.415 eGFR, mL/min/1.73 m² 77.2 ± 12.4 76.8 ± 10.7 75.6 ± 11.5 76.3 ± 15.1 74.1 ± 12.6 0.598 0.172
Proteinuria (≥ 1+) 0 2 (1.6) 3 (1.6) 2 (1.7) 1 (1.5) 0.941 0.624
High creatinine (> 1.3 mg/dL) 3 (6.4) 5 (3.9) 17 (9.2) 10 (8.4) 5 (7.6) 0.501 0.324 Low eGFR (< 60 mL/min/1.73 m²) 3 (6.4) 7 (5.5) 18 (9.7) 11 (9.2) 7 (10.6) 0.634 0.197
CKD 3 (6.4) 9 (7.1) 20 (10.8) 12 (10.1) 8 (12.1) 0.677 0.192
Values are presented as mean ± SD or number (%).
SBP, systolic blood pressure; DBP, diastolic blood pressure; HDL-C, high density lipoprotein cholesterol; hs-CRP, high-sensi-tivity C-reactive protein; eGFR, estimated glomerular filtration rate; CKD, chronic kidney disease.
Table 3. Characteristics of the study participants according to sleep duration in women (n = 816) Variable
Sleep duration
p value trendp for
< 6 (n = 83) (n = 174)6 to < 7 (n = 273)7 to < 8 (n = 200)8 to < 9 ≥ 9 (n = 86)
Age, yr 59.8 ± 10.0 57.7 ± 10.6 57.2 ± 9.8 60.1 ± 9.6 63.6 ± 10.5 < 0.001 0.004 Body mass index, kg/m² 25.1 ± 3.2 25.0 ± 3.3 24.4 ± 3.2 24.8 ± 3.1 24.1 ± 3.2 0.085 0.030 SBP, mmHg 117.6 ± 19.9 117.4 ± 17.7 116.2 ± 17.6 119.4 ± 17.2 119.5 ± 19.7 0.339 0.385 DBP, mmHg 69.4 ± 11.4 69.3 ± 10.3 69.2 ± 10.3 70.2 ± 10.0 70.3 ± 10.1 0.795 0.501 Sleep duration, min 297.3 ± 40.9 368.4 ± 13.6 428.0 ± 13.5 484.8 ± 11.1 567.6 ± 42.0 < 0.001 < 0.001 Sleep difficulty (at least 1/week) 45 (54.2) 70 (40.2) 92 (33.7) 66 (33.0) 32 (37.2) 0.008 0.007 Sleep awakeness (at least 1/week) 49 (59.0) 76 (43.7) 103 (37.7) 74 (37.0) 45 (52.3) 0.001 0.140
Snoring 43 (51.8) 93 (53.4) 124 (45.4) 91 (45.5) 39 (45.3) 0.405 0.118 Sleep apnea 2 (2.4) 10 (5.7) 11 (4.0) 13 (6.5) 5 (5.8) 0.563 0.296 Depression 14 (16.9) 22 (12.6) 26 (9.5) 28 (14.0) 12 (14.0) 0.375 0.852 Diabetes mellitus 9 (10.8) 20 (11.5) 25 (9.2) 16 (8.0) 11 (12.8) 0.671 0.743 Hypertension 39 (47.0) 73 (42.0) 84 (30.8) 70 (35.0) 38 (44.2) 0.017 0.280 Hypercholesterolemia 25 (30.1) 56 (32.2) 72 (26.4) 61 (30.5) 19 (22.1) 0.407 0.270 History of cardiovascular
dis-ease 2 (2.4) 8 (4.6) 14 (5.1) 14 (7.0) 6 (7.0) 0.535 0.093 History of cancer 2 (2.4) 9 (5.2) 15 (5.5) 9 (4.5) 4 (4.7) 0.839 0.721 Menopause 67 (80.7) 127 (73.0) 201 (73.6) 168 (84.0) 76 (88.4) 0.004 0.011 Current drinker 20 (24.1) 39 (22.4) 72 (26.4) 45 (22.5) 19 (22.1) 0.826 0.792 Current smoker 0 2 (1.1) 11 (4.0) 5 (2.5) 0 0.061 0.630 Regular exercise 32 (38.6) 70 (40.2) 97 (35.5) 64 (32.0) 26 (30.2) 0.386 0.058 Low household income (> 1
mil-lion won)
41 (49.4) 73 (42.0) 114 (41.8) 103 (51.5) 52 (60.5) 0.012 0.022 Single, divorced, or separated 20 (24.1) 33 (19.0) 47 (17.2) 43 (21.5) 28 (32.6) 0.037 0.143 Unemployed or housewives 33 (39.8) 75 (43.1) 108 (39.6) 71 (35.5) 40 (46.5) 0.416 0.859 Fasting glucose, mg/dL 100.1 ± 27.0 96.2 ± 20.0 95.6 ± 15.7 94.3 ± 12.2 97.3 ± 16.4 0.134 0.217 Total cholesterol, mg/dL 205.0 ± 31.2 196.4 ± 37.1 193.7 ± 30.6 200.8 ± 35.2 193.5 ± 37.0 0.033 0.064 HDL-C, mg/dL 49.7 ± 13.2 48.3 ± 10.7 48.3 ± 11.8 47.4 ± 11.3 47.2 ± 13.5 0.571 0.131 Triglycerides, mg/dL 137.0 ± 61.1 139.9 ± 92.4 142.5 ± 81.6 147.6 ± 77.6 145.4 ± 74.8 0.835 0.390 hs-CRP, mg/L 1.4 ± 2.7 1.4 ± 2.7 1.4 ± 2.9 1.5 ± 2.7 2.3 ± 8.0 0.332 0.101 Blood urea nitrogen, mg/dL 15.7 ± 4.5 16.0 ± 4.9 15.3 ± 4.1 15.6 ± 4.6 16.4 ± 5.4 0.300 0.416 Creatinine, mg/dL 0.9 ± 0.1 0.9 ± 0.1 0.8 ± 0.1 0.9 ± 0.1 0.9 ± 0.2 0.006 0.023 eGFR, mL/min/1.73 m² 73.6 ± 10.1 73.8 ± 11.3 75.3 ± 10.2 72.7 ± 9.2 70.5 ± 13.8 0.003 0.039
Proteinuria (≥ 1+) 0 1 (0.6) 2 (0.7) 3 (1.5) 1 (1.2) 0.732 0.208
High creatinine (> 1.0 mg/dL) 2 (2.4) 15 (8.6) 12 (4.4) 17 (8.5) 14 (16.3) 0.002 0.005 Low eGFR (< 60 mL/min/1.73 m²) 5 (6.0) 15 (8.6) 13 (4.8) 19 (9.5) 17 (19.8) 0.001 0.005
CKD 5 (6.0) 15 (8.6) 14 (5.1) 22 (11.0) 17 (19.8) 0.001 0.002
Values are presented as mean ± SD or number (%).
SBP, systolic blood pressure; DBP, diastolic blood pressure; HDL-C, high density lipoprotein cholesterol; hs-CRP, high-sensi-tivity C-reactive protein; eGFR, estimated glomerular filtration rate; CKD, chronic kidney disease.
Table 4. Association between sleep duration and chronic kidney disease criteria
Sleep duration Total no. No. (%) Unadjusted OR (95% CI) Adjusted OR (95% CI)a High creatinine Men Continuous, hr/dayb 544 52 (9.6) 1.114 (0.864–1.436) 1.099 (0.832–1.452) Categorical, hr/day < 6 47 3 (6.4) 0.674 (0.189–2.403) 0.608 (0.146–2.534) 6 to < 7 127 5 (3.9) 0.405 (0.145–1.128) 0.265 (0.079–0.893) 7 to < 8 185 17 (9.2) 1.000 1.000 8 to < 9 119 10 (8.4) 0.907 (0.400–2.053) 1.011 (0.404–2.534) ≥ 9 66 5 (7.6) 0.810 (0.287–2.290) 0.541 (0.164–1.780) Women Continuous, hr/dayb 816 73 (8.9) 1.324 (1.078–1.625) 1.258 (1.012–1.564) Categorical, hr/day < 6 83 2 (2.4) 0.537 (0.118–2.449) 0.476 (0.097–2.341) 6 to < 7 174 15 (8.6) 2.052 (0.937–4.495) 1.767 (0.743–4.202) 7 to < 8 273 12 (4.4) 1.000 1.000 8 to < 9 200 17 (8.5) 2.020 (0.942–4.332) 1.703 (0.730–3.972) ≥ 9 86 14 (16.3) 4.229 (1.874–9.545) 2.936 (1.176–7.326) Low eGFR Men Continuous, hr/dayb 544 52 (9.6) 1.190 (0.938–1.511) 1.145 (0.878–1.494) Categorical, hr/day < 6 47 3 (6.4) 0.633 (0.178–2.245) 0.514 (0.115–2.296) 6 to < 7 127 7 (5.5) 0.541 (0.219–1.336) 0.493 (0.177–1.369) 7 to < 8 185 18 (9.7) 1.000 1.000 8 to < 9 119 11 (9.2) 0.945 (0.430–2.078) 1.131 (0.460–2.782) ≥ 9 66 7 (10.6) 1.101 (0.438–2.768) 0.709 (0.236–2.132) Women Continuous, hr/dayb 816 73 (8.9) 1.301 (1.073–1.579) 1.222 (0.994–1.503) Categorical, hr/day < 6 83 5 (6.0) 1.282 (0.443–3.708) 1.161 (0.362–3.719) 6 to < 7 174 15 (8.6) 1.887 (0.875–4.069) 1.641 (0.688–3.916) 7 to < 8 273 13 (4.8) 1.000 1.000 8 to < 9 200 19 (9.5) 2.099 (1.011–4.359) 1.692 (0.743–3.849) ≥ 9 86 17 (19.8) 4.928 (2.283–10.636) 3.320 (1.372–8.034)
Chronic kidney disease Men Continuous, hr/dayb 544 52 (9.6) 1.182 (0.943–1.482) 1.091 (0.845–1.410) Categorical, hr/day < 6 47 3 (6.4) 0.563 (0.160–1.980) 0.453 (0.102–2.009) 6 to < 7 127 9 (7.1) 0.629 (0.277–1.431) 0.603 (0.235–1.545) 7 to < 8 185 20 (10.8) 1.000 1.000 8 to < 9 119 12 (10.1) 0.925 (0.434–1.970) 1.041 (0.435–2.489)
(NHANES) in the United States, the overall prevalences
of CKD were 10.0% in 1988 to 1994 and 13.1% in 1999 to
2004 [4]. The overall prevalences of CKD in Asian adult
populations are 12.9% in Japan [5] and 10.8% in China
[6]. The overall prevalence of CKD in the Korea National
Health and Nutrition Examination Survey (KNHANES) I
to IV ranges from 3.9% to 7.9% in men and 6.3% to 12.0%
in women, respectively [7].
Although plausible biological mechanisms for the
re-lationship between short sleep duration and CKD have
been proposed, it is less clear as to how long sleep
du-ration is associated with CKD prevalence. The temporal
associations between sleep duration and CKD are likely
to be bi-directional; nevertheless, as long sleep duration
could be either an initial symptom or a consequence of
unmeasured diseases and conditions among CKD
pa-tients, any causality cannot be inferred from the
pres-ent data. Previous studies have also suggested that the
association of long sleep duration with CKD could be
explained by residual confounding and comorbidities
[3,23]. Accordingly, potential confounders could
predis-pose individuals to both long sleep duration and poor
kidney function. Thus, to reduce the effects of
unmea-sured confounders on our results, we adjusted for
so-ciodemographic status, socioeconomic status, health
behaviors, comorbidities, and sleep quality, which may
link long sleep duration to CKD. Even after adjusting for
these confounders, the association between a long sleep
duration and CKD remained significant.
Notwithstand-ing, the adverse health outcomes of long sleep duration
and CKD share a few commonalities, including
associ-ations with old age, diabetes, established cardiovascular
disease, high blood pressure, obesity, and smoking [24].
Interestingly, sleep duration has been shown to be
asso-ciated with cardiometabolic diseases by worsening
kid-ney hemodynamics and may lead to the development of
glomerulosclerosis and glomerulomegaly [24-30].
A number of mechanisms could potentially mediate
the associations between long sleep duration and
kid-ney dysfunction, encompassing both biological and
socioeconomic factors. Inflammation has been shown
to affect the relationship between long sleep duration
and kidney dysfunction [12]. Indeed, several studies have
indicated that immune dysfunction may lead to
pro-gressive kidney dysfunction through activation of the
renin-angiotensin-aldosterone system, which is a
well-known regulator of blood pressure and a progression
factor in CKD [27,29,31-33]. In addition, lower
socioeco-nomic status could be detrimental to CKD [23,34]. In the
Nurses’ Health Study II, women who had never married,
lived alone, were unemployed, had low household
in-come, and were of low societal status were more likely
to sleep longer [23]. Meanwhile, lower socioeconomic
status could increase the risk for CKD due to both a lack
of access to health care and receipt of poorer quality of
care [23]. For people with CKD, lower socioeconomic
status may contribute to poor control of hypertension
and diabetes mellitus due to lack of understanding of
Sleep duration Total no. No. (%) Unadjusted OR (95% CI) Adjusted OR (95% CI)a≥ 9 66 8 (12.1) 1.138 (0.475–2.724) 0.591 (0.199–1.760) Women Continuous, hr/dayb 816 73 (8.9) 1.319 (1.092–1.592) 1.246 (1.019–1.523) Categorical, hr/day < 6 83 5 (6.0) 1.186 (0.414–3.396) 1.076 (0.341–3.393) 6 to < 7 174 15 (8.6) 1.745 (0.821–3.712) 1.475 (0.635–3.428) 7 to < 8 273 14 (5.1) 1.000 1.000 8 to < 9 200 22 (11.0) 2.287 (1.139–4.589) 1.929 (0.885–4.204) ≥ 9 86 17 (19.8) 4.558 (2.141–9.703) 3.112 (1.315–7.363)
OR, odds ratio; CI, confidence interval; eGFR, estimated glomerular filtration rate.
aAdjusted model: adjusted for sex, age, body mass index, systolic blood pressure, smoking, alcohol, exercise, diabetes mellitus, hypercholesterolemia, depression, history of cancer, menopause, socioeconomic status (household income, marital status, and working status), and sleep quality (sleep difficulty, sleep awakeness, snoring, and sleep apnea).
bContinuous model: association analysis on total sleep duration as a continuous variable.
the disease or inadequate treatment [34]. Finally, longer
hours spent in bed lead to reduced physical activity and
could induce a prothrombotic state [23]. Increased
phys-ical activity exerts a protective effect against CKD by
re-ducing cardiometabolic risk factors [9,28]. In fact, an
ex-perimental study found that repeated exercise increased
High creatinine (men)Sleep duration (hr) 3.5 3.0 2.5 2.0 1.5 1.0 0.5 0.0 < 6 6 to < 7 7 to < 8 8 to < 9 ≥ 9
High creatinine (women)
Sleep duration (hr) 9 8 7 6 5 4 3 2 1 0 < 6 6 to < 7 7 to < 8 8 to < 9 ≥ 9
Low eGFR (men)
Sleep duration (hr) 3.5 3.0 2.5 2.0 1.5 1.0 0.5 0.0 < 6 6 to < 7 7 to < 8 8 to < 9 ≥ 9
Low eGFR (women)
Sleep duration (hr) 9 8 7 6 5 4 3 2 1 0 < 6 6 to < 7 7 to < 8 8 to < 9 ≥ 9 CKD (men) Sleep duration (hr) 3.5 3.0 2.5 2.0 1.5 1.0 0.5 0.0 < 6 6 to < 7 7 to < 8 8 to < 9 ≥ 9 CKD (women) Sleep duration (hr) 9 8 7 6 5 4 3 2 1 0 < 6 6 to < 7 7 to < 8 8 to < 9 ≥ 9 Figure 1. Association between sleep duration and chronic kidney disease (CKD). (A) Association between sleep duration and high creatinine in men. (B) Association between sleep duration and high creatinine in women. (C) Association between sleep duration and low estimated glomerular filtration rate (eGFR) in men. (D) Association between sleep duration and low eGFR in women. (E) Association between sleep duration and CKD in men. (F) Association between sleep duration and CKD in women. CKD was defined as the presence of at least one of the following factors: eGFR than 60 mL/min/1.73 m2 or proteinuria. Adjusted model: adjusted for sex, age, body mass index, systolic blood pressure, smoking, alcohol, physical activity, diabetes mellitus, hy-percholesterolemia, depression, history of cardiovascular disease, history of cancer, menopause, socioeconomic status (house-hold income, marital status, and working status), and sleep quality (sleep difficulty, sleep awakeness, snoring, and sleep apnea).
A
C
E
B
D
F
GFR along with a reduction in renal mass in mice [35].
There are several limitations to this study that should
be noted. As noted above, the main limitation of the
present study relates to its causal relationship between
the sleep duration and CKD cannot be confirmed due
to the cross-sectional design of the study. Although we
controlled for several potential confounders in our
sta-tistical models, residual confounding effects may have
been present. Second, sleep habits were measured by
a self-reported questionnaire and were not objectively
confirmed. In future studies, objective measurements,
including actigraphy and polysomnography to assess
quality and quantity of sleep, would be needed. Third,
we did not use 24-hour urinary albumin excretion,
which is the gold standard test for assessing proteinuria.
Instead, we measured proteinuria by a semiquantitative
dipstick test, which has lower sensitivity and specificity,
compared with urinary albumin test [23]. Finally, we did
not exclude individuals who reported a history of
chron-ic diseases, such as hypertension, diabetes mellitus, and
cardiovascular disease, which may have influenced the
results. Further longitudinal analyses are required to
delineate the possible role of long sleep duration in
CKD among Korean adults.
In summary, we suggest that very long sleep duration
is associated with CKD in community-dwelling
Kore-an women. Longitudinal Kore-analyses are required to clarify
the roles of sleep quantity, as well as sleep quality, in
maintaining and improving overall health among CKD
patients. As sleep duration is a potentially modifiable
risk factor, our results may help health advisors with
preventing and delaying the progression of CKD.
Conflict of interest
No potential conflict of interest relevant to this article
was reported.
Acknowledgments
This work was supported by the Research Program
funded by the Korea Centers for Disease Control and
Prevention (2010-E71003-00, 2011-E71002-00) and the
Korean Health Technology R&D Project, Ministry of
Health and Welfare (HI13C0715).
REFERENCES
1. Cappuccio FP, D’Elia L, Strazzullo P, Miller MA. Sleep duration and all-cause mortality: a systematic review and meta-analysis of prospective studies. Sleep 2010;33:585-592.
2. Knutson KL. Sleep duration and cardiometabolic risk: a review of the epidemiologic evidence. Best Pract Res Clin Endocrinol Metab 2010;24:731-743.
3. Cappuccio FP, Cooper D, D’Elia L, Strazzullo P, Miller MA. Sleep duration predicts cardiovascular outcomes: a systematic review and meta-analysis of prospective stud-ies. Eur Heart J 2011;32:1484-1492.
4. Coresh J, Selvin E, Stevens LA, et al. Prevalence of chronic kidney disease in the United States. JAMA 2007;298:2038-2047.
5. Imai E, Horio M, Watanabe T, et al. Prevalence of chronic kidney disease in the Japanese general population. Clin Exp Nephrol 2009;13:621-630.
6. Zhang L, Wang F, Wang L, et al. Prevalence of chronic kidney disease in China: a cross-sectional survey. Lancet 2012;379:815-822.
7. Kang HT, Lee J, Linton JA, Park BJ, Lee YJ. Trends in the prevalence of chronic kidney disease in Korean adults: the Korean National Health and Nutrition Examina-tion Survey from 1998 to 2009. Nephrol Dial Transplant 2013;28:927-936.
8. Fujibayashi K, Fukuda H, Yokokawa H, et al. Associations between healthy lifestyle behaviors and proteinuria and the estimated glomerular filtration rate (eGFR). J Athero-scler Thromb 2012;19:932-940.
9. Stengel B, Tarver-Carr ME, Powe NR, Eberhardt MS, Brancati FL. Lifestyle factors, obesity and the risk of chronic kidney disease. Epidemiology 2003;14:479-487. 10. Iliescu EA, Yeates KE, Holland DC. Quality of sleep in
pa-tients with chronic kidney disease. Nephrol Dial Trans-plant 2004;19:95-99.
11. Ozkok A, Kanbay A, Odabas AR, Covic A, Kanbay M.
KEY MESSAGE
1. Very long sleep duration (more than 9 hours)
was significantly associated with chronic kidney
disease (CKD) in community-dwelling Korean
women.
2. Among women, for every one hour increase in
sleep duration per day, there was a 24.6%
in-crease in the presence of CKD.
Obstructive sleep apnea syndrome and chronic kidney disease: a new cardiorenal risk factor. Clin Exp Hypertens 2014;36:211-216.
12. Ohkuma T, Fujii H, Iwase M, et al. Association between sleep duration and urinary albumin excretion in patients with type 2 diabetes: the Fukuoka diabetes registry. PLoS One 2013;8:e78968.
13. Sasaki S, Yoshioka E, Saijo Y, Kita T, Tamakoshi A, Kishi R. Short sleep duration increases the risk of chronic kidney disease in shift workers. J Occup Environ Med 2014;56:1243-1248.
14. Jo SA, Park MH, Jo I, Ryu SH, Han C. Usefulness of Beck Depression Inventory (BDI) in the Korean elderly popu-lation. Int J Geriatr Psychiatry 2007;22:218-223.
15. American Diabetes Association. Diagnosis and classifi-cation of diabetes mellitus. Diabetes Care 2011;34 Suppl 1:S62-S69.
16. Son JI, Chin SO, Woo JT; The Committee for Developing Treatment Guidelines for Dyslipidemia, Korean Society of Lipidology and Atherosclerosis (KSLA). Treatment guidelines for dyslipidemia: summary of the expanded second version. J Lipid Atheroscler 2012;1:45-59.
17. Levey AS, Bosch JP, Lewis JB, Greene T, Rogers N, Roth D. A more accurate method to estimate glomerular filtration rate from serum creatinine: a new prediction equation. Modification of Diet in Renal Disease Study Group. Ann Intern Med 1999;130:461-470.
18. National Kidney Foundation. K/DOQI clinical practice guidelines for chronic kidney disease: evaluation, clas-sification, and stratification. Am J Kidney Dis 2002;39(2 Suppl 1):S1-S266.
19. Organisation for Economic Co-operation and Devel-opment (OECD). Society at a Glance 2009. Paris: OECD Publishing, 2009.
20. Yamamoto R, Nagasawa Y, Iwatani H, et al. Self-reported sleep duration and prediction of proteinuria: a retrospec-tive cohort study. Am J Kidney Dis 2012;59:343-355. 21. Kripke DF, Garfinkel L, Wingard DL, Klauber MR, Marler
MR. Mortality associated with sleep duration and insom-nia. Arch Gen Psychiatry 2002;59:131-136.
22. Patel SR, Ayas NT, Malhotra MR, et al. A prospective study of sleep duration and mortality risk in women. Sleep 2004;27:440-444.
23. Patel SR, Malhotra A, Gottlieb DJ, White DP, Hu FB. Cor-relates of long sleep duration. Sleep 2006;29:881-889. 24. Kidney Health Australia. Chronic Kidney Disease (CKD)
Management in General Practice. 2nd ed. Melbourne: Kidney Health Australia, 2012.
25. Chen J, Muntner P, Hamm LL, et al. Insulin resistance and risk of chronic kidney disease in nondiabetic US adults. J Am Soc Nephrol 2003;14:469-477.
26. Wahba IM, Mak RH. Obesity and obesity-initiated met-abolic syndrome: mechanistic links to chronic kidney disease. Clin J Am Soc Nephrol 2007;2:550-562.
27. Fogo AB. Mechanisms of progression of chronic kidney disease. Pediatr Nephrol 2007;22:2011-2022.
28. Morgado E, Neves PL. Hypertension and chronic kidney disease: cause and consequence-therapeutic consider-ations. In: Babaei H, ed. Antihypertensive Drugs. InTech, 2012:45-66.
29. Wilcox CS, Welch WJ, Murad F, et al. Nitric oxide synthase in macula densa regulates glomerular capillary pressure. Proc Natl Acad Sci U S A 1992;89:11993-11997.
30. Dengel DR, Goldberg AP, Mayuga RS, Kairis GM, Weir MR. Insulin resistance, elevated glomerular filtration fraction, and renal injury. Hypertension 1996;28:127-132. 31. Remuzzi G, Perico N, Macia M, Ruggenenti P. The role
of renin-angiotensin-aldosterone system in the pro-gression of chronic kidney disease. Kidney Int Suppl 2005;99:S57-S65.
32. Westhuyzen J, Healy H. Review: biology and relevance of C-reactive protein in cardiovascular and renal disease. Ann Clin Lab Sci 2000;30:133-143.
33. Yang T, Chou YC, Chu CH, et al. Metabolic syndrome and C-reactive protein concentration as independent cor-relates of chronic kidney disease. Endocr Res 2014;39:94-98.
34. Plantinga LC, Johansen KL, Schillinger D, Powe NR. Low-er socioeconomic status and disability among US adults with chronic kidney disease, 1999-2008. Prev Chronic Dis 2012;9:E12.
35. Averbukh Z, Marcus E, Berman S, et al. Effect of exer-cise training on glomerular filtration rate of mice with various degrees of renal mass reduction. Am J Nephrol 1992;12:174-178.
Supplementary Table 1. Prevalence of indicators of CKD in the study population (n = 1,360)
eGFR, mL/min/1.73 m² No. (%)a Proteinuria, n (%)b CKDd
Unknownc Negativec Tracec Positive (≥ 1+)c Stage No. (%)c Total 1,360 (100.0) 7 (0.5) 1,296 (95.3) 42 (3.1) 15 (1.1) All 125 (9.2) ≥ 90 105 (7.7) 0 101 (96.2) 3 (2.9) 1 (1.0) 1 1 (0.1) 60–89 1,140 (83.8) 3 (0.3) 1,098 (96.3) 30 (2.6) 9 (0.8) 2 9 (0.7) 30–59 111 (8.2) 2 (1.8) 95 (85.6) 9 (8.1) 5 (4.5) 3 111 (8.2) 15–29 0 0 0 0 0 4 0 < 15 4 (0.3) 2 (50.0) 2 (50.0) 0 0 5 4 (0.3) Men 544 (100.0) 2 (0.4) 504 (92.6) 30 (5.5) 8 (1.5) All 52 (9.6) ≥ 90 61 (11.2) 0 57 (93.4) 3 (4.9) 1 (1.6) 1 1 (0.2) 60–89 437 (80.3) 1 (0.2) 409 (93.6) 22 (5.0) 5 (1.1) 2 5 (0.9) 30–59 44 (8.1) 0 37 (84.1) 5 (11.4) 2 (4.5) 3 44 (8.1) 15–29 0 0 0 0 0 4 0 < 15 2 (0.4) 1 (50.0) 1 (50.0) 0 0 5 2 (0.4) Women 816 (100.0) 5 (0.6) 792 (97.1) 12 (1.5) 7 (0.9) All 73 (8.9) ≥ 90 44 (5.4) 0 44 (100.0) 0 0 1 0 60–89 703 (86.2) 2 (0.3) 689 (98.0) 8 (1.1) 4 (0.6) 2 4 (0.5) 30–59 67 (8.2) 2 (3.0) 58 (86.6) 4 (6.0) 3 (4.5) 3 67 (8.2) 15–29 0 0 0 0 0 4 0 < 15 2 (0.3) 1 (50.0) 1 (50.0) 0 0 5 2 (0.2)
CKD, chronic kidney disease; eGFR, estimated glomerular filtration rate. aNumber of participants across each kidney function category.
bDefined as proteinuria 1+ or more based on a dipstick urine test.
cNumber of participants with corresponding indicators of CKD across each kidney function category.
Supplementary Table 2. Age-specific association between sleep duration and CKD criteria in men (n = 544)
Sleep duration Unadjusted OR (95% CI) Adjusted OR (95% CI)a
Age < 64 (n = 295) Age ≥ 64 (n = 249) Age < 64 (n = 295) Age ≥ 64 (n = 249) High creatinine Continuous, hr/dayb 0.997 (0.629–1.581) 1.075 (0.791–1.461) 1.097 (0.646–1.863) 1.074 (0.747–1.545) Categorical, hr/day < 7 0.754 (0.197–2.889) 0.376 (0.115–1.227) 0.336 (0.064–1.770) 0.333 (0.079–1.407) 7 to < 8 1.000 1.000 1.000 1.000 ≥ 8 0.980 (0.255–3.771) 0.713 (0.297–1.712) 0.711 (0.137–3.696) 0.724 (0.233–2.246) Low eGFR Continuous, hr/dayb 1.135 (0.689–1.871) 1.086 (0.825–1.429) 1.330 (0.757–2.336) 1.134 (0.816–1.577) Categorical, hr/day < 7 0.707 (0.154–3.239) 0.576 (0.218–1.523) 0.417 (0.074–2.336) 0.540 (0.150–1.937) 7 to < 8 1.000 1.000 1.000 1.000 ≥ 8 1.238 (0.300–5.104) 0.782 (0.349–1.750) 1.129 (0.233–5.465) 0.860 (0.292–2.534) CKD Continuous, hr/dayb 1.083 (0.683–1.718) 1.095 (0.842–1.424) 1.259 (0.721–2.199) 1.075 (0.787–1.469) Categorical, hr/day < 7 0.754 (0.197–2.889) 0.616 (0.244–1.558) 0.514 (0.105–2.522) 0.608 (0.186–1.988) 7 to < 8 1.000 1.000 1.000 1.000 ≥ 8 0.980 (0.255–3.771) 0.841 (0.388–1.823) 0.921 (0.194–4.367) 0.799 (0.289–2.211) CKD, chronic kidney disease; OR, odds ratio; CI, confidence interval; eGFR, estimated glomerular filtration rate.
aAdjusted model: adjusted for sex, age, body mass index, systolic blood pressure, smoking, alcohol, exercise, diabetes melli-tus, hypercholesterolemia, depression, history of cardiovascular disease, history of cancer, menopause, socioeconomic status (household income, marital status, and working status), and sleep quality (sleep difficulty, sleep awakeness, snoring, and sleep apnea).
Supplementary Table 3. Age-specific association between sleep duration and CKD criteria in women (n = 816)
Sleep duration Unadjusted OR (95% CI) Adjusted OR (95% CI)
a
Age < 60 (n = 423) Age ≥ 60 (n = 393) Age < 60 (n = 423) Age ≥ 60 (n = 393) High creatinine Continuous, hr/dayb 1.337 (0.899-1.988) 1.258 (0.995-1.592) 1.277 (0.837-1.946) 1.224 (0.932-1.607) Categorical, hr/day < 7 0.938 (0.280-3.144) 2.076 (0.752-5.734) 0.796 (0.213-2.979) 2.121 (0.627-7.179) 7 to < 8 1.000 1.000 1.000 1.000 ≥ 8 1.503 (0.492-4.590) 3.182 (1.256-8.059) 1.289 (0.376-4.416) 3.174 (1.030-9.785) Low eGFR Continuous, hr/dayb 1.461 (0.955-2.235) 1.197 (0.970-1.476) 1.469 (0.885-2.441) 1.184 (0.926-1.513) Categorical, hr/day < 7 1.132 (0.278-4.615) 1.866 (0.789-4.413) 1.038 (0.221-4.879) 1.741 (0.627-4.832) 7 to < 8 1.000 1.000 1.000 1.000 ≥ 8 2.284 (0.653-7.985) 2.587 (1.174-5.703) 2.181 (0.528-9.004) 2.597 (1.018-6.627) CKD Continuous, hr/dayb 1.479 (1.000-2.185) 1.210 (0.982-1.491) 1.581 (0.969-2.577) 1.205 (0.945-1.537) Categorical, hr/day < 7 0.900 (0.237-3.420) 1.866 (0.789-4.413) 0.852 (0.196-3.704) 1.692 (0.613-4.673) 7 to < 8 1.000 1.000 1.000 1.000 ≥ 8 2.374 (0.775-7.273) 2.697 (1.227-5.929) 2.471 (0.687-8.886) 2.699 (1.065-6.841) CKD, chronic kidney disease; OR, odds ratio; CI, confidence interval; eGFR, estimated glomerular filtration rate.
aAdjusted model: adjusted for sex, age, body mass index, systolic blood pressure, smoking, alcohol, exercise, diabetes melli-tus, hypercholesterolemia, depression, history of cardiovascular disease, history of cancer, menopause, socioeconomic status (household income, marital status, and working status), and sleep quality (sleep difficulty, sleep awakeness, snoring, and sleep apnea).
Supplementary Table 4. Association between sleep duration and CKD criteria after excluding hypertension, diabetes mellitus, and cardiovascular disease
Exclusion criteria Total no. No. (%) OR, hr/daya
Unadjusted OR (95% CI) Adjusted OR (95% CI)b High creatinine Hypertension Men 332 14 (4.2) 1.186 (0.770–1.829) 1.345 (0.764–2.370) Women 512 16 (3.1) 1.196 (0.792–1.806) 1.246 (0.697–2.228) Diabetes mellitus Men 460 34 (7.4) 1.168 (0.882–1.547) 1.154 (0.837–1.591) Women 735 46 (6.3) 1.239 (0.979–1.569) 1.127 (0.880–1.444) Cardiovascular disease Men 485 31 (6.4) 0.996 (0.751–1.321) 1.012 (0.745–1.373) Women 772 49 (6.4) 1.289 (1.029–1.614) 1.264 (1.004–1.592) Low eGFR Hypertension Men 332 16 (4.8) 1.076 (0.716–1.618) 1.172 (0.686–2.004) Women 512 17 (3.3) 1.249 (0.838–1.860) 1.285 (0.701–2.357) Diabetes mellitus Men 460 37 (8.0) 1.178 (0.899–1.544) 1.184 (0.867–1.617) Women 735 55 (7.5) 1.239 (0.997–1.540) 1.110 (0.883–1.397) Cardiovascular disease Men 485 34 (7.0) 1.117 (0.853–1.462) 1.129 (0.845–1.508) Women 772 57 (7.4) 1.247 (1.010–1.539) 1.213 (0.975–1.509) Low CKD Hypertension Men 332 18 (5.4) 1.119 (0.761–1.645) 1.127 (0.705–1.800) Women 512 18 (3.5) 1.224 (0.829–1.805) 1.267 (0.720–2.229) Diabetes mellitus Men 460 39 (8.5) 1.153 (0.885–1.501) 1.136 (0.836–1.545) Women 735 58 (7.9) 1.248 (1.009–1.543) 1.144 (0.913–1.432) Cardiovascular disease Men 485 38 (7.8) 1.083 (0.838–1.399) 1.064 (0.807–1.402) Women 772 61 (7.9) 1.269 (1.035–1.557) 1.237 (1.000–1.530)
CKD, chronic kidney disease; OR, odds ratio; CI, confidence interval; eGFR, estimated glomerular filtration rate. aContinuous model: association analysis on total sleep duration as a continuous variable.
bAdjusted model: adjusted for sex, age, body mass index, systolic blood pressure, smoking, alcohol, exercise, diabetes mellitus, hypercholesterolemia, depression, history of cancer, menopause, socioeconomic status (household income, marital status, and working status), and sleep quality (sleep difficulty, sleep awakeness, snoring, and sleep apnea).
Supplementary Figure 1. Cubic spline functions of the association between average sleep duration and kidney function accord-ing to sex. (A) Cubic spline functions of the association between average sleep duration and creatinine in men. (B) Cubic spline functions of the association between average sleep duration and creatinine in women. (C) Cubic spline functions of the associ-ation between average sleep durassoci-ation and estimated glomerular filtrassoci-ation rate (eGFR) in men. (D) Cubic spline functions of the association between average sleep duration and eGFR in women. The shadowed areas represent 95% confidence intervals for the fitted splines. The solid line is a restricted cubic spline. The black dots represent men and the red dots women.
Sleep duration and creatinine in men
Average sleep duration (min)
1.5 1.2 0.9 0.6 240 300 360 420 480 540 600 Creatinine (mg /dL ) Creatinine (mg /dL )
Sleep duration and creatinine in women
Average sleep duration (min)
1.5
1.2
0.9
0.6
240 300 360 420 480 540 600
Sleep duration and eGFR in men
Average sleep duration (min)
100 90 80 70 60 50 40 100 90 80 70 60 50 40 240 300 360 420 480 540 600 eGFR (mL /min/1.73 m 2) eGFR (mL /min/1.73 m 2)
Sleep duration and eGFR in women
Average sleep duration (min)
240 300 360 420 480 540 600