INTRODUCTION
Intracranial vessel wall MRI (VW-MRI) has recently attracted widespread interest and been increasingly adopted for visualization of extra- and intracranial VW pathology in clinical practice (1). VW-MRI offers advantages for the detection of symptomatic non-stenotic lesions and further
Contrast-Enhanced High-Resolution Intracranial Vessel
Wall MRI with Compressed Sensing: Comparison with
Conventional T1 Volumetric Isotropic Turbo Spin Echo
Acquisition Sequence
Chae Jung Park, MD, PhD
1, Jihoon Cha, MD, PhD
1, Sung Soo Ahn, MD, PhD
1, Hyun Seok Choi, MD, PhD
1,
Young Dae Kim, MD, PhD
2, Hyo Suk Nam, MD, PhD
2, Ji Hoe Heo, MD, PhD
2, Seung-Koo Lee, MD, PhD
11Departments of Radiology and Research Institute of Radiological Science and 2Neurology, Yonsei University College of Medicine, Seoul, Korea Objective: Compressed sensing (CS) has gained wide interest since it accelerates MRI acquisition. We aimed to compare the 3D post-contrast T1-weighted volumetric isotropic turbo spin echo acquisition (VISTA) with CS (VISTA-CS) and without CS (VISTA-nonCS) in intracranial vessel wall MRIs (VW-MRI).
Materials and Methods: From April 2017 to July 2018, 72 patients who underwent VW-MRI, including both CS and VISTA-nonCS, were retrospectively enrolled. Wall and lumen volumes, signal-to-noise ratio (SNR), and contrast-to-noise ratio (CNR) were measured from normal and lesion sites. Two neuroradiologists independently evaluated overall image quality and degree of normal and lesion wall delineation with a four-point scale (scores ≥ 3 defined as acceptable).
Results: Scan coverage was increased in VISTA-CS to cover both anterior and posterior circulations with a slightly shorter scan time compared to VISTA-nonCS (approximately 7 minutes vs. 8 minutes). Wall and lumen volumes were not significantly different with VISTA-CS or VISTA-nonCS (interclass correlation coefficient = 0.964–0.997). SNR was or trended towards significantly higher values in VISTA-CS than in VISTA-nonCS. At normal sites, CNR was not significantly different between two sequences (p = 0.907), whereas VISTA-CS provided lower CNR in lesion sites compared with VISTA-nonCS (p = 0.003). Subjective wall delineation was superior with VISTA-nonCS than with VISTA-CS (p = 0.019), although overall image quality did not differ (p = 0.297). The proportions of images with acceptable quality were not significantly different between VISTA-CS (83.3–97.8%) and VISTA-nonCS (75–100%).
Conclusion: CS may be useful for intracranial VW-MRI as it allows for larger scan coverage with slightly shorter scan time without compromising image quality.
Keywords: Magnetic resonance imaging; Blood vessels; Diagnostic imaging; Signal-to-noise ratio; Acceleration
Received: February 16, 2020 Revised: April 8, 2020 Accepted: April 25, 2020
Corresponding author: Jihoon Cha, MD, PhD, Department of Radiology and Research Institute of Radiological Science, Severance
Hospital, Yonsei University College of Medicine, 50-1 Yonsei-ro, Seodaemun-gu, Seoul 03722, Korea.
• E-mail: JIHOONCHA@yuhs.ac
This is an Open Access article distributed under the terms of the Creative Commons Attribution Non-Commercial License (https:// creativecommons.org/licenses/by-nc/4.0) which permits unrestricted non-commercial use, distribution, and reproduction in any medium, provided the original work is properly cited.
characterization of stenotic lesions (2, 3). For intracranial VW-MRI, high signal-to-noise ratio (SNR), contrast-to-noise ratio (CNR), and spatial resolution are needed to visualize thin arterial VWs and characterize VW lesions (1, 4, 5), which inevitably prolong scan time; therefore, it is clinically important to perform VW-MRIs in a reasonable time while maintaining high resolution. To achieve this, scan coverage Korean J Radiol 2020;21(12):1339-1349
is often compromised with focus on target vessels either in the anterior or posterior circulation, rather than covering all intracranial arteries.
Recently introduced compressed sensing (CS) enables accelerated MRI acquisition using sparse k-space sampling by discarding redundancy in the data acquisition process (6-8). This helps avoid the undersampling artifacts by using incoherent sampling with nonlinear reconstruction (9-11). CS has been adopted for MRI for one of the following benefits: 1) reduced scan time, 2) increased spatial resolution with no increase in scan time, and 3) increased coverage while maintaining spatial resolution and scan time. Most previous studies of VW-MRIs adopted CS in order to reduce scan acquisition time. CS reduced the scan time without significantly sacrificing image quality in both intra- and extracranial VW-MRIs (12-14), while also providing robust and reproducible images (15). Most of the study subjects, however, were healthy volunteers and the clinical usefulness of CS in intracranial VW-MRIs must be validated in a large patient cohort. In addition, little research has been dedicated to whether CS is useful when increasing scan coverage while maintaining a similar scan time.
The assessment of VW enhancement is important for reporting VW-MRI findings. Enhancement pattern details are required to differentiate between intracranial atherosclerosis, arterial dissection, and other causes of luminal narrowing, such as reversible cerebral vasoconstriction syndrome and vasculitis (2, 16). In addition, the presence of enhancement helps identify culprit lesions, most importantly, unstable or ruptured aneurysms (17, 18). Thus, high quality post-contrast images are a prerequisite for VW-MRI interpretation.
In the present study, we applied CS to the post-contrast images from VW-MRI to increase scan coverage to cover both anterior and posterior circulations while maintaining a scan time similar to those without CS. We hypothesized that CS might provide comparable image quality, both quantitatively and qualitatively. The purpose of our study was to compare post-contrast images with and without CS from intracranial VW-MRIs in a large patient cohort.
MATERIALS AND METHODS
Study Population
This retrospective study was approved by the Institutional Review Board of our institution, Severance Hospital (4-2019-0534) and the requirement for informed consent was waived.
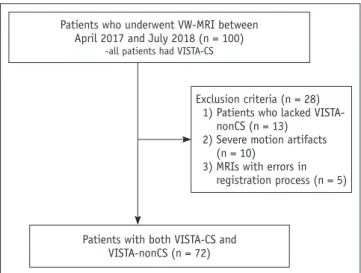
We searched for all VW-MRIs performed between April 2017 and July 2018 in our institution and found 100 patients’ VW-MRIs. The VW-MRIs were performed for various reasons, but the majority of them evaluated the cause of ischemic stroke, the etiology of intracranial stenosis, and the differentiation between atherosclerosis and arterial dissection. All patient MRIs included 3D fat-suppressed post-contrast T1-weighted volumetric isotropic turbo spin echo acquisition (VISTA) with CS (VISTA-CS). An exclusion criteria was established: 1) patients lacking post-contrast T1-weighted VISTA without CS (VISTA-nonCS, n = 13), 2) MRIs with severe motion artifacts (n = 10), and 3) MRIs with errors in the registration process due to significantly different scan ranges between VISTA with and without CS (n = 5). Finally, 72 patients with both CS and VISTA-nonCS were included (Fig. 1).
MRI Acquisition
VW-MRI was performed using a 3T MRI scanner (Ingenia CX, Philips Medical Systems) with a 32-channel sensitivity-encoding (SENSE) head coil. 3D time-of-flight (TOF) MR angiography (MRA) and 3D fat-suppressed VISTA-CS and VISTA-nonCS were performed. 3D T1-weighted VISTA was obtained with improved motion-sensitized driven-equilibrium preparation (velocity encoding = 3 cm/s) for blood suppression. The imaging parameters of 3D TOF MRA were as follows: repetition time/echo time = 19/3.5 ms, flip angle = 18°, matrix = 640 x 330, slice thickness = 1.2 mm (interpolated to 0.6 mm), field of view = 210 mm, 9.6 cm
Patients who underwent VW-MRI between April 2017 and July 2018 (n = 100)
-all patients had VISTA-CS
Patients with both VISTA-CS and VISTA-nonCS (n = 72)
Exclusion criteria (n = 28) 1) Patients who lacked
VISTA-nonCS (n = 13) 2) Severe motion artifacts
(n = 10)
3) MRIs with errors in registration process (n = 5)
Fig. 1. Flow chart of patient enrollment. VISTA-CS =
post-contrast T1-weighted volumetric isotropic turbo spin echo acquisition with compressed sensing, VISTA-nonCS = post-contrast T1-weighted volumetric isotropic turbo spin echo acquisition without compressed sensing, VW = vessel wall
coverage on axial plane with maximum intensity projection (MIP) reconstruction, and acquisition time = 5 minutes 10 seconds. The imaging parameters of 3D VISTA-nonCS and VISTA-CS are presented in Table 1. Different anatomical coverages of VISTA-nonCS and VISTA-CS on a sagittal MIP image of contrast-enhanced MRA are demonstrated in Figure 2. Due to limited coverage of VISTA-nonCS, it was focused on either the anterior or posterior circulation according to the target vessel. Post-contrast 3D T1WI images were acquired 5 minutes after intravenous injection of a contrast agent. VISTA-CS was performed first and was followed by VISTA-nonCS (Dotarem [gadoterate meglumine]; Guerbet; 0.1 mmol/kg body weight).
Image Analyses
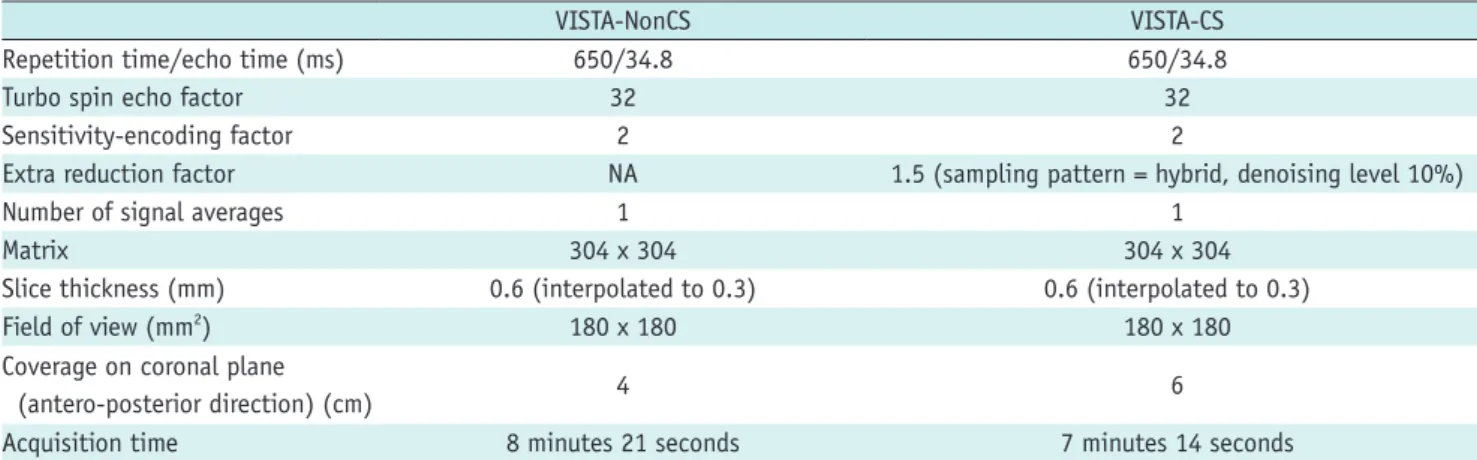
For VW-MRI focused on the anterior circulation, the distal internal carotid artery (ICA) from the supraclinoid ICA and middle cerebral artery (MCA) M1 segment was chosen for analysis. For VW-MRI focused on the posterior circulation, the vertebral artery (VA) V4 segment and basilar artery (BA) were chosen for analysis. Distal MCAs or posterior cerebral arteries were not included in the analysis since the diameter of these arteries is frequently small; it is not feasible to draw volume of interests (VOIs) in a considerable portion of patients. Extracranial arteries were also excluded from the analysis because extracranial regions, located off-center, provided relatively low SNR compared to intracranial regions. Table 1. Scan Parameters of Intracranial VW-MRI
VISTA-NonCS VISTA-CS
Repetition time/echo time (ms) 650/34.8 650/34.8
Turbo spin echo factor 32 32
Sensitivity-encoding factor 2 2
Extra reduction factor NA 1.5 (sampling pattern = hybrid, denoising level 10%)
Number of signal averages 1 1
Matrix 304 x 304 304 x 304
Slice thickness (mm) 0.6 (interpolated to 0.3) 0.6 (interpolated to 0.3)
Field of view (mm2) 180 x 180 180 x 180
Coverage on coronal plane
(antero-posterior direction) (cm) 4 6
Acquisition time 8 minutes 21 seconds 7 minutes 14 seconds
VISTA-CS = contrast T1-weighted volumetric isotropic turbo spin echo acquisition with compressed sensing, VISTA-nonCS = post-contrast T1-weighted volumetric isotropic turbo spin echo acquisition without compressed sensing, VW = vessel wall
Fig. 2. Different anatomical coverages in antero-posterior direction of VISTA-CS and VISTA-nonCS.
VISTA-CS (red box) and VISTA-nonCS (blue box) are demonstrated on sagittal maximum intensity projection image of contrast enhanced MR angiography (A), with coronal imaging slab being rotated slightly to cover both carotid and vertebro-basilar arterial systems. Axial images
corresponding to horizontal line (light blue) (A) depict larger coverage in antero-posterior direction in VISTA-CS (B) than that in VISTA-nonCS (C).
Quantitative Analyses
VISTA-CS images were co-registered to VISTA-nonCS images using rigid body transformation with normalized mutual information as a cost function. Then, VOIs were placed by a neuroradiologist with 2 years of experience with VW-MRI using a 3D slicer (3D Slicer v4.10.2) (19). Lumen contours and outer wall boundaries were manually drawn. If the VW-MRI showed enhancing VW lesions, VOIs were drawn on both the normal and lesion sites; otherwise, VOIs were drawn on normal sites only. The lesions were defined as VW thickening with enhancement, first determined by the junior neuroradiologist, then confirmed by a senior neuroradiologist with 9 years of experience. Normal site VOIs were drawn, for VW-MRI focused on the anterior circulation, on two continuous axial slices in a unilateral distal ICA and two continuous sagittal slices in a unilateral MCA M1 segment and, for VW-MRI focused on the posterior circulation, on two continuous axial slices in a unilateral distal VA and two continuous axial slices in BA. Lesion site VOIs were drawn on three continuous slices where wall thickening and enhancement were most prominent. In cases with multiple lesions, the three continuous slices with the most prominent enhancing wall thickening were selected. Normal site VOIs were drawn contralateral to the lesion site or any non-lesioned sites in the case of bilateral lesions. The proximal portion of the V4 segment was excluded for
analysis due to normal dural enhancement or vasa vasorum that could interfere with assessment. Lesion sites and types were recorded.
Due to the inhomogeneous noise distribution as a result of parallel imaging, we could not directly measure the noise simply in the air. Instead, we used the standard deviation (SD) of the white matter (WM) to calculate SNR (5, 13, 20). A 10-mm diameter VOI was placed in the normal WM at the anterior temporal lobe for VW-MRI focused on the anterior circulation and the middle cerebellar peduncle for VW-MRI focused on the posterior circulation. The SNR was calculated as follows: SNR = 0.695 x (signal intensity of VW or lumen) / (noise). The CNR was calculated: CNR = SNRwall - SNRlumen. Wall
and lumen volume, SNR, and CNR were calculated for normal and lesion sites.
Qualitative Analyses
Two neuroradiologists independently evaluated VISTA-nonCS and VISTA-CS. Overall image quality and normal wall and lesion wall delineation were evaluated with a four-point visual scale (13, 21). Overall image quality was graded as follows: 1) artifacts significantly interrupt VW assessment, 2) artifacts cause some difficulty in VW assessment, 3) artifacts exist without affecting VW assessment, and 4) negligible artifacts and excellent image quality (Fig. 3). In VISTA-nonCS images, ripple-like artifacts were frequently noted that might
Fig. 3. Representative figures demonstrating different grades of overall image quality.
Grade 1: artifacts in posterior fossa significantly interrupt assessment of VW lesions in left distal VA (VISTA-nonCS) (A). Grade 2: blurring of
vessel contour with SNR decrease causes some difficulty in assessment of VW lesions in right distal VA (VISTA-CS) (B). Grade 3: ripple like
artifacts exist without affecting assessment of VW lesions in left MCA (VISTA-nonCS) (C). Grade 4: negligible artifacts and excellent image quality
(VISTA-CS) (D). MCA = middle cerebral artery, SNR = signal-to-noise ratio, VA = vertebral artery
A
C
B
be associated with SENSE (Fig. 3C). Instead of ripple-like artifacts, the blurring of vessel contours and decreased SNR predominantly in the center of the images were frequently noted in the VISTA-CS (Fig. 3B). Normal VW delineation was graded as follows: 1) VW discernible in < 1/2 lengths of the analyzed areas, 2) VW discernible in ≥ 1/2 and < 3/4 lengths of the analyzed areas, 3) VW discernible in ≥ 3/4 lengths of the analyzed areas with a few indiscernible sites, and 4) VW discernible along the entire length. Lesion VW delineation was graded as follows: 1) < 180 degrees of the VW is clearly visible, 2) ≥ 180 and < 270 degrees of the VW is clearly visible, 3) ≥ 270 and < 360 degrees of the VW is clearly visible, and 4) 360 degrees of the VW is clearly visible. No patients received a grade of 1 in the lesion VW delineation. Representative figures of grades 2–4 are demonstrated in Figure 4. Significant blurring of the lesion site led to a one-score reduction. After calculating the average one-scores from reader 1 and reader 2, acceptable images were defined as those with scores ≥ 3 for overall image quality and normal and lesion wall delineation.
Statistical Analyses
Statistical analyses were performed using R statistical software version 3.4.2 (R foundation for Statistical Computing). Paired t test and McNemar’s test were used to compare the two groups. Weighted kappa was calculated for interobserver agreement. An interclass correlation coefficient (ICC) was calculated for VW and lumen volumes. Bland-Altman plots were obtained to delineate the reproducibility of wall and lumen volumes from VISTA-nonCS and VISTA-CS. Violin plots were used to visualize the distribution of SNR
and CNR from VISTA-nonCS and VISTA-CS. P values < 0.05 indicated statistical significance.
RESULTS
Study Cohort
Baseline patient characteristics and VW-MRI findings are shown in Table 2. A total of 72 patients (39 men [mean age
Fig. 4. Representative figures demonstrating different grades of VW lesion delineation.
Grade 1 is not shown as no patients received grade 1 in lesion wall delineation. Grade 2: ≥ 180 and < 270 degrees of lesion in right MCA is clearly visible (black arrowheads) (A). Grade 3: ≥ 270 and < 360 degrees of lesion in right distal VA is clearly visible (black arrowheads) (B).
Grade 4: 360 degrees of lesion in left MCA is clearly visible (white arrowheads) (C).
A B C
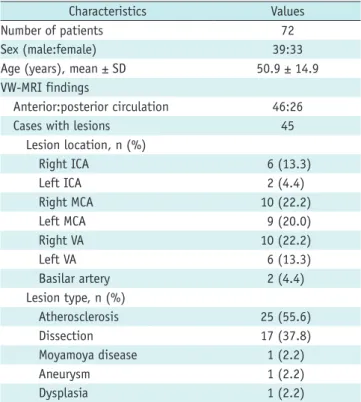
Table 2. Baseline Patient Demographics and VW-MRI Findings
Characteristics Values Number of patients 72 Sex (male:female) 39:33 Age (years), mean ± SD 50.9 ± 14.9 VW-MRI findings
Anterior:posterior circulation 46:26 Cases with lesions 45
Lesion location, n (%) Right ICA 6 (13.3) Left ICA 2 (4.4) Right MCA 10 (22.2) Left MCA 9 (20.0) Right VA 10 (22.2) Left VA 6 (13.3) Basilar artery 2 (4.4) Lesion type, n (%) Atherosclerosis 25 (55.6) Dissection 17 (37.8) Moyamoya disease 1 (2.2) Aneurysm 1 (2.2) Dysplasia 1 (2.2)
ICA = internal carotid artery, MCA = middle cerebral artery, SD = standard deviation, VA = vertebral artery
± SD, 48 years ± 13] and 33 women [52 years ± 17]) were enrolled. Forty-six patients underwent VW-MRI focused on the anterior circulation, while 26 patients underwent VW-MRI focused on the posterior circulation. Forty-five patients had identifiable enhancing VW lesions. The most common type of lesion was atherosclerosis (55.6%), followed by dissection (37.8%). Representative cases are shown in Figure 5.
Quantitative Analyses
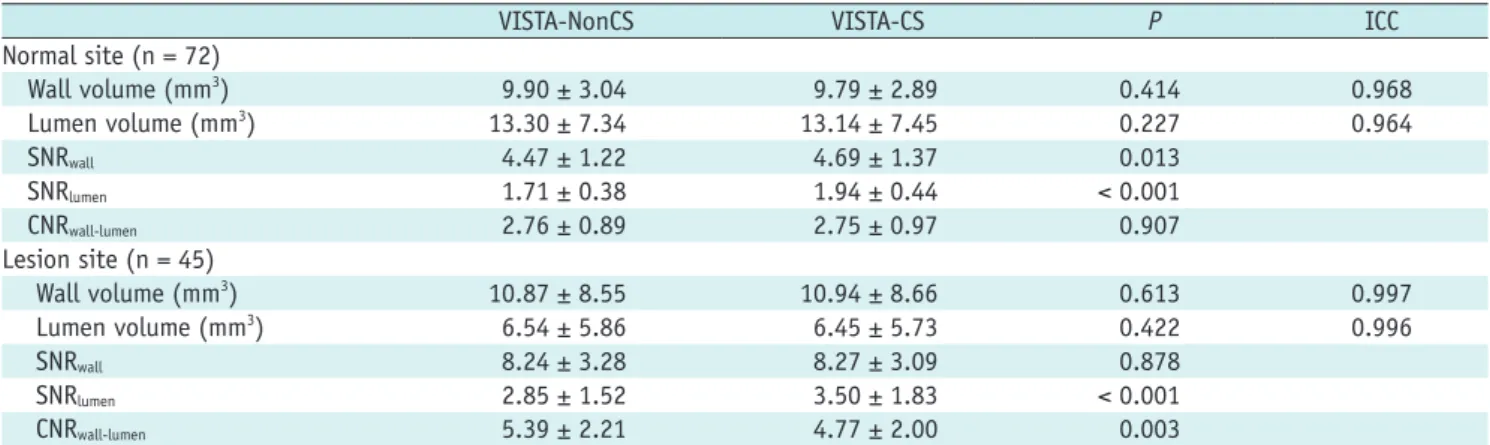
The results of the quantitative analyses are summarized in Table 3. In both normal and lesion sites, wall and lumen volumes did not differ significantly between VISTA-nonCS and VISTA-CS. In normal sites, ICCs for wall and lumen volume were 0.968 and 0.964, respectively. In lesion sites, ICCs for wall and lumen volume were 0.997 and 0.996, respectively, suggesting excellent reproducibility between the two sequences. Bland-Altman plots of wall and lumen volumes from both normal and lesion sites are shown in Figure 6. In normal sites, VISTA-CS presented significantly higher wall SNR (4.69 ± 1.37 vs. 4.47 ± 1.22, p = 0.013) and lumen SNR (1.94 ± 0.44 vs. 1.71 ± 0.38, p < 0.001) compared to VISTA-nonCS. CNR was not significantly different between VISTA-nonCS and VISTA-CS (2.76 ± 0.89 vs. 2.75 ± 0.97, p = 0.907). In lesion sites, wall SNR did not
differ significantly between VISTA-nonCS and VISTA-CS (8.24 ± 3.28 vs. 8.27 ± 3.09, p = 0.878), while lumen SNR was significantly lower in VISTA-nonCS than in VISTA-CS (2.85 ± 1.52 vs. 3.50 ± 1.83, p < 0.001). The CNR was significantly higher in VISTA-nonCS than in VISTA-CS (5.39 ± 2.21 vs. 4.77 ± 2.00, p = 0.003).
Qualitative Analyses
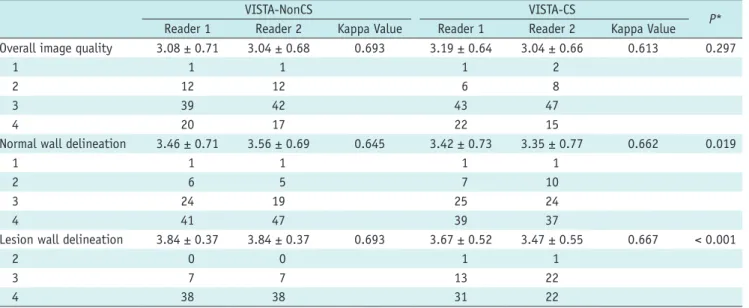
The visual scores of VISTA-nonCS and VISTA-CS from the two readers are presented in Table 4. CS and VISTA-nonCS had comparable overall image quality without any significant difference (averaged scores from the readers, 3.12 ± 0.60 vs. 3.06 ± 0.63, p = 0.297). In VISTA-nonCS, 13 patients (18.1%) received grades of 1 and 2 in overall image quality due to MRI artifacts interrupting the VW assessment. The remaining 59 patients (81.9%) had negligible artifacts or some artifacts causing no difficulty in the VW assessment. In VISTA-CS, 7 (9.7%) and 10 (13.9%) patients received grades of 1 and 2 in overall image quality, respectively. Ripple-like artifacts were common with VISTA-nonCS, likely related to SENSE (Fig. 5C). On VISTA-CS, blurred and coarse vessel boundaries and decreased signal in the center of images were common (Fig. 5B). Normal walls were better delineated with nonCS than with VISTA-CS (3.51 ± 0.63 vs. 3.38 ± 0.67, p = 0.019). Except for one
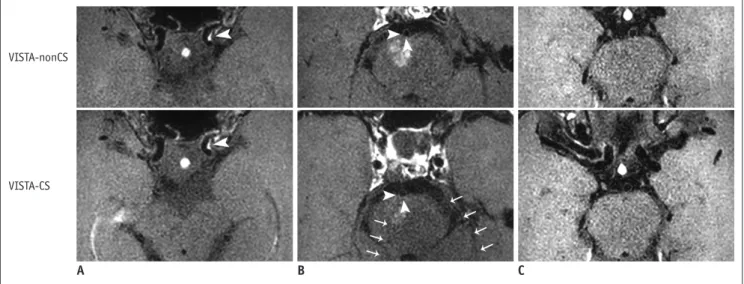
Fig. 5. Three representative cases for comparisons of VISTA-nonCS and VISTA-CS are demonstrated.
A. 57-year-old female underwent VW-MRI, which revealed eccentric enhancing wall thickening in left distal internal carotid artery, suggestive of
atherosclerosis (white arrowhead). Both VISTA-nonCS (upper row) and VISTA-CS (lower row) received scores of 4 for overall image quality, normal wall delineation, and lesion wall delineation. B. 37-year-old female underwent VW-MRI due to subacute right paramedian pontine infarction.
Adjacent basilar artery shows eccentric enhancing wall thickening predominantly in right and posterior wall (white arrowheads). VISTA-nonCS received score of 4 (upper row), whereas VISTA-CS received score of 3 for lesion delineation due to slight blurring of vessel contour (arrowheads, lower row). Prominent decrease in SNR was observed in posterior part of VISTA-CS images (arrows). C. 72-year-old female underwent VW-MRI due
to right striatocapsular infarction (not shown). VISTA-nonCS received score of 3 due to decreased SNR and ripple-like artifacts overlying pons (upper row). VISTA-CS received score of 4, and there were less prominent ripple-like artifacts (lower row).
VISTA-nonCS
VISTA-CS
Table 3. Comparisons of Volume, SNR and CNR between VISTA-NonCS and VISTA-CS for Normal and Lesion Sites
VISTA-NonCS VISTA-CS P ICC
Normal site (n = 72) Wall volume (mm3) 9.90 ± 3.04 9.79 ± 2.89 0.414 0.968 Lumen volume (mm3) 13.30 ± 7.34 13.14 ± 7.45 0.227 0.964 SNRwall 4.47 ± 1.22 4.69 ± 1.37 0.013 SNRlumen 1.71 ± 0.38 1.94 ± 0.44 < 0.001 CNRwall-lumen 2.76 ± 0.89 2.75 ± 0.97 0.907 Lesion site (n = 45) Wall volume (mm3) 10.87 ± 8.55 10.94 ± 8.66 0.613 0.997 Lumen volume (mm3) 6.54 ± 5.86 6.45 ± 5.73 0.422 0.996 SNRwall 8.24 ± 3.28 8.27 ± 3.09 0.878 SNRlumen 2.85 ± 1.52 3.50 ± 1.83 < 0.001 CNRwall-lumen 5.39 ± 2.21 4.77 ± 2.00 0.003
Data is presented with mean ± SD. CNR = contrast-to-noise ratio, ICC = interclass correlation coefficient, SNR = signal-to-noise ratio
Fig. 6. Bland-Altman plots for volumes of wall and lumen from VISTA-nonCS and VISTA-CS in normal sites (A) and lesion sites (B)
suggest excellent reproducibility between two sequences. SD = standard deviation
3 2 1 0 -1 -2 -3 VI ST A-n onCS - VI ST A-CS 5 10 15 20 Average value (mm3)
Wall volume (normal site)
-1.96 SD Mean +1.96 SD 2 1 0 -1 -2 -3 VI ST A-n onCS - VI ST A-CS 10 20 30 40 50 Average value (mm3)
Wall volume (lesion site)
-1.96 SD Mean +1.96 SD 3 2 1 0 -1 -2 -3 VI ST A-n onCS - VI ST A-CS 10 20 30 40 50 60 Average value (mm3)
Lumen volume (normal site)
-1.96 SD Mean +1.96 SD 2 1 0 -1 -2 VI ST A-n onCS - VI ST A-CS 0 5 10 15 20 Average value (mm3)
Lumen volume (lesion site)
-1.96 SD Mean +1.96 SD A
patient, normal walls were clearly demonstrated in more than half of the analyzed segments in both VISTA-nonCS and VISTA-CS. Lesion walls were also better delineated with VISTA-nonCS than with VISTA-CS (3.84 ± 0.33 vs. 3.57 ± 0.49, p < 0.001). Patients did not receive a grade of 1 for lesion wall delineation in either VISTA-CS or VISTA-nonCS. In VISTA-nonCS, all lesions were clearly demonstrated in more than 270 degrees of circumferential VW sections. In VISTA-CS, except one patient, all lesions were clearly visible in more than 270 degrees of circumferential VW sections. On both VISTA-nonCS and VISTA-CS, substantial agreements were achieved between the two readers with the evaluation criteria: overall image quality, normal wall delineation, and lesion wall delineation (weighted kappa ranging 0.645– 0.693 on nonCS, 0.613–0.667 on CS). VISTA-CS yielded a slightly higher proportion of acceptable images with regard to overall image quality than VISTA-nonCS (VISTA-CS vs. VISTA-nonCS, 84.7% vs. 75.0%, respectively), but the difference did not have statistical significance (p = 0.121, Table 5). VISTA-CS yielded a slightly lower proportion of acceptable images with regard to normal wall delineation than VISTA-nonCS (83.3% vs. 86.1%, respectively), but
the difference was not statistically significant (p = 0.723). All VISTA-nonCS images were acceptable for lesion wall delineation, and 97.8% of VISTA-CS images were acceptable.
DISCUSSION
In the current study, we compared CS and VISTA-nonCS, hoping to increase scan coverage to cover both anterior and posterior circulations with the use of CS. While increasing scan coverage, CS showed or trended towards significantly higher SNRs when applied to VISTA in the VW-MRI. CNR was significantly lower with CS in the lesion sites, while there were no significant differences in the normal sites. VISTA-CS provided comparable overall image quality and normal wall delineation to VISTA-nonCS, but lesion walls were better delineated with VISTA-nonCS. We also observed that similar proportions of VISTA-CS and VISTA-nonCS provided acceptable quality images. Thus, we concluded that CS might be useful when applied to the post-contrast images in intracranial VW-MRIs since it facilitates more scan coverage with slightly shorter scan times without significantly sacrificing image quality.
Several prior studies reported that CS achieved substantial scan time reduction while providing similar or superior SNR, CNR, VW delineation, and image quality in intracranial VW-MRIs (13, 14). Those studies enrolled mostly healthy volunteers; therefore, validation in large patient cohorts was necessary to use CS in clinical practice. Another recent study investigated CS in joint intracranial and carotid VW-Table 4. Comparisons of Qualitative Analysis of VISTA-NonCS and VISTA-CS
VISTA-NonCS VISTA-CS
P*
Reader 1 Reader 2 Kappa Value Reader 1 Reader 2 Kappa Value
Overall image quality 3.08 ± 0.71 3.04 ± 0.68 0.693 3.19 ± 0.64 3.04 ± 0.66 0.613 0.297
1 1 1 1 2
2 12 12 6 8
3 39 42 43 47
4 20 17 22 15
Normal wall delineation 3.46 ± 0.71 3.56 ± 0.69 0.645 3.42 ± 0.73 3.35 ± 0.77 0.662 0.019
1 1 1 1 1
2 6 5 7 10
3 24 19 25 24
4 41 47 39 37
Lesion wall delineation 3.84 ± 0.37 3.84 ± 0.37 0.693 3.67 ± 0.52 3.47 ± 0.55 0.667 < 0.001
2 0 0 1 1
3 7 7 13 22
4 38 38 31 22
Data is presented with mean ± SD or n. *Average scores from two readers were compared between VISTA-nonCS and VISTA-CS.
Table 5. Comparisons of Acceptable Quality Images between VISTA-NonCS and VISTA-CS
VISTA-NonCS VISTA-CS P*
Overall image quality (%) 75.0 84.7 0.121 Normal wall delineation (%) 86.1 83.3 0.723 Lesion wall delineation (%) 100.0 97.8 > 0.999 *p value was calculated from McNemar’s test.
MRIs in 28 subjects, including 20 stroke patients, and concluded that CS reduced scan time by almost half without compromising wall thickness measurements or diagnostic wall visualizations (22). This study, however, used CS only in non-contrast images and the sample size was also small. Here, we applied CS to post-contrast images in a relatively large number of patients who underwent intracranial VW-MRIs for specific reasons and performed both VISTA-CS and VISTA-nonCS. Post-contrast images, which are an essential part of VW-MRIs since they help detect lesions and define the cause of luminal narrowing (2, 16), were chosen for analysis in our study. Instead of reducing scan acquisition time with CS, as seen in previous studies, we increased scan coverage while maintaining a similar acquisition time since larger scan coverage has strengths in clinical practice. Before CS was applied, images were usually limited to a target region covering either anterior or posterior circulation or known stenotic lesions to achieve high resolution in a reasonable scan time. Since scan coverage was increased to cover anterior and posterior circulations by applying CS, we were able to find incidental lesions located in the non-target vessels that might have been missed in VW-MRIs without CS. Especially in patients with intracranial atherosclerosis, atherosclerotic plaques are frequently found in multiple arterial segments (23, 24), necessitating broad imaging coverage of the brain. In addition, radiologists should confirm the scan region in each VW-MRI when CS is not applied (3). This is unnecessary when scan coverage is increased with CS and VW-MRI can be performed without asking radiologists to determine the scan site and without imaging delay. In addition to the benefits from more scan coverage, we found that CS still achieved acceptable image quality that did not significantly affect radiological interpretations; therefore, CS could be a useful method for intracranial VW-MRIs.
A greater acceleration factor introduces more artifacts, blurring, and image degradation (7, 25, 26). Prior investigations of CS in VW-MRI have used acceleration factors ranging from 1.5 to 10 (12-14, 26, 27). For carotid wall evaluation, images obtained with two-fold to five-fold acceleration achieved acceptable image quality that was not significantly different from full acquisition (12, 27). CS also provided robust and repeatable results with an acceleration factor of 1.5 (15). Further, CS with an acceleration factor of 3–5 applied to intracranial VW-MRIs yielded higher or comparable image quality to marked time reductions (13, 14). Here, we used an extra reduction factor of 1.5 in
VISTA-CS, which did not significantly affect image quality. Several CS-related artifacts were reported in previous studies. For instance, Sharma et al. (25) described a global ringing artifact and fine detail blurring in the brain. Worters et al. (28) reported that CS images looked slightly blurrier compared to the original images, possibly due to a denoising effect in the CS reconstruction. In our study, we noted blurring in VISTA-CS as seen previously. This may have affected normal and lesion wall delineation and, thus, led to score reductions in the visual assessment; however, most VISTA-CS images allowed for VW assessments similar to VISTA-nonCS images in the present study. Furthermore, coarse, ripple-like artifacts potentially related to SENSE with limited coverage were more prominent in VISTA-nonCS than in VISTA-CS. Thus, we concluded that artifacts of different characteristics exist in VISTA-CS images without significant impact on intracranial VW-MRI assessments.
VISTA-CS elicited superior SNR from the lumen of both normal and lesion sites and the wall of normal sites in the present study, which was similar to previous studies’ results (13). The SNR increases observed in CS may result from the denoising process in CS reconstruction (8). Furthermore, increased scan coverage in VISTA-CS may increase SNR while reducing aliasing and SENSE-related artifacts. A SNR increase in the lumen, however, might not be desirable since it has a negative effect on the contrast between the lumen and VW wall, affecting the radiologists’ VW assessment. Despite a higher SNR in VISTA-CS, the qualitative analysis by two neuroradiologists revealed that normal and lesion wall delineations were superior in VISTA-nonCS. Meanwhile, wall SNR of lesion sites did not differ significantly between the two sequences. This might be associated with differing time intervals between contrast injection and scan acquisition. Since VISTA-nonCS was obtained before VISTA-CS, delayed enhancing lesions may be more enhanced with VISTA-nonCS than VISTA-CS, increasing the SNR in VISTA-VISTA-nonCS. This phenomenon might cancel out the SNR increase in the VISTA-CS. Since VISTA-CS revealed comparable wall SNR and higher lumen SNR than VISTA-nonCS, CNR was subsequently lower than with VISTA-nonCS at lesion sites; however, the CNR of the lesion site with VISTA-CS was high (more than 4) and most VISTA-CS images provided acceptable quality images for lesion wall delineation. Moreover, the volumes of enhancing lesions did not differ significantly between VISTA-nonCS and VISTA-CS. Thus, VW assessments may not be affected with CS in intracranial VW-MRIs.
First, this is a retrospective study, which might introduce selection bias to our results. To mitigate selection bias, we searched all VW-MRIs performed in a certain time period, but future studies with prospective design are needed to validate our study results. Second, VISTA-nonCS was obtained after VISTA-CS in all patients. This potentially introduced differences in the degree of enhancement between the two scans. The volumes of lesion walls, which were calculated based on the VOIs drawn on the enhancing portions, did not differ significantly between VISTA-nonCS and VISTA-CS; therefore, the differences in the degree of enhancement between the two sequences might not significantly affect the image interpretation. Still, further studies performing contrast-enhanced images with and without CS in a randomized order are required to validate our study results. Third, scan coverage was increased when CS was applied, altering imaging protocols between VISTA-nonCS and VISTA-CS; however, all other scan parameters were the same between VISTA-nonCS and VISTA-CS, so we consider the two protocols to be comparable. Fourth, completely blinded interpretations of VISTA-nonCS and VISTA-CS were not possible since the two sequences provided different coverages and specific patterns of artifacts, which were easily distinguishable by the reviewers.
In conclusion, CS achieved comparable SNR, CNR, image quality, and wall delineation when applied to post-contrast images of intracranial VW-MRIs, while simultaneously increasing scan coverage and maintaining a similar scan acquisition time. Thus, CS may be useful when applied to intracranial VW-MRIs.
Conflicts of Interest
The authors have no potential conflicts of interest to disclose.
ORCID iDs Chae Jung Park
https://orcid.org/0000-0002-5567-8658 Jihoon Cha
https://orcid.org/0000-0002-1662-8041 Sung Soo Ahn
https://orcid.org/0000-0002-0503-5558 Hyun Seok Choi
https://orcid.org/0000-0003-4999-8513 Young Dae Kim
https://orcid.org/0000-0001-5750-2616
Hyo Suk Nam
https://orcid.org/0000-0002-4415-3995 Ji Hoe Heo https://orcid.org/0000-0001-9898-3321 Seung-Koo Lee https://orcid.org/0000-0001-5646-4072
REFERENCES
1. Dieleman N, van der Kolk AG, Zwanenburg JJ, Harteveld AA, Biessels GJ, Luijten PR, et al. Imaging intracranial vessel wall pathology with magnetic resonance imaging: current prospects and future directions. Circulation 2014;130:192-201 2. Mandell DM, Mossa-Basha M, Qiao Y, Hess CP, Hui F, Matouk
C, et al. Intracranial vessel wall MRI: principles and expert consensus recommendations of the American Society of Neuroradiology. AJNR Am J Neuroradiol 2017;38:218-229 3. Lindenholz A, van der Kolk AG, Zwanenburg JJM, Hendrikse J.
The use and pitfalls of intracranial vessel wall imaging: how we do it. Radiology 2018;286:12-28
4. van der Kolk AG, Zwanenburg JJ, Brundel M, Biessels GJ, Visser F, Luijten PR, et al. Intracranial vessel wall imaging at 7.0-T MRI. Stroke 2011;42:2478-2484
5. Qiao Y, Steinman DA, Qin Q, Etesami M, Schar M, Astor BC, et al. Intracranial arterial wall imaging using three-dimensional high isotropic resolution black blood MRI at 3.0 Tesla. J Magn
Reson Imaging 2011;34:22-30
6. Hollingsworth KG. Reducing acquisition time in clinical MRI by data undersampling and compressed sensing reconstruction. Phys Med Biol 2015;60:R297-R322 7. Jaspan ON, Fleysher R, Lipton ML. Compressed sensing
MRI: a review of the clinical literature. Br J Radiol 2015;88:201504878
8. Lustig M, Donoho D, Pauly JM. Sparse MRI: the application of compressed sensing for rapid MR imaging. Magn Reson Med 2007;58:1182-1195
9. Yoon JK, Kim MJ, Lee S. Compressed sensing and parallel imaging for double hepatic arterial phase acquisition in gadoxetate-enhanced dynamic liver magnetic resonance imaging. Invest Radiol 2019;54:374-382
10. Cheng JY, Zhang T, Ruangwattanapaisarn N, Alley MT, Uecker M, Pauly JM, et al. Free-breathing pediatric MRI with nonrigid motion correction and acceleration. J Magn Reson Imaging 2015;42:407-420
11. Yoon JH, Lee SM, Kang HJ, Weiland E, Raithel E, Son Y, et al. Clinical feasibility of 3-dimensional magnetic resonance cholangiopancreatography using compressed sensing: comparison of image quality and diagnostic performance.
Invest Radiol 2017;52:612-619
12. Li B, Li H, Kong H, Dong L, Zhang J, Fang J. Compressed sensing based simultaneous black- and gray-blood carotid vessel wall MR imaging. Magn Reson Imaging 2017;38:214-223
13. Suh CH, Jung SC, Lee HB, Cho SJ. High-resolution magnetic resonance imaging using compressed sensing for intracranial and extracranial arteries: comparison with conventional parallel imaging. Korean J Radiol 2019;20:487-497
14. Zhu C, Tian B, Chen L, Eisenmenger L, Raithel E, Forman C, et al. Accelerated whole brain intracranial vessel wall imaging using black blood fast spin echo with compressed sensing (CS-SPACE). MAGMA 2018;31:457-467
15. Yuan J, Usman A, Reid SA, King KF, Patterson AJ, Gillard JH, et al. Three-dimensional black-blood multi-contrast carotid imaging using compressed sensing: a repeatability study.
MAGMA 2018;31:183-190
16. Mandell DM, Matouk CC, Farb RI, Krings T, Agid R, terBrugge K, et al. Vessel wall MRI to differentiate between reversible cerebral vasoconstriction syndrome and central nervous system vasculitis: preliminary results. Stroke 2012;43:860-862 17. Edjlali M, Gentric JC, Regent-Rodriguez C, Trystram D, Hassen
WB, Lion S, et al. Does aneurysmal wall enhancement on vessel wall MRI help to distinguish stable from unstable intracranial aneurysms? Stroke 2014;45:3704-3706 18. Nagahata S, Nagahata M, Obara M, Kondo R, Minagawa N,
Sato S, et al. Wall enhancement of the intracranial aneurysms revealed by magnetic resonance vessel wall imaging using three-dimensional turbo spin-echo sequence with motion-sensitized driven-equilibrium: a sign of ruptured aneurysm?
Clin Neuroradiol 2016;26:277-283
19. Fedorov A, Beichel R, Kalpathy-Cramer J, Finet J, Fillion-Robin JC, Pujol S, et al. 3D slicer as an image computing platform for the quantitative imaging network. Magn Reson
Imaging 2012;30:1323-1341
20. Zhang Z, Fan Z, Carroll TJ, Chung Y, Weale P, Jerecic R, et al. Three-dimensional T2-weighted MRI of the human femoral
arterial vessel wall at 3.0 Tesla. Invest Radiol 2009;44:619-626
21. Fan Z, Yang Q, Deng Z, Li Y, Bi X, Song S, et al. Whole-brain intracranial vessel wall imaging at 3 Tesla using cerebrospinal fluid-attenuated T1-weighted 3D turbo spin echo. Magn Reson
Med 2017;77:1142-1150
22. Jia S, Zhang L, Ren L, Qi Y, Ly J, Zhang N, et al. Joint intracranial and carotid vessel wall imaging in 5 minutes using compressed sensing accelerated DANTE-SPACE. Eur
Radiol 2020;30:119-127
23. Qiao Y, Guallar E, Suri FK, Liu L, Zhang Y, Anwar Z, et al. MR imaging measures of intracranial atherosclerosis in a population-based study. Radiology 2016;280:860-868 24. Wu F, Ma Q, Song H, Guo X, Diniz MA, Song SS, et al.
Differential features of culprit intracranial atherosclerotic lesions: a whole-brain vessel wall imaging study in patients with acute ischemic stroke. J Am Heart Assoc 2018;7:e009705 25. Sharma SD, Fong CL, Tzung BS, Law M, Nayak KS. Clinical
image quality assessment of accelerated magnetic resonance neuroimaging using compressed sensing. Invest Radiol 2013;48:638-645
26. Sandilya M, Nirmala SR. Compressed sensing trends in magnetic resonance imaging. Eng Sci Technol Int J 2017;20:1342-1352
27. Li B, Dong L, Chen B, Ji S, Cai W, Wang Y, et al. Turbo fast three-dimensional carotid artery black-blood MRI by combining three-dimensional MERGE sequence with compressed sensing. Magn Reson Med 2013;70:1347-1352 28. Worters PW, Sung K, Stevens KJ, Koch KM, Hargreaves
BA. Compressed-sensing multispectral imaging of the postoperative spine. J Magn Reson Imaging 2013;37:243-248