Automatic Control on Dosing Coagulant as to Stream Current
Sueg-Young Oh*, Doo-Gyoon Byun*, Jae-Moon Hwang*, Hyun-Sung Song*
*Water Supply Equipment & Automation Dept. of Korea Water Resources Corporation, San 6-2, Yeonchuk-Dong, Daedeok-gu, Daejeon 306-711, Korea (Tel : +82-42-629-3759; E-mail:ohs@kowaco.or.kr, dgbyun@kowaco.or.kr, hjm@kowaco.or.kr, shs0211@kowaco.or.kr)Abstract: As recently raw water quality has been polluted as well as its quality has been remarkably varied according to season
and region, the precise control of coagulant dosage is being keenly required in water treatment plants. The amount of coagulant is closely related to raw water quality such as turbidity, alkalinity, water temperature, pH, electrical conductivity, etc. Since the optimum quantity of chemicals is not yet finalized, so dosage rate must be decided by using jar test that takes one or two hours. Hereupon, the output signal of stream current and multi-regression on historical data were proposed to be applied to the coagulant dosing control. In consequence of applying the scheme to automatic determination of the dosage rate, it was testified that the determination of dosage rate was very effective in case it is performed as to real-time sensing of water quality and the output signal of stream current.
Keywords: Automatic control, Dosage Rate of Coagulant, Stream Current, Turbidity
1.
Introduction
determination of coagulant dosing rate. It is possible to applied the Fuzzy Neural network to the modeling of water treatment process control due to the learning capacities of nonlinearity[1]. But, this method is difficult to apply for field. In the solid-liquid separation that resolves the turbidity of
water, various methods such as filtration, sedimentation, centrifugation, etc. are being currently applied. Ordinarily, each water treatment plant adopts coagulation and sedimentation. In actual purification, the effect of coagulation is affected by the quantity of turbidity inducer and those kinds, the size of particles, specific ions, pH, alkalinity, etc. Nevertheless, water treatment plants usually determine the dosage rate of coagulant based on the look-up table drawn up as to raw water turbidity and water temperature, on the basis of the former result of jar test. As the case stands, the approximate quantity of coagulant is dosed in case raw waters have the same turbidity, and the former rate may be applied at times; hence, the influence of other factors on water quality cannot be properly worked out.
The dosage method presented in this paper was bottomed upon polynomial regression, that is, the dosing rate is determined by polynomial regression, and the determined value is corrected by the output value of stream current detector (SCD) and again the corrected value controls the dosage.
The dosage rate that has been determined by the polynomial regression is subordinated to the output value of SCD, which is applied to the delicate control on coagulant dosing rate in real-time feedback.
Since the water treatment process is absolutely affected by the operative method of coagulant dosing system, water treatment plants are tending toward automation and integration. Going with the tide, the automation of coagulant dosing should be necessarily realized.
2. Theoretical Background
2.1 Coagulation[2]
Generally, the determination of coagulant dosing rate depends on the results of jar-test for raw water. But it is difficult to decide on the correct coagulant dosing rate by a jar-test system: not only because it is difficult to positively deal with the change of water quality, but also because there is a few hours detention time between the rapid mixing basin where coagulant is fed and the sedimentation basin where the effect of turbidity elimination can be measured. Therefore, we have contrived a learning type fuzzy controller that can automatically form the control rule and membership function from previous water quality data and it is applied to the the
Coagulation is that masses the minute particles, which are dispersing underwater, through dosing chemicals and such materials coagulated can be separated by sedimentation, suspension, filtration, etc. Coagulation is based on the theoretical principle that facilitates sedimentation by changing the electric specifics of colloids and decreasing the surface area on weight. The mechanism of coagulating suspended particles is largely divided into two; the one is that electric charges of the fine particles under liquid suspension is neutralized by the coagulant having the opposite electric charge and surface potential falls by nearly zero when ICCAS2005 June 2-5, KINTEX, Gyeonggi-Do, Korea
ICCAS2005 June 2-5, KINTEX, Gyeonggi-Do, Korea particles approach as a result, those are easily coagulated. The
other is that the high-molecular substances stuck on the surface of suspended particles function as the bridge linking particles so coagulation may be arisen. Those are what we call ‘the theory of charge neutralization’ and ‘the theory of bridge’, respectively.
2.2 Measurement of Stream Current
The SCD is to measure electric change that arises underwater after coagulant dosage. The particles charged with electricity under sample water are momentarily stuck to the piston that reciprocates in SCD, which moves following the stream of electrode. The value of stream current (SC) is to electrically output the electric current measured at the time that the particles move following the stream of electrode. The value of stream current is closely related to zeta potential. Zeta potential means the potential that is being on a section when the colloid particles charged with electricity are moving on electric field. Helmholtz expressed the zeta potential as follows:
H
u
H
SP
]
4
(1) where ȗ is zeta potential of particle, µ viscosity of water, u electropholysis of particle,İ dielectric constant of water, and H strength of electric field.Equation (1) shows that zeta potential is proportionally connected with electrophoretic mobility. Zeta potential can be measured per particle, but its error grows wider in case a representative particle is not selected. On the other hand, the error of SC value grows narrower because it is measured as to the consecutive stream of particles. The SC value and zeta potential is expressed as follows:
ul
pR
I
4
2]
H
(2)where I is stream current, p applied pressure, R passage radius of sample water, and l passage length of sample water.
The unit of SC value adopts mV like zeta potential’s, or adopts dimensionless numbers. Equation (2) is also showing a proportional relation with the electrophoretic mobility, like the preceding equation (1). Thus, turbidity and coagulation state can be grasped by just SC value because zeta potential is proportion to electrophoretic mobility and is related to particle size and strength and it is possible to presuppose the removal of turbidity. However, the SCD that are being currently used in water treatment plants cannot be applied to the initial
expression as those have been changed from the initial equipments.
2.3 The Method of Measurement
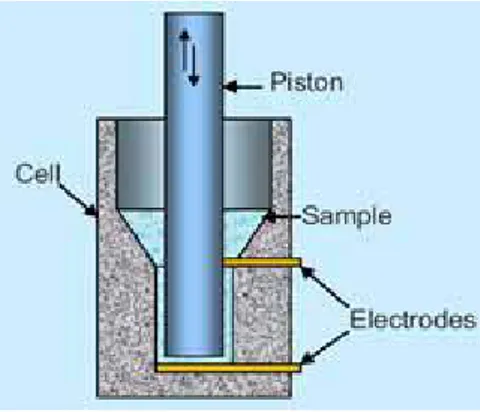
The Stream Current cell determines the charge of the sample and hence the end point of the titration. The cell consists of a precision bore cylinder closed at the bottom end and containing two electrodes, one at the bottom, and one approximately a third of the way up. The electrodes are connected to the contacts extending from the lower front of the instrument housing. The measurement cell is designed as a container to allow sample to be poured in from the top. The typical sample volume is 50ຸ. A precision piston oscillates up and down in the cylinder with a frequency of approximately 4Hz. Polymer, having a tendency to absorb onto surface, become attached to the piston and cylinder walls. This stream current is measured by the electronics in the main unit.
Figure 1 shows the cell for measure.
Fig. 1 Measurement Cell
3. System Configuration
Raw water turbidity, electrical conductivity, SC value, pH and the turbidity of sedimentation basin are measured by the measurers equipped gauging well, mixing basin, sedimentation basin, etc. Such data is used to output SC target value after being operated by controller. Coagulant dosing rate is determined based on the SC target value and SC deviation. Afterwards, the determined value is forwarded to the dosage control system and the coagulant is dosed as to the flux of raw water. Granted that the electric neutralization degree of coagulant dosing rate measured by the jar test is measured by SC meter, but the SC target value, which was corrected through the electrical conductivity of gauging well and the pH value of mixing basin, should be set on controller because the SC value maybe changed as to electrical conductivity, pH, etc. The coagulant can be optimally dosed in case the dosing rate is controlled in order that the set values may be maintained.
ICCAS2005 June 2-5, KINTEX, Gyeonggi-Do, Korea The following figure 2 shows the measurable factors and the
measurers positioned at each point[3][5].
The SCD and the control system were equipped between mixing and coagulation process, and it was set so that the coagulant dosage pump can be controlled as to SC value. The control system could directly control Proportional Band (PB) through proportional control method, and it was set by 400% during the experiment. SC sensor was equipped at the underside of sample-gathering point so samples may be transferred in gravity type, and the samples flowed in at the flux of 3L/min through 25mm radius pipe. The set point of SC was fixed to 0±0.5. Controller SP M PAC SP SP
Settling Mixing Flocculation
Sedimentation Turbidity Electrical Con. SC Sensor pH Meter Turbidity Flow Dosing of Coagulant
4-1. The System Applicability on the Change of Raw water Turbidity
Figure 4 shows the reaction of SCD on the change of raw water turbidity and the change of pump output geared with it.
In the case where turbidity was increased from 1.4NTU to 5 ~ 10NTU, SCD was geared with the pump output to keep the fixed set point 0.5. Since raw water turbidity was not conspicuously changed, it was impossible to evaluate the interoperability in high turbidity. As shown in the figure 4, SC fell by -0.4 when raw water turbidity was changed and pump output was increased from 28.5% to about 30%. Like so, SC value was operated keeping the set point after alternating between increase and decrease within a scope. Although the case where high turbidity flows in raw water was not evaluated, it had been clarified that SCD reacts upon the change of turbidity and the pump is geared with such values. Fig. 2 Block Diagram on Measurement
Figure 3 shows the logic diagram on controlling coagulant dosage.
Stream Current(SC)
Compare SC and Set Point(SP)
Delay 240sec
Compare Dosing Rate and Deadband
Previously Dosing Rate + Ratio of SC SP > SC SP < SC Dosing < Lower Deadband Dosing > Upper Deadband
Fig. 4 Automatic Control of SCD on the Change of Raw Water Turbidity
Fig. 3 Logic Diagram on Controlling Coagulant Dosage
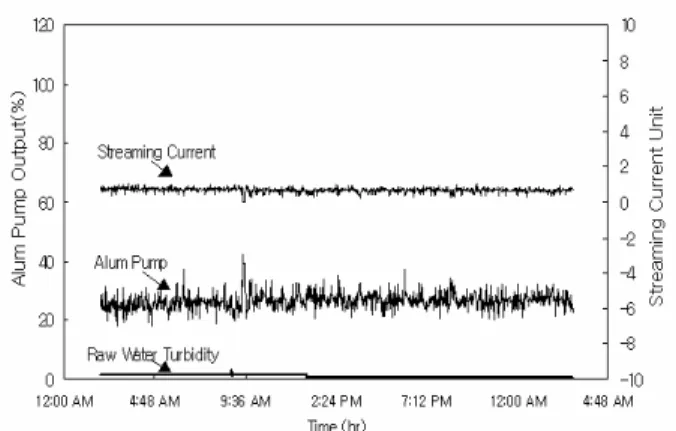
4-2. Control on Normal Operation
4. On-the-Spot Application
Figure 5 shows the turbidity of raw water, SC value and theoutput rate (%) of alum pump in case of normal operation. Since SCD can successively measure the state of charged
particles, it can monitor and control dosing coagulant as well as can cope with the sudden change of raw water flux and turbidity. In this paper, the automatic control on dosing coagulant was presented to effectively operate mixing and coagulation process. Namely, the control system is based on SCD and automatically controls the dosage of coagulant.
The raw water turbidity had been maintained 1NTU at normal times. Also, SC value had been maintained within the set point 0.5, notwithstanding that it was somewhat changed by the change of the raw water flowed in. In such a case, the output rate of alum pump was also geared with the SC value. This result shows that the SC value was maintained within a
ICCAS2005 June 2-5, KINTEX, Gyeonggi-Do, Korea regular value as the alum dosage was kept between 20 and
40%.
Fig. 5 SC Value and Alum Dosing Rate on Normal Operation
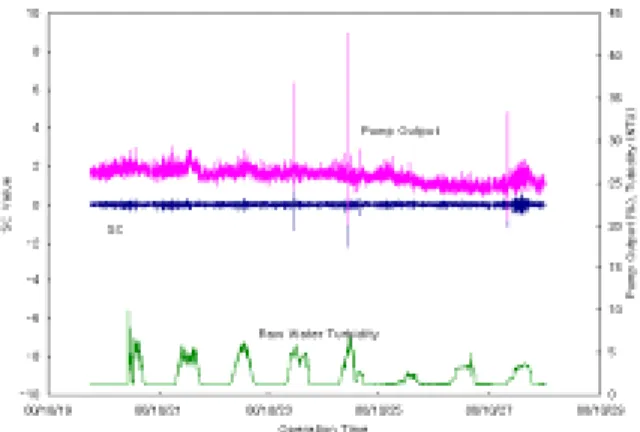
4-3. Control on the Change of Raw Water Quality
Figure 6 shows the SC value, which was indicated while the turbidity of raw water was being changed, and the change of alum dosing rate geared with it.
Fig. 6 SC Value and Alum Dosing Rate on the Change of Raw Water Turbidity
Considering the figure, SC value was decreased and alum dosing rate was increased, relating to the increase of turbidity. When the turbidity of raw water was being maintained over 10NTU for a long time, SC value was gradually decreased and was finally maintained the numeric of -0.5. Afterwards, it was maintained the former stable value as the turbidity was decreased, but the turbidity was somewhat increased compared with the previous state. The SC value was also set up at the vicinity of zero after stabilization. At that time, alum dosing rate was changed as to SC value; the output of alum pump was increased from 30% to 60% as the SC value indicated the numeric of -0.5, and was again stabilized at the level of 40%. Altogether, SCD automatically changed the SC value gearing with the change of raw water turbidity
concurrently with alum dosing rate; it was possible to automatically control alum dosing rate bottomed upon the change of raw water turbidity.
However, the problem is that coagulant dosing rate was irregularly changed in the case where high turbidity was flowed in raw water. Actually, SC value was unstably mobile when high turbidity was flowed in raw water though SCD stably dosed coagulant at normal times. For this why, the related operators feel uneasy about SCD being overcome with anxiety that the scope of optimum coagulant dosage might be deviated. It was considered that SCD is very sensitive to electrical conductivity. Likewise, it was observed that the SC value was remarkably changed by 2.5 times as to coagulant dosage when high turbidity was flowed in.
The point of zero charge (PZC) did not always have to be obtained. Under certain conditions, reaching the PZC even proved to be disadvantageous[4]. This could be demonstrated in flocculation tests carried out in both the laboratory and pilot plant. By titration with cationic polymers used in the treatment plant the negative charge concentration could be appropriately analyzed. For this process, the SCD was successfully employed as indication system.
5. Conclusions
5.1 The possibility of coagulant automatic dosage was examined using the SCD value in treated water quality. 5.2 The SC value was remarkably changed as to coagulant dosage in the case where high turbidity was flowed in raw water.
5.3 It is possible for the plants needing remote control to automatically operate coagulant dosage through SCD in normal times, but it is necessary to look out for the change of water quality when high turbidity is flowed in.
REFERENCES
[1] Woo Seop Chung, Sueg Young Oh, "Automatic Determination of Coagulant Dosing Rate using Intelligent Control", IAWQ Specialist Group on Instrumentation, Control and Automation, July 1997. [2] Seong Kim & Seong Heon Kim, "A Study on
Determining Coagulant Dosing Rate Using the Jar Test", Hong, Paper of KSWW (Korea Society of Water and Wastewater), pp.39-41, June 1993.
[3] Sano Shigeo, et. al., "An Experiment on Coagulant Automatic Dosage through Stream Current Measurement (I)", The 54th Japanese Waterworks Presentation Meeting, May, 2003
[4] H. Bernhard and H. Schell, "Control of flocculants by use of a streaming current detector(SCD)", J Water SRT-Aqua Vol. 42, No. 4, pp. 239-251, 1993.
[5] L.Tian, A. J. Niemi and R. Ylinen, "Robust control under variable flow and volume", IEEE, pp. 781-786, 1994.