INVESTIGATION OF THE PILE MOVEMENT DUE TO TUNNELLING
BY MODEL TEST AND NUMERICAL ANALYSIS
YONGJOO LEEi)
ABSTRACT
In this study, a series of two-dimensional model test and numerical analysis was carried out to investigate the pile movement due to tunnelling in soft ground. The model test consists of 21 cases according to locations of the pile tip over the centre position of model tunnel. To identify both the pile and ground movements a close-range photogrammetric technique was adopted in the model test. The results from the model test were compared to the two-dimensional finite element analysis using the CRISP program. It was found that the rotation point on the pile was significantly affected by factors such as the offset distance from the model tunnel and the volume loss that occurred during the tunnelling operation.
Key Words : Tunnelling, Soft Ground, Pile Rotation Point, Model Test, CRISP FE Analysis
1 INTRODUCTION
In urban areas, most buildings and high-pass piers are supported by piles. It is questionable for the pile behaviour if the tunnel construction progresses adjacent to such loaded existing piles. These loaded piles are normally arranged by a row formation that can be considered as wall. In this study, the author has conducted a series of two-dimensional model test and numerical analysis to investigate the pile movement due to tunnelling in soft ground.
2 MODEL TEST AND NUMERICAL ANALYSIS
This paper describes the interactive pile movement due to tunnelling under plane-strain conditions. The investigation was carried out using (i) the finite element technique, and (ii) laboratory 2D model pile-soil-tunnelling interaction tests (Lee, 2004).
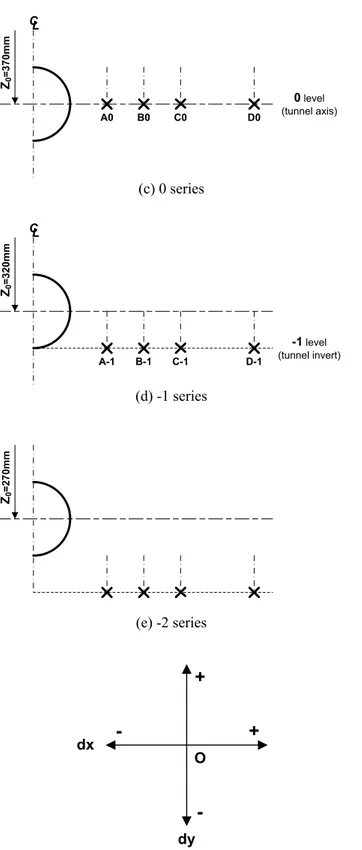
In total, 21 FE cases were studied using a fixed length end bearing-pile with the tunnel based at various locations as shown in Figure 1
Z0 =470 mm
(a) +2 series Z0 =42 0mm CL A+1 B+1 C+1 D+1 +1level (tunnel crown) (b) +1 series
Z0 =37 0mm CL A0 B0 C0 D0 0level (tunnel axis) (c) 0 series Z0 =32 0mm CL A-1 B-1 C-1 D-1 -1level (tunnel invert) (d) -1 series Z0 =27 0mm (e) -2 series dx dy
-+
+
O(e) Movement directions for tunnel and pile Figure 1. Geometry of the pile-soil-tunnelling interaction model test series.
These locations were consistent with the physical model tests. It proved very complex in a FE analysis to allow the whole tunnel to “free float” during its construction while controlling the volume loss by fixed tunnel boundary displacements.
Eventually, the actual experimentally observed
tunnel centre displacements were applied to each individual computer run. The pile responses, including settlements and the lateral pile movements at the tip and the head as shown in Figure 2 providing overall tilt, were investigated for each volume loss value in both the FEA and the laboratory 2D model.
Original pile position before reduction of tunnel diameter Original tunnel position before reduction of tunnel diameter
Point of rotation of pile
Pilel tip
Pile head x(head)
y(head)
x(tip) y(tip) Lp
sin =[x(head)+x(tip)]/Lp
Note: y(head)= y(tip)
x y "Floating model tunnel" after volume loss Tilted pile position after volume loss : angle of pile-tilt Initial tunnel centre point Shifted tunnel centre point
Figure 2. Schematic diagram of overall pile-tilt during volume loss (A pile head is subjected to the vertical loading in the model test).
2.1 Tunnel centre movements for the floating model tunnel
The tunnel model based on the diameter-reduction method consists of six segments, the two ends of a segment being carved on tapered cones (Lee and Bassett, 2006a). Each segment will move inward as the tapers are withdrawn, simulating the 2D volume loss (VL) during tunnelling operations. The tunnel diameter
is reduced by rotating the two knobs. The outer diameter of the tunnel is initially 100 mm. The reduction of the tunnel diameter gives directly a 2D volume loss. This is determined from the calibration result.
To simulate the “floating tunnel” in the finite element analysis, the movements of the centre point of the tunnel were defined by the two components, horizontal and vertical movements. These movements were defined for each level of the tests (viz. +2, +1, 0, -1, -2). It would appear that the behaviour of a tunnel during construction is independent of the influence of an end-bearing pile, if the pile tip is 1d0 (d0 = D =
100mm) below the centre of the tunnel.
2.2 Analysis conditions
The ground was modelled as aluminium rods and assumed to be linear elastic-perfectly plastic and
non-associated flow rule. This model has been introduced and coded in the CRISP. Table 1 shows the material properties used in the finite element analysis (FEA). It is noted that Young’s modulus at the surface (E0) varies with depth, i.e. a gradient factor (mE) used.
An isotropic elastic model was used to model the pile. And the bar element was used to model the model tunnel boundary.
For all comparisons with the laboratory model tests and the determination of Pw (pile working load),
the rod material properties (i.e. angle of shearing resistance, φ′ = 23°, dilation angle, ψ = 15°, and unit weight, γbulk = 24 kN/m3) used in the FEA were based
on a best fit to the load-displacement curve for the physical test concerning pile with no tunnel. These parameters were obtained by FE parametric study with various material properties.
Table 1. Material parameters used in the FEA Material c′ (kPa) ν (°) φ′ (°) ψ Ground 0.1 0.35 23 15 Pile - 0.20 - - Bar - 0.20 - - Material E0
(MPa) (MPa/m) mE (kN/mγbulk3) K0
Ground 1.6 10 24 0.66
Pile 15,500 - 23 -
Bar 15,500 - - -
In the finite element analysis, the FNR iterative solution scheme was adopted together with a tolerance of 0.05 and a maximum iteration number of 100. K0
was applied for the initial in-situ stress conditions. The double convergence check was adopted, and a total of 1,055 increments were used, as summarised below in Table 2.
Table 2. Increment block parameters Increment
block No Increment block list
1 Installation of tunnel bar and pile elements 2 Application of pile working load, Pw
3 Tunnel excavation with supporting bar elements 4 Tunnelling until VL = 3.94 % 5 Tunnelling until VL = 7.63 % 6 Tunnelling until VL = 10.94 % 7 Tunnelling until VL = 15.21 % 8 Tunnelling until VL = 18.65 %
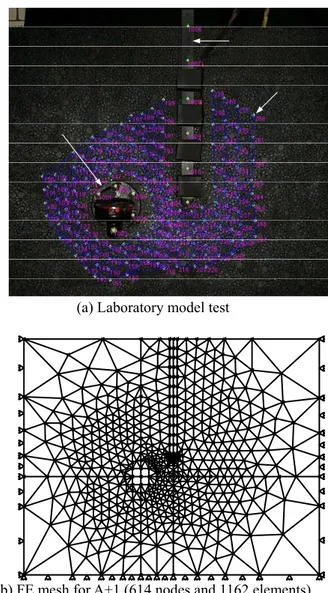
A typical laboratory model test shows the tunnel device, pile, and target points (see Figure 3a). The reflective target points were used for the later image processing. From the image processing, the displacement and strain values can be obtained (Lee
and Bassett, 2006b). In addition, a typical finite element mesh for A+1 was generated (see Figure 3b).
(a) Laboratory model test
(b) FE mesh for A+1 (614 nodes and 1162 elements) Figure 3. Model test vs. FEA.
3 COMPARION BETWEEN MODEL TEST AND FEA
Fundamental points of interest to engineers are the movement of the pile tip and the tilt of the pile together with the point of rotation that occur during the tunnelling operation. From the displacement data, the wall tilts (θ) are directly related to the pile lateral deflection (ρx). The pile settlement (ρy) and lateral
movement at the pile tip are also presented against the increasing volume loss.
3.1 FEA
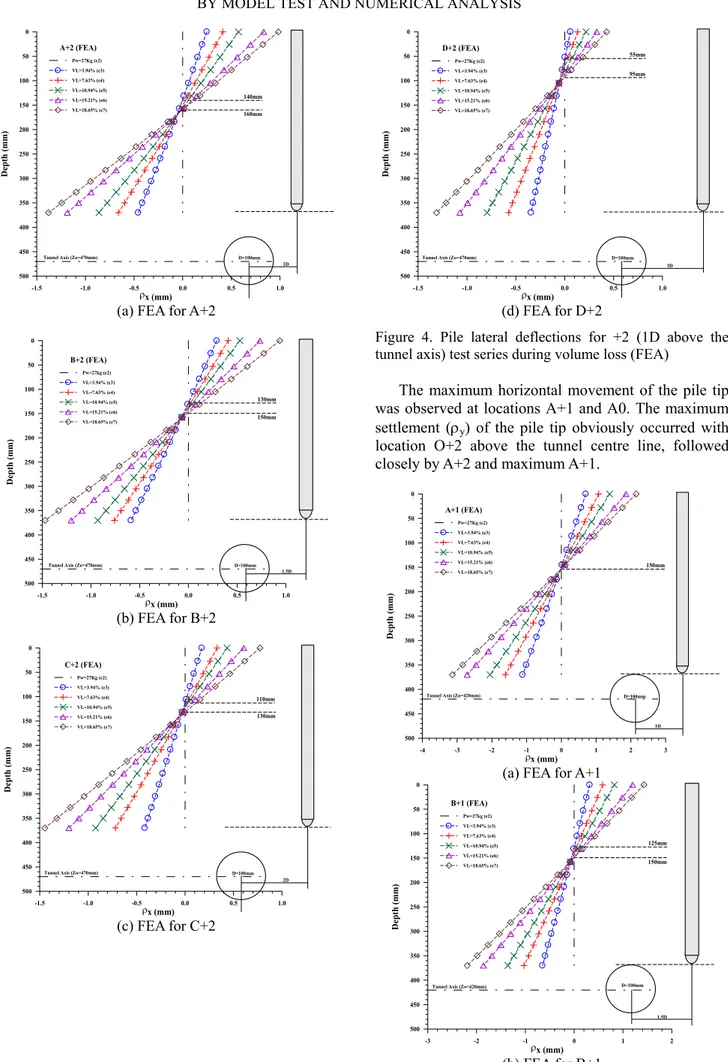
The lateral deflections along the pile are presented in five independent sets for each level: +2, +1, 0, -1 and -2. Among them results of +2 and +1 are shown in Figures 4 and 5.
-1.5 -1.0 -0.5 0.0 0.5 1.0 x (mm) 0 50 100 150 200 250 300 350 400 450 500 Dept h (m m )
Tunnel Axis (Zo=470mm) D=100mm
A+2 (FEA) Pw=27Kg (e2) VL=3.94% (e3) VL=7.63% (e4) VL=10.94% (e5) VL=15.21% (e6) VL=18.65% (e7) 1D ρ 140mm 160mm
(a) FEA for A+2
-1.5 -1.0 -0.5 0.0 0.5 1.0 x (mm) 0 50 100 150 200 250 300 350 400 450 500 De pt h (m m)
Tunnel Axis (Zo=470mm) D=100mm
B+2 (FEA) Pw=27kg (e2) VL=3.94% (e3) VL=7.63% (e4) VL=10.94% (e5) VL=15.21% (e6) VL=18.65% (e7) 1.5D ρ 130mm 150mm (b) FEA for B+2 -1.5 -1.0 -0.5 0.0 0.5 1.0 x (mm) 0 50 100 150 200 250 300 350 400 450 500 De pt h ( mm)
Tunnel Axis (Zo=470mm) D=100mm
C+2 (FEA) Pw=27Kg (e2) VL=3.94% (e3) VL=7.63% (e4) VL=10.94% (e5) VL=15.21% (e6) VL=18.65% (e7) 2D ρ 110mm 130mm (c) FEA for C+2 -1.5 -1.0 -0.5 0.0 0.5 1.0 x (mm) 0 50 100 150 200 250 300 350 400 450 500 Dept h ( m m )
Tunnel Axis (Zo=470mm) D=100mm
D+2 (FEA) Pw=27Kg (e2) VL=3.94% (e3) VL=7.63% (e4) VL=10.94% (e5) VL=15.21% (e6) VL=18.65% (e7) 3D ρ 55mm 95mm (d) FEA for D+2
Figure 4. Pile lateral deflections for +2 (1D above the tunnel axis) test series during volume loss (FEA)
The maximum horizontal movement of the pile tip was observed at locations A+1 and A0. The maximum settlement (ρy) of the pile tip obviously occurred with
location O+2 above the tunnel centre line, followed closely by A+2 and maximum A+1.
-4 -3 -2 -1 0 1 2 3 x (mm) 0 50 100 150 200 250 300 350 400 450 500 Depth (mm)
Tunnel Axis (Zo=420mm) D=100mm
A+1 (FEA) Pw=27Kg (e2) VL=3.94% (e3) VL=7.63% (e4) VL=10.94% (e5) VL=15.21% (e6) VL=18.65% (e7) 1D ρ 150mm
(a) FEA for A+1
-3 -2 -1 0 1 2 x (mm) 0 50 100 150 200 250 300 350 400 450 500 Depth (mm)
Tunnel Axis (Zo=420mm) D=100mm
B+1 (FEA) Pw=27kg (e2) VL=3.94% (e3) VL=7.63% (e4) VL=10.94% (e5) VL=15.21% (e6) VL=18.65% (e7) 1.5D ρ 125mm 150mm (b) FEA for B+1
-3 -2 -1 0 1 2 x (mm) 0 50 100 150 200 250 300 350 400 450 500 Depth (mm)
Tunnel Axis (Zo=420mm) D=100mm
C+1 (FEA) Pw=27Kg (e2) VL=3.94% (e3) VL=7.63% (e4) VL=10.94% (e5) VL=15.21% (e6) VL=18.65% (e7) 2D ρ 120mm 130mm (c) FEA for C+1 -2 -1 0 1 x (mm) 0 50 100 150 200 250 300 350 400 450 500 Dept h ( m m )
Tunnel Axis (Zo=420mm) D=100mm
D+1 (FEA) Pw=27Kg (e2) VL=3.94% (e3) VL=7.63% (e4) VL=10.94% (e5) VL=15.21% (e6) 3D ρ 50mm 73mm (d) FEA for D+1
Figure 5. Pile lateral deflections for +1 (0.5D above the tunnel axis) test series during volume loss (FEA)
The pile shift increased with the volume loss, and at each level the tip movement decreased as the pile became more remote from the tunnel.
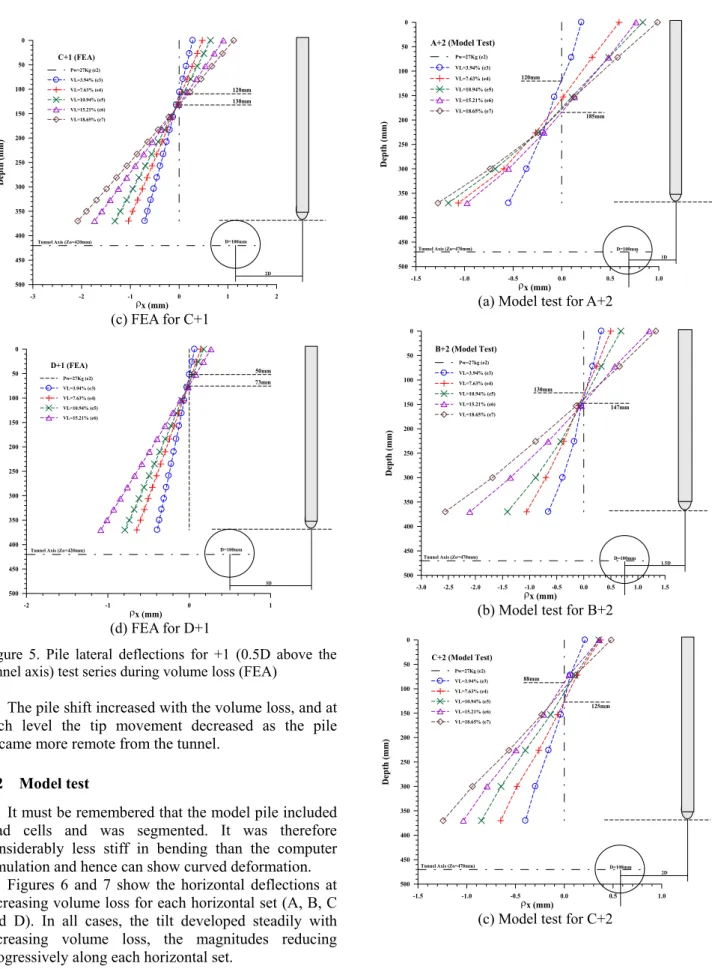
3.2 Model test
It must be remembered that the model pile included load cells and was segmented. It was therefore considerably less stiff in bending than the computer simulation and hence can show curved deformation.
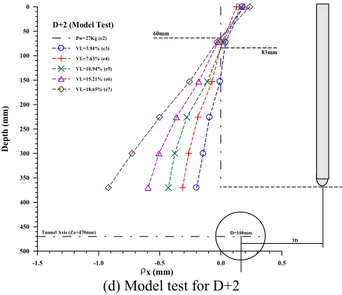
Figures 6 and 7 show the horizontal deflections at increasing volume loss for each horizontal set (A, B, C and D). In all cases, the tilt developed steadily with increasing volume loss, the magnitudes reducing progressively along each horizontal set.
-1.5 -1.0 -0.5 0.0 0.5 1.0 x (mm) 0 50 100 150 200 250 300 350 400 450 500 Dept h (m m )
Tunnel Axis (Zo=470mm) D=100mm
A+2 (Model Test)
Pw=27Kg (e2) VL=3.94% (e3) VL=7.63% (e4) VL=10.94% (e5) VL=15.21% (e6) VL=18.65% (e7) 1D ρ 120mm 185mm
(a) Model test for A+2
-3.0 -2.5 -2.0 -1.5 -1.0 -0.5 0.0 0.5 1.0 1.5 x (mm) 0 50 100 150 200 250 300 350 400 450 500 Depth (mm)
Tunnel Axis (Zo=470mm) D=100mm
B+2 (Model Test) Pw=27kg (e2) VL=3.94% (e3) VL=7.63% (e4) VL=10.94% (e5) VL=15.21% (e6) VL=18.65% (e7) 1.5D ρ 130mm 147mm
(b) Model test for B+2
-1.5 -1.0 -0.5 0.0 0.5 1.0 x (mm) 0 50 100 150 200 250 300 350 400 450 500 Depth (mm)
Tunnel Axis (Zo=470mm) D=100mm
C+2 (Model Test) Pw=27Kg (e2) VL=3.94% (e3) VL=7.63% (e4) VL=10.94% (e5) VL=15.21% (e6) VL=18.65% (e7) 2D ρ 88mm 125mm
-1.5 -1.0 -0.5 0.0 0.5 x (mm) 0 50 100 150 200 250 300 350 400 450 500 Dept h ( m m )
Tunnel Axis (Zo=470mm) D=100mm 3D D+2 (Model Test) Pw=27Kg (e2) VL=3.94% (e3) VL=7.63% (e4) VL=10.94% (e5) VL=15.21% (e6) VL=18.65% (e7) ρ 60mm 83mm
(d) Model test for D+2
Figure 6. Pile lateral deflections for +2 (1D above the tunnel axis) test series during volume loss (Model test)
-6 -5 -4 -3 -2 -1 0 1 2 3 4 x (mm) 0 50 100 150 200 250 300 350 400 450 500 Depth (mm)
Tunnel Axis (Zo=420mm) D=100mm
A+1 (Model Test)
Pw=27Kg (e2) VL=3.94% (e3) VL=7.63% (e4) VL=10.94% (e5) VL=15.21% (e6) VL=18.65% (e7) 1D ρ 150mm 175mm
(a) Model test for A+1
-4 -3 -2 -1 0 1 2 x (mm) 0 50 100 150 200 250 300 350 400 450 500 Depth (mm)
Tunnel Axis (Zo=420mm) D=100mm
B+1 (Model Test) Pw=27kg (e2) VL=3.94% (e3) VL=7.63% (e4) VL=10.94% (e5) VL=15.21% (e6) VL=18.65% (e7) 1.5D ρ 86mm 110mm
(b) Model test for B+1
-3 -2 -1 0 1 2 x (mm) 0 50 100 150 200 250 300 350 400 450 500 Dept h (m m )
Tunnel Axis (Zo=420mm) D=100mm
C+1 (Model Test) Pw=27Kg (e2) VL=3.94% (e3) VL=10.94% (e5) VL=15.21% (e6) VL=18.65% (e7) 2D ρ 60mm 100mm
(c) Model test for C+1
-2 -1 0 1 x (mm) 0 50 100 150 200 250 300 350 400 450 500 Depth (mm)
Tunnel Axis (Zo=420mm) D=100mm
D+1 (Model Test) Pw=27Kg (e2) VL=3.94% (e3) VL=7.63% (e4) VL=10.94% (e5) VL=15.21% (e6) 3D ρ 80mm 102mm
(d) Model test for D+1
Figure 7. Pile lateral deflections for +1 (0.5D above the tunnel axis) test series during volume loss (Model test)
3.3 Comparison of points of rotation
The points of rotation of the FE pile are marked on the individual figures and are also shown in Figure 8a. The points of rotation of the pile move up the pile length as the pile moves from above to below the tunnel and as the pile location moves away from the tunnel centre line. Once the pile moves below the invert at -2 (1d0 below the tunnel centre line), the rotation points
develop within the soil only at extreme volume loss (>15.21%) except for the case of D-2.
In relation to the model pile lateral deflections, the rotation points of the pile are marked on each figure and assembled in Figure 8b. As for the numerical set, the points of rotation of the pile moving progressively upward with increasing offsets from the tunnel centre line. In the model tests, all cases for levels -1 and -2 except A-1 and C-1 show no clear point of rotation.
0 50 100 150 200 250 300 Pile Offset, x (mm) 0 50 100 150 200 250 300 350 Po in t o f R ot atio n (mm )
TEST SERIES (FEA)
+2 (1do above tunnel centre line) +1 (0.5do above tunnel centre line) 0 (tunnel centre line) -1 (0.5do below tunnel centre line) -2 (1do below tunnel centre line)
A=1do B=1.5do C=2do D=3do
CL (a) FEA 0 50 100 150 200 250 300 Pile Offset, x (mm) 0 50 100 150 200 250 300 350 Po in t o f Ro ta tio n (m m)
A=1do B=1.5do C=2do D=3do
TEST SERIES (MODEL TEST)
+2 series (1do above tunnel centre line) +1 series (0.5do above tunnel centre line) 0 series (tunnel centre line) -1 series (0.5do below tunnel centre line)
CL
(b) Model test
Figure 8. Comparison of points of rotation according to the pile offset.
4 CONCLUSIONS
From this study, conclusions are drawn as follows: 1) The FE analyses successfully mimic the model tests.
Although the width of FE model is about 3 times of the length of the piles, there is no influences to the boundary conditions. This is confirmed by the displacement and strain data from the model test using the photo imaging process.
2) The movements of the centre point of the tunnel are investigated to simulate the “floating tunnel” in the finite element analysis. These tunnel movements are
strongly influenced by the location and passive loading of the pile tip. However, the lowest pile location (-2 test set) appears to be independent of the tunnel construction.
3) The rotation points of the pile are dependent on the relative geometry of the tunnel and pile position. FEA shows almost linear variation with the pile offset, while the model test responding to the curved variation.
REFERENCES
1) Lee, Y. J. (2004): Tunnelling adjacent to a row of loaded piles, PhD Thesis, University College London, London. 2) Lee, Y. J. and Bassett, R. H. (2006a): A model test and
numerical investigation on the shear deformation patterns of deep wall-soil-tunnel interaction, Can. Geotech. J. Vol. 43, pp. 1306-1323.
3) Lee, Y. J. and Bassett, R. H. (2006b): Application of a photogrammetry technique to a model tunnel, Tunnelling and Underground Space Technology, Vol. 21, pp. 79-95.