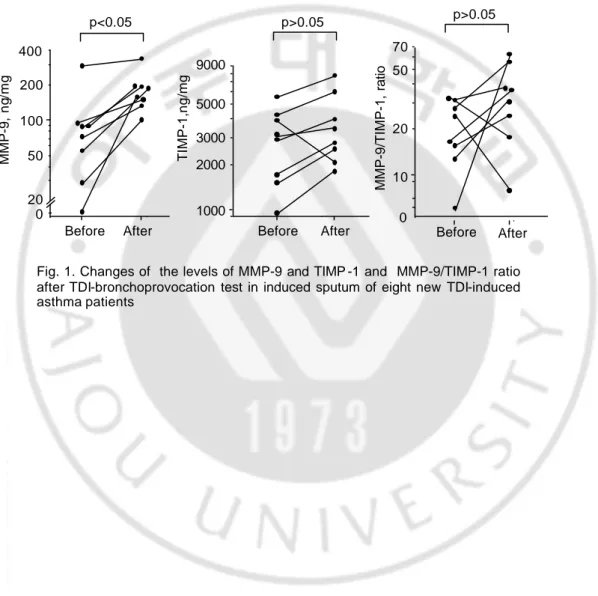
Fig. 1. Changes of the levels of MMP-9 and TIMP -1 and MMP-9/TIMP-1 ratio after TDI-bronchoprovocation test in induced sputum of eight new TDI-induced asthma patients After 100 MMP -9, ng /mg 400 p>0.05 200
Before After Before After Before
20 0 1000 9000 10 70 0 p<0.05 p>0.05 TIMP -1,ng/mg MMP -9/TIMP -1, ratio 50 2000 3000 5000 20 50
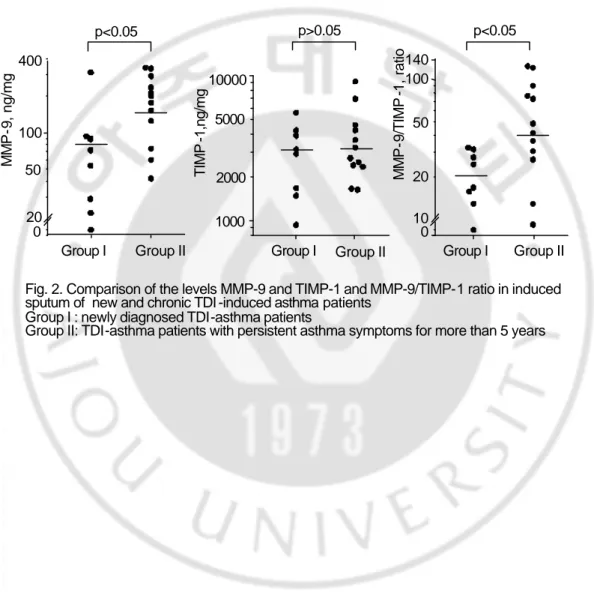
Fig. 2. Comparison of the levels MMP-9 and TIMP-1 and MMP-9/TIMP-1 ratio in induced sputum of new and chronic TDI -induced asthma patients
Group I : newly diagnosed TDI-asthma patients
Group II: TDI-asthma patients with persistent asthma symptoms for more than 5 years Group I Group II 100 MMP -9, ng /mg 20 400 0 1000 10000 TIMP -1,ng/mg Group I 10 100 MMP -9/TIMP -1, ratio Group I Group II 140 0 p<0.05 p>0.05 p<0.05 50 2000 5000 20 50 Group II
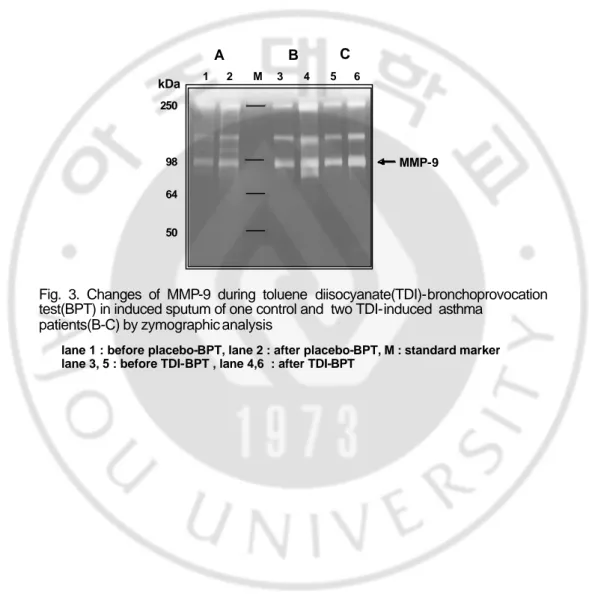
1 2 M 3 4 5 6 250 98 64 50 kDa MMP-9 A B C
Fig. 3. Changes of MMP-9 during toluene diisocyanate(TDI)-bronchoprovocation test(BPT) in induced sputum of one control and two TDI-induced asthma
patients(B-C) by zymographic analysis
lane 1 : before placebo-BPT, lane 2 : after placebo-BPT, M : standard marker lane 3, 5 : before TDI-BPT , lane 4,6 : after TDI-BPT