Contents lists available atScienceDirect
NeuroImage: Clinical
journal homepage:www.elsevier.com/locate/ynicl
Resting-state fMRI reveals network disintegration during delirium
Simone J.T. van Montfort
a,⁎, Edwin van Dellen
b,c, Aletta M.R. van den Bosch
a,d, Willem M. Otte
e,f,
Maya J.L. Schutte
b, Soo-Hee Choi
g, Tae-Sub Chung
h, Sunghyon Kyeong
i, Arjen J.C. Slooter
a,
Jae-Jin Kim
i,⁎⁎aDepartment of Intensive Care Medicine, Brain Center Rudolf Magnus, University Medical Center Utrecht, Utrecht University, The Netherlands bDepartment of Psychiatry, Brain Center Rudolf Magnus, University Medical Center Utrecht, Utrecht University, the Netherlands
cMelbourne Neuropsychiatry Center, Department of Psychiatry, University of Melbourne, Australia dFaculty of Science, University of Amsterdam, the Netherlands
eBiomedical MR Imaging and Spectroscopy Group, Center for Image Sciences, University Medical Center Utrecht, Utrecht University, the Netherlands fDepartment of Pediatric Neurology, Brain Center Rudolf Magnus, University Medical Center Utrecht, Utrecht University, the Netherlands gDepartment of Psychiatry, Institute of Human Behavioral Medicine, Seoul National University College of Medicine, Seoul, Republic of Korea hDepartment of Radiology, Yonsei University Gangnam Severance Hospital, Seoul, Republic of Korea
iDepartment of Psychiatry, Institute of Behavioral Science in Medicine, Yonsei University College of Medicine, Seoul, Republic of Korea.
A R T I C L E I N F O Keywords: Delirium fMRI Resting-state Brain networks Functional connectivity Minimum spanning tree
A B S T R A C T
Delirium is characterized by inattention and other cognitive deficits, symptoms that have been associated with disturbed interactions between remote brain regions. Recent EEG studies confirm that disturbed global network topology may underlie the syndrome, but lack an anatomical basis. The aim of this study was to increase our understanding of the global organization of functional connectivity during delirium and to localize possible alterations. Resting-state fMRI data from 44 subjects were analyzed, and motion-free data were available in nine delirious patients, seven post delirium patients and thirteen non-delirious clinical controls. We focused on the functional network backbones using the minimum spanning tree, which allows unbiased network comparisons. During delirium a longer diameter (mean (M) = 0.30, standard deviation (SD) = 0.05, P = .024) and a lower leaf fraction (M = 0.32, SD = 0.03, P = .027) was found compared to the control group (M = 0.28, SD = 0.04 respectively M = 0.35, SD = 0.03), suggesting reduced functional network integration and efficiency. Delirium duration was strongly related to loss of network hierarchy (rho =−0.92, P = .001). Connectivity strength was decreased in the post delirium group (M = 0.16, SD = 0.01) compared to the delirium group (M = 0.17, SD = 0.03, P = .024) and the control group (M = 0.19, SD = 0.02, P = .001). Permutation tests revealed a decreased degree of the right posterior cingulate cortex during delirium and complex regional alterations after delirium. Thesefindings indicate that delirium reflects disintegration of functional interactions between remote brain areas and suggest long-term impact after the syndrome resolves.
1. Introduction
Delirium is a common and serious problem affecting > 15% of the hospitalized elderly patients (Marcantonio, 2017). This acute neu-ropsychiatric syndrome is a direct consequence of another medical condition, and is predominantly characterized by decreased attention and altered awareness with other cognitive disturbances (American Psychiatric Association, 2013). Delirium is related to poor outcomes such as prolonged length of hospital stay (Brooks, 2012;Pompei et al., 1994) and long-term cognitive impairment (Pandharipande et al.,
2013). Previous studies suggested neurotransmitter imbalances, an aberrant stress response, and persistent neuroinflammation as potential underlying mechanisms (Zaal et al., 2015), but the pathogenesis re-mains poorly understood.
As adequate cognitive functioning requires interaction or functional connectivity between remote brain regions (Bullmore & Sporns, 2009; Stam & van Straaten, 2012), a recent hypothesis stated that delirium is a disconnection syndrome (van Dellen et al., 2014;Numan et al., 2017) caused by breakdown of functional brain networks (Sanders, 2011). In previous electroencephalography (EEG) studies, we found that delirious
https://doi.org/10.1016/j.nicl.2018.06.024
Received 11 January 2018; Received in revised form 21 May 2018; Accepted 17 June 2018
⁎Correspondence to: S.J.T. van Montfort, Department of Intensive Care Medicine, University Medical Center Utrecht, HP F.06.149, Postbus 85500, 3508 GA Utrecht, the Netherlands. ⁎⁎Correspondence to: J.J. Kim, Department of Psychiatry, Institute of Behavioral Science in Medicine, Yonsei University Gangnam Severance Hospital, 211 Eonju-ro, Gangnam-gu,
Seoul, Republic of Korea.
E-mail addresses:s.j.t.vanmontfort-2@umcutrecht.nl(S.J.T. van Montfort),jaejkim@yonsei.ac.kr(J.-J. Kim).
Available online 19 June 2018
2213-1582/ © 2018 The Authors. Published by Elsevier Inc. This is an open access article under the CC BY-NC-ND license (http://creativecommons.org/licenses/BY-NC-ND/4.0/).
patients have a decrease of alpha band (8–13 Hz) global functional connectivity strength, and a more random, less integrated network or-ganization compared to control patients without delirium (van Dellen et al., 2014;Numan et al., 2017). This was based however on scalp EEG-registrations only, which has low spatial resolution.
Functional magnetic resonance imaging (fMRI)– which maps the entire brain rather than only the surface – could potentially provide important additional information on the anatomical basis of these al-tered network organization. However, due to the symptomatology of delirium it is very challenging to acquire fMRI scans from delirious patients. Nonetheless, one fMRI study comparing delirious, post delir-ious and comparison subjects has been performed, showing abnormal interactions between brain areas involved in attention and awareness in delirious patients.(Choi et al., 2012). Activity of the dorsolateral pre-frontal cortex and the posterior cingulate cortex was positively corre-lated in delirium patients, whereas a negative correlation was found in comparison participants. Yet this study was focusing on a limited set of a priori defined brain regions.
Since recentfindings suggest that delirium may be an expression of a disrupted global network organization, it would be relevant to extend these finding into a more globally oriented study on network organi-zation. Recent findings strongly suggest that delirium and related cognitive alterations are associated with global network modifications rather than specific regional changes (van Dellen et al., 2014;Numan et al., 2017;Stam, 2014;van Dellen et al., 2015). To understand the nature of delirium it is therefore crucial to also map the global network changes.
Traditional graph analysis has however methodological challenges, including a significant bias in most group comparisons (Fornito et al., 2013; Stam et al., 2014; van Wijk et al., 2010). A robust network backbone is captured by the minimum spanning tree (MST). MST analysis has recently been shown to capture clinically relevant network changes in challenging acquisition conditions (Stam et al., 2014; Tewarie et al., 2015). MSTs connect all nodes with the highest possible weights without forming loops. Therefore, the MST always consists of a fixed number of connections, which avoids the methodological bias of spurious connections or arbitrary thresholding in group comparisons of network topology.
The aim of this study was to increase our understanding of the global organization of functional connectivity after transition to and recovery from delirium, and relate possible alterations to anatomical regions. Secondly, we aimed to explore how network alterations relate to delirium severity measures. We hypothesized that the functional brain network during delirium is less efficient and disintegrated net-work that partly restores after recovery from delirium.
2. Methods
2.1. Patient population and clinical assessment
The study protocol was approved by the Institutional Review Board of Yonsei University and informed consent was signed, either given by the participant or a caretaker (Choi et al., 2012).
Twenty two delirious patients were recruited from the Gangnam Severance Hospital at Yonsei University in Seoul, Korea. Delirium was screened daily and diagnosed according to DSM-IV criteria for delirium by trained psychiatrists using the Memorial Delirium Assessment Scale and the Delirium Rating Scale-Revised-98 (DRS-R-98) (Breitbart et al., 1997; Trzepacz et al., 2001). Scans obtained from delirium patients included an anatomical T1-weighted scan and a resting-state BOLD fMRI scan. The day after recovery from delirium (i.e. a score of < 10 on the Memorial Delirium Assessment Scale or a score of < 15 on the DRS-R-98), a follow-up scan was made of thirteen of these patients using the same scan protocol. The total number of days a patient was diagnosed as delirious was used as a score for delirium duration. The DRS-R-98 score on the day of MRI scanning was used as a measure of severity of
delirium. Only low-dose antipsychotics were administered in the de-lirium and post dede-lirium groups, the dose of antipsychotics was similar in both conditions. The causes of delirium in our sample were multi-factorial and mostly included systemic or metabolic disease.
A control group of 22 non-delirious clinical controls, matched on age, sex and extent of leukoaraiosis, was recruited from the Databank for Brain Imaging at Gangnam Severance Hospital. The data bank in-cluded functional and structural brain MR images of inpatients or outpatients who had various medical or neurological conditions, who were scanned with the same MR sequences as the patients with delirium and who consented to provide the data.
Exclusion criteria for all groups were a history of cognitive decline such as dementia, a history of seizure or traumatic brain injury, or previously identified focal lesions larger than 3 cm. Since motion ar-tifacts can influence the fMRI data and cause spurious results (Power et al., 2015; Pruim et al., 2015a; Satterthwaite et al., 2013), a strict motion correction was performed (see additional motion correction paragraph below). After motion correction, our sample consisted of nine delirium patients, of whom seven patients were scanned post de-lirium and thirteen controls.
2.2. Image acquisition
High-resolution anatomical images were obtained using a spoiled gradient-echo sequence (matrix = 512 × 512, echo time (TE) = 1.7 msec, repetition time (TR) = 7.0 msec, field of view = 210 mm, slice thickness = 1.2 mm,flip angle = 20°, number of slices = 240) to serve as an anatomical reference. Functional images were obtained over 400 s using gradient-echo echo-planar imaging se-quences in a Signa EXCITE 3-T MR system (GE, Milwaukee; ma-trix = 64 × 64, TE = 17.6 msec, TR = 2500 msec, field of view = 240 mm, slice thickness = 3 mm, flip angle = 90°, number of slices = 50). All participants were instructed to rest with their eyes closed during each scan.
2.3. Preprocessing
Image preprocessing was performed using the FMRIB's Software Library (FSL) (Jenkinson et al., 2012;Smith et al., 2004;Woolrich et al., 2009). The brain was automatically extracted from the T1-weighted scan (Smith, 2002). Time series were motion corrected with MCFLIRT. (Jenkinson et al., 2002;Jenkinson & Smith, 2001). This removes sub-ject's head movement and allows calculation of the mean relative dis-placement. Participants with a mean relative displacement larger than 0.2 mm were excluded (Power et al., 2012). Six motion components were extracted, i.e. three voxel-wise displacement parameters and the temporal signal intensities obtained from white matter, cerebrospinal fluid, and global time courses (Satterthwaite et al., 2013). The func-tional scan was registered to the high-resolution anatomical image by using rigid registration. The anatomical scan was subsequently matched with the Montreal Neurological Institute (MNI) 152 T1-weighted 2 mm image in standard space with affine registration. Functional scans were slice-time corrected, spatial smoothed to reduce noise (5 mm full-width-half-maximum). Thefirst 15 volumes were deleted to ensure stabilized magnetization. Average time series from the cerebral spinalfluid, the white matter and grey matter intensities were determined after tissue segmentation Tool (FAST) (Zhang et al., 2001).
2.4. Additional motion correction
It has been recognized that motion can have large impact on the resting-state fMRI signal and can induce systematically bias inference (Power et al., 2015; Satterthwaite et al., 2013; Power et al., 2012; Pruim et al., 2015b;Ciric et al., 2017). The standard FSL pipeline is not sufficient to remove motion artifacts from the data, therefore additional motion correction is necessary (Power et al., 2015;Satterthwaite et al.,
2013;Power et al., 2012;Pruim et al., 2015b;Ciric et al., 2017). Out of two additional motion correction methods, i.e. independent component analysis-based strategy for Automatic Removal of Motion Artifacts (ICA-AROMA) (Pruim et al., 2015a;Pruim et al., 2015b) and spike re-gression (Satterthwaite et al., 2013;Power et al., 2012), we selected the most effective one in controlling motion effects in our dataset for final correction, i.e. spike regression (see Supplementary Fig. 1). Volumes that exceeded the threshold of 0.2 mm framewise displacement (Power et al., 2014) were removed and a regression analysis with 24 motion components was done. Motion components were: three voxel-wise displacement parameters and their white matter, cerebrospinal fluid, global time courses, the quadrates, temporal derivatives and quadrates of the derivatives of these six parameters (Yan et al., 2013). A band-pass filter (0.01–0.08 Hz) was applied (Satterthwaite et al., 2013). If the remaining data was < 300 s, the subject was excluded from further analysis (Birn et al., 2013).
2.5. Global network analysis
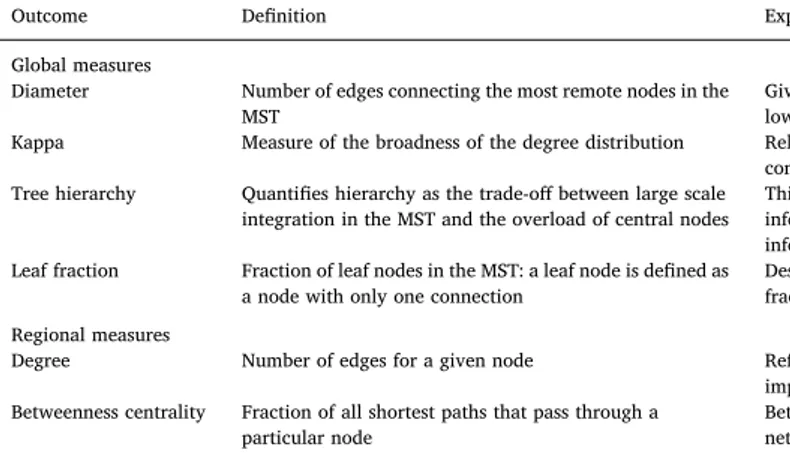
We selected 90 regions from the AAL brain atlas (V4) that cover the cortical and subcortical regions (Tzourio-Mazoyer et al., 2002). To es-timate 90 regional mean time series, voxel time series within each AAL region were averaged. A correlation network was constructed for every participant, based on those time series using Pearson's correlation. Only positive correlations were taken into account as a result of the MST analysis, thus avoiding the problematic interpretation of negative BOLD correlations (Stam et al., 2014;Tewarie et al., 2015). Mean connectivity strength of the network was calculated per subject. MST network backbones were extracted with Kruskal's algorithm (Kruskal Jr., 1956) (MATLAB, version R2016b). For each MST the diameter, kappa, tree hierarchy and leaf fraction were calculated (see Table 1for the de fi-nitions and explanation (Tewarie et al., 2015)). SeeFig. 1 for an ex-planation on MST structure.
2.6. Regional network analysis
To localize possible alterations in network organization to anato-mical regions, regional network characteristics were analyzed. Since global network characteristics were analyzed based on the MST, we also focused on MST characteristics for regional analysis, i.e. MST degree and MST betweenness centrality were used (Tewarie et al., 2015) (Table 1).
2.7. Statistical analyses
The mean connectivity strength and the MST outcomes leaf fraction, diameter, kappa and tree hierarchy were compared between i) delirium
and controls, ii) post delirium and controls, and iii) delirium and post delirium. For these analyses a bootstrapped linear mixed models with 'group' (i.e. delirium, post delirium, control) as independent variable and‘subject’ as random variable were used. This approach was cor-rected for within-subject correlation allowing calculation of robust 95% confidence intervals of group differences. Modeling was done within the R statistical software (version 3) with the lmeresampler package. A False Discovery Rate correction was used to control for multiple com-parisons. As exploratory analysis, spearman's correlation analyses were conducted to evaluate the association between the five global MST network outcomes (of the delirium group) and the duration or severity of delirium. These exploratory analyses were not corrected for multiple comparisons.
Regional MST characteristics were tested between groups (P < .05), by using permutation tests in Matlab (Monte Carlo 2-sided test, 1000 permutations), corrected for multiple comparisons (Groppe et al., 2011). Nodal degree and nodal betweenness centrality of all 90 regions were tested for group differences between i) delirium and controls, ii) post delirium and controls, and iii) delirium and post de-lirium.
3. Results 3.1. Demographics
Table 2shows the demographic and clinical data of the delirium, post delirium and control group. The delirium and control group were comparable on age, sex and extent of leukoaraiosis. The average duration of an episode of delirium was 9.00 days (standard deviation (SD) 2.73). After spike regression, no differences were found in motion, i.e. mean frame-wise displacement, between the three groups (F = 1.35, P = .60). No correlation was found between our network outcome measures and motion, i.e. mean relative displacement (see Supplementary Fig. 2).
3.2. Global network organization
Fig. 2shows boxplots of the overall connectivity strength and MST outcomes diameter, kappa, leaf and tree hierarchy for the delirium, post delirium and control group. Mean network outcomes are displayed in Supplementary Table 1. Connectivity strength was significantly de-creased in the post delirium group (M: 0.16, SD: 0.01) compared to the control group (M: 0.19, SD: 0.02) with a difference of −0.04 (95% CI -0.05– -0.02, corrected P = .001) and compared to the delirium group (M: 0.17, SD: 0.03) with a difference of −0.02 (95% CI -0.02–0.00, corrected P = .027). Diameter was significantly increased during de-lirium (M: 0.30, SD: 0.05) compared to the control group (M: 0.28, SD: Table 1
Definition and explanation of the MST outcomes.
Outcome Definition Explanation
Global measures
Diameter Number of edges connecting the most remote nodes in the MST
Gives an indication of the efficiency of global network organization. In a network with a low diameter, information is efficiently processed between remote brain regions. Kappa Measure of the broadness of the degree distribution Related to resilience against attacks, epidemic spreading and the synchronizability of
complex networks. Tree hierarchy Quantifies hierarchy as the trade-off between large scale
integration in the MST and the overload of central nodes
This measure was defined to the hypothesized optimal topology of the brain, where information is transferred between nodes in the fewest possible steps, while preventing information overload of central nodes.
Leaf fraction Fraction of leaf nodes in the MST: a leaf node is defined as a node with only one connection
Describes to what extend the network has a central, integrated organization. A high leaf fraction indicates that the network is largely dependent on central nodes.
Regional measures
Degree Number of edges for a given node Reflects the importance of a node in the network. A node with a high degree is a more important node in the network.
Betweenness centrality Fraction of all shortest paths that pass through a particular node
Betweenness centrality ranges between 0 (leaf node) and 1 (central node in a star-like network).
0.04) with a difference of 0.04 (95% CI -0.01–0.08, corrected P = .024). Leaf fraction was significantly decreased during delirium (M: 0.32, SD: 0.03) compared to the control group (M: 0.35, SD: 0.03), with a difference of −0.02 (95% CI -0.04–0.02, corrected P = .027).
In order to increase the comparability with previous studies, we additionally calculated classical graph measures, i.e. clustering coeffi-cient, density and path length from the weighted connectivity matrix (for definitions see Supplementary Table 2). This resulted in similar results as our MST findings, however these analyses additionally showed decreased clustering, decreased density and increased path length in the post delirium group (Supplementary Fig. 3).
We found significant negative correlations between delirium dura-tion and leaf fracdura-tion (rho =−0.73, P = .039), and between delirium duration and tree hierarchy (rho =−0.92, P = .001) (Fig. 2). No sig-nificant correlations were found between delirium severity and the global MST network measures.
3.3. Regional network organization
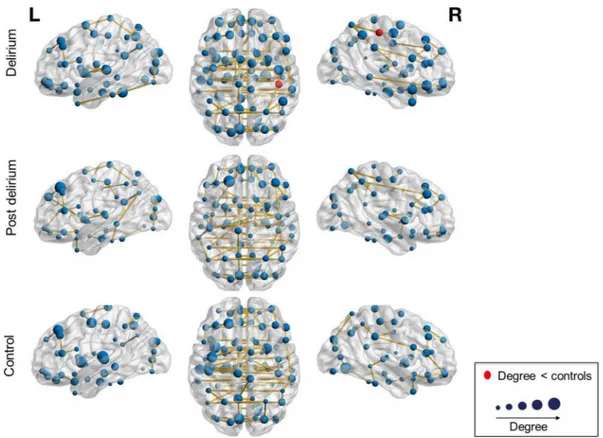
We performed permutation analyses to test for possible alterations of the nodal characteristics degree and betweenness centrality. We found that the degree of the right posterior cingulate cortex was lower in the delirium group compared to the control group (corrected P = .039) (Fig. 3).
Several differences in regional betweenness centrality were found between groups (Supplementary Fig. 5). Betweenness centrality of the right inferior temporal gyrus was lower in the delirium group compared to the control group (corrected P = .004). Betweenness centrality of the left anterior cingulum and the right pallidum were lower in the post delirium group compared to the control group (both corrected P = .016). Betweenness centrality of the orbital part of the right middle frontal gyrus, the right medial orbitofrontal cortex and the left anterior cingulate were lower in the delirium group compared to the post
delirium group (corrected P = .030, corrected P = .016, corrected P = .031, resp.).
4. Discussion
This study shows a less efficient, disintegrated network during de-lirium, which was in accordance with our hypothesis. More profound network disintegration was strongly associated with longer duration of delirium, suggesting that this mechanism is pivotal in the pathophy-siology of the syndrome. Connectivity strength was declined after re-covery of delirium. In addition, several differences between regional network characteristics were found after delirium was resolved, in-cluding a lower degree of the right posterior cingulate cortex and a lower centrality of the right inferior temporal gyrus during delirium and complex regional alterations after delirium. Taken together, these findings suggest long-term impact of delirium on functional con-nectivity and brain network organization after remission of the syn-drome.
Ourfindings of decreased network integration during delirium are in line with previous EEG graph theoretical studies (van Dellen et al., 2014;Numan et al., 2017). The loss of network integration and e ffi-ciency may reflect the underlying neural mechanism for the cognitive dysfunction during the syndrome. Interestingly, the transition to a more path-like network during delirium is similar tofindings in MST studies on dementia (van Dellen et al., 2015;Yu et al., 2016). Previous EEG studies additionally suggested a change in connectivity strength during delirium (van Dellen et al., 2014;Numan et al., 2017). In the present study we found a similar trend, but this did not reach statistical sig-nificance. This may be explained by our small sample size. Another possibility may be that fMRI is less sensitive than EEG in picking up functional connectivity strength alterations during delirium. Never-theless, we didfind a difference in connectivity strength between the post delirium group and the control group, and between the post de-lirium and the dede-lirium group. Dede-lirium is associated with long-term cognitive decline (Pandharipande et al., 2013; Inouye et al., 2016; Wolters et al., 2017), while decreased functional connectivity was re-lated to cognitive impairment in previous work (van Dellen et al., 2015; Yu et al., 2016). We speculate that an irreversible decrease of con-nectivity strength due to delirium may be an underlying pathophysio-logical mechanism of this association between delirium and cognitive decline.
Although classical graph analyses showed persisting organizational changes after delirium was resolved, MST network analyses did not. The difference might be due to the strong dependency of classical graph measures on connectivity strength, which makes the interpretation of the classical graph measures difficult (van Wijk et al., 2010). As si-mulation studies suggest that the MST overcomes this bias (Tewarie et al., 2015), we will focus on the MSTfindings in the evaluation of network alteration after delirium. Interestingly, we found a large var-iation in post delirium patients in MST outcomes that were affected during delirium. This may be due to the smaller size of the group, but could also indicate heterogeneity. Considering that delirium is Fig. 1. Schematic representation of a line-like, hier-archically tree structure and star-like network. Each network type has 7 nodes and 6 edges. Leaf nodes, the blue nodes in thefigure, are nodes that only have one edge and the diameter is the length of the path between the two nodes that are furthest apart. The orange nodes in thefigure have a high betweenness centrality. (A) Line-like network: few leaf nodes + long diameter, (B) hierarchical tree structure, (C) star-like network: many leaf nodes + short dia-meter + a central node with a high betweenness centrality.
Table 2
Demographic and clinical characteristics of delirium patients, the post delirium patients and comparison subjects.
Delirium (N = 9) Post delirium (N = 7) Control (N = 13) P-valuea Age (years) 75.56 (6.88) 75.43 (8.00) 72.69 (6.65) 0.34 Gender (male) 55.6% (N = 4) 85.7% (N = 6) 46.2% (N = 6) 0.68 PVH (range 0–6) 2.44 (1.33) 2.14 (1.22) 1.46 (1.39) 0.11 DWMH (range 0–24) 7.44 (6.32) 4.71 (5.90) 7.85 (5.47) 0.88 Focal lesions (part of group) 55.6% (N = 4) 28.6% (N = 2) 30.8% (N = 4) 0.54 MDAS score 15.44 (3.61) 5.00 (2.83) – – Mean (SD) is shown.
a Statistical difference between delirium and control group. Abbreviations: PVH = periventricular hyperintensities, DWMH = deep white matter hyper-intensities, MDAS = Memorial Delirium Assessment Scale.
associated with long-term cognitive impairment (Pandharipande et al., 2013;Inouye et al., 2016;Wolters et al., 2017), it could be that the sub-group of delirious patients who will develop this long-term problems shows remaining alterations in global brain organization, while the patients without lasting problems will recover from global brain orga-nization disturbances. In line with this hypothesis, we observed that network integration was negatively associated with delirium duration. The post delirium patients also showed regional network alterations compared to the control group, which may reflect (more localized) long-term network impairments.
This fMRI study showed a lower nodal MST degree, i.e. number of connections, in the right posterior cingulate cortex during delirium. The posterior cingulate cortex is an important structure in the default mode network and previous studies have shown impaired activity in this re-gion in patient groups with disorders of cognition, attention or con-sciousness (Leech & Sharp, 2014). A previous fMRI study on network alteration during delirium in a priori chosen brain regions, showed an abnormal interaction between the posterior cingulate cortex and the dorsolateral prefrontal cortex, i.e. regions involved in attention and cognition, which resolved after delirium. The lower degree in the right
posterior cingulate cortex might reflect loss of hub function of this re-gion, related to a development of long-term cognitive impairment.
We observed that betweenness centrality of post delirium patients was lower in a part of the default mode network, i.e. the middle pre-frontal cortex, and in regions involved in emotional and cognitive processes, i.e. the orbitofrontal cortex, anterior cingulate and globus pallidus. These regions are not known in the literature as hub regions (van den Heuvel & Sporns, 2013). We would therefore not expect a high betweenness centrality, which makes it difficult to interpret what the importance of a lower betweenness centrality in the post delirium group is. The complex regional alterations might reflect a process of neural plasticity in order to recover from delirium, or might be an in-dication of lasting impairment related to the vulnerability for negative outcomes after delirium.
Strengths of our study were the strict methodology, using groups matched on age, sex and the extent of leukoaraiosis, strict motion correction and bias limiting MST network comparisons. Furthermore, we had access to a unique dataset of fMRI scans during delirium, which is very challenging to perform.
This study also has several limitations. It is difficult to instruct Fig. 2. Overview of global network results comparing the delirium group, post delirium group and control group. (A) Boxplots of overall connectivity strength and minimum spanning tree outcomes diameter, kappa, leaf and tree hierarchy for the control, delirium and post delirium group. A significant difference was found in connectivity strength between the control and the post delirium group and between the delirium and the post delirium group. A significant difference was found in diameter and leaf fraction between the delirium and the control group. (B)* A significant negative correlation was found between delirium duration and tree hierarchy. (C)* A significant negative correlation was found between delirium duration and leaf fraction. Abbreviations: M = mean, SD = standard deviation, leaf = leaf fraction, th = tree hierarchy, C = control group, D = delirium group, PD = post delirium group. *Note that data on these variables is only shown for subjects included in the delirium group.
delirious, sometimes restless, patients, to undergo resting-state fMRI measurements. Therefore, the reliability of the‘resting-state’ may not be assured in this study. Due to the limited scanning time and the need for strict motion correction for global brain network analysis, a con-siderable part of our study population had to be excluded. It can be hypothesized that the most restless patients that needed to be excluded were the patients with most severe delirium. This would have resulted in an underestimation of the true effect. Samples and preprocessing steps may differ from the previous study on this dataset (Choi et al., 2012), due to recent improvements in processing of resting-state fMRI data for connectivity analysis. Another limitation might be that anti-psychotic medication could have influenced our results (Roder et al., 2010). It should however be noted that the use of antipsychotics was equally distributed between the delirium and post delirium scans and that only low-dose antipsychotics were administered in both scan conditions. Future research should focus on global and regional net-work studies during delirium, with larger sample sizes and follow-up measurements to evaluate the long-term cognitive effects of network changes due to delirium.
5. Conclusion
This fMRI study revealed a disintegrated, less efficient resting-state network during delirium, which correlates with the duration of the disorder, and loss of hub function of the right posterior cingulate cortex. Connectivity strength was declined after delirium was resolved. Additional complex regional alterations were shown after delirium, indicating a process of persistent vulnerability or ongoing recovery. Thesefindings provide further evidence that delirium reflects a disin-tegration of functional interactions between remote brain areas and indicate long-term impact after remission of the syndrome.
Conflict of interest
The authors declare no conflict of interest. Acknowledgements
This work was supported by a grant from the Korea Health Technology R&D Project through the Korea Health Industry Development Institute (KHIDI), funded by the Ministry of Health & Welfare, Republic of Korea (grant number: HI16C0132).
Appendix A. Supplementary data
Supplementary data to this article can be found online athttps:// doi.org/10.1016/j.nicl.2018.06.024.
References
American Psychiatric Association, 2013. Diagnostic and Statistical Manual of Mental Disorders. American Psychiatric Associationhttp://dx.doi.org/10.1176/appi.books. 9780890425596.
Birn, R.M., Molloy, E.K., Patriat, R., Parker, T., Meier, T.B., Kirk, G.R., Nair, V.A., Meyerand, M.E., Prabhakaran, V., 2013. The effect of scan length on the reliability of resting-state fMRI connectivity estimates. NeuroImage 83, 550–558.http://dx.doi. org/10.1016/j.neuroimage.2013.05.099.
Breitbart, W., Rosenfeld, B., Roth, A., Smith, M.J., Cohen, K., Passik, S., 1997. The memorial delirium assessment scale. J. Pain Symptom Manag. 13 (3), 128–137.
http://dx.doi.org/10.1016/S0885-3924(96)00316-8.
Brooks, P.B., 2012. Postoperative delirium in elderly patients. AJN, Am J Nurs. 112 (9), 38–49.http://dx.doi.org/10.1097/01.NAJ.0000418922.53224.36.
Bullmore, E., Sporns, O., 2009. Complex brain networks: graph theoretical analysis of structural and functional systems. Nat Rev Neurosci Nat Rev Neurosci. 10 (3), 186–198.http://dx.doi.org/10.1038/nrn2575.
Choi, S.H., Lee, H., Chung, T.S., et al., 2012. Neural network functional connectivity during and after an episode of delirium. Am. J. Psychiatry 169 (5), 498–507.http:// dx.doi.org/10.1176/appi.ajp.2012.11060976.
Ciric, R., Wolf, D.H., Power, J.D., et al., 2017. Benchmarking of participant-level con-found regression strategies for the control of motion artifact in studies of functional
Fig. 3. Visualization of the mean degree in the minimum spanning tree network of the delirium, post delirium and the control group. The anatomical labeling atlas with 90 regions was used. The size of the nodes corresponds to the degree. Red nodes mark regions with a significant group difference in degree. The degree of the right posterior cingulate was significantly lower in the delirium group compared to the control group.
connectivity. NeuroImage 154, 174–187.http://dx.doi.org/10.1016/j.neuroimage. 2017.03.020.
Fornito, A., Zalesky, A., Breakspear, M., 2013. Graph analysis of the human connectome: promise, progress, and pitfalls. NeuroImage 80, 426–444.http://dx.doi.org/10. 1016/j.neuroimage.2013.04.087.
Groppe, D.M., Urbach, T.P., Kutas, M., 2011. Mass univariate analysis of event-related brain potentials/fields I: a critical tutorial review. Psychophysiology 48 (12), 1711–1725.http://dx.doi.org/10.1111/j.1469-8986.2011.01273.x.
Inouye, S.K., Marcantonio, E.R., Kosar, C.M., et al., 2016. The short-term and long-term relationship between delirium and cognitive trajectory in older surgical patients. Alzheimers Dement. 12 (7), 766–775.http://dx.doi.org/10.1016/j.jalz.2016.03.005. Jenkinson, M., Smith, S., 2001. A global optimisation method for robust affine registra-tion of brain images. Med. Image Anal. 5 (2), 143–156.http://dx.doi.org/10.1016/ S1361-8415(01)00036-6.
Jenkinson, M., Bannister, P., Brady, M., Smith, S., 2002. Improved optimization for the robust and accurate linear registration and motion correction of brain images. NeuroImage 17 (2), 825–841.http://dx.doi.org/10.1006/nimg.2002.1132. Jenkinson, M., Beckmann, C.F., Behrens, T.E.J., Woolrich, M.W., Smith, S.M., 2012. FSL.
Neuroimage. 62 (2), 782–790.http://dx.doi.org/10.1016/j.neuroimage.2011.09. 015.
Kruskal Jr., J.B., 1956. On the shortest spanning subtree of a graph and the traveling salesman problem. Proc. Am. Math. Soc. 7 (1), 48.http://dx.doi.org/10.2307/ 2033241.
Leech, R., Sharp, D.J., 2014. The role of the posterior cingulate cortex in cognition and disease. Brain 137 (1), 12–32.http://dx.doi.org/10.1093/brain/awt162. Marcantonio, E.R., 2017. Delirium in hospitalized older adults. Solomon CG, ed. N. Engl.
J. Med. 377 (15), 1456–1466.http://dx.doi.org/10.1056/NEJMcp1605501. Numan, T., Slooter, A.J.C., van der Kooi, A.W., et al., 2017. Functional connectivity and
network analysis during hypoactive delirium and recovery from anesthesia. Clin. Neurophysiol. 128 (6), 914–924.http://dx.doi.org/10.1016/j.clinph.2017.02.022. Pandharipande, P.P., Girard, T.D., Jackson, J.C., et al., 2013. Long-term cognitive im-pairment after critical illness. N. Engl. J. Med. 369 (14), 1306–1316.http://dx.doi. org/10.1056/NEJMoa1301372.
Pompei, P., Foreman, M., Rudberg, M.A., Inouye, S.K., Braund, V., Cassel, C.K., 1994. Delirium in hospitalized older persons: outcomes and predictors. J. Am. Geriatr. Soc. 42 (8), 809–815.http://dx.doi.org/10.1111/j.1532-5415.1994.tb06551.x. Power, J.D., Barnes, K.A., Snyder, A.Z., Schlaggar, B.L., Petersen, S.E., 2012. Spurious but
systematic correlations in functional connectivity MRI networks arise from subject motion. NeuroImage 59 (3), 2142–2154.http://dx.doi.org/10.1016/j.neuroimage. 2011.10.018.
Power, J.D., Mitra, A., Laumann TO, Snyder, A.Z., Schlaggar, B.L., Petersen, S.E., 2014. Methods to detect, characterize, and remove motion artifact in resting state fMRI. NeuroImage 84, 320–341.http://dx.doi.org/10.1016/j.neuroimage.2013.08.048. Power, J.D., Schlaggar, B.L., Petersen, S.E., 2015. Recent progress and outstanding issued
in motion correction resting state fmri. NeuroImage 105, 536–551.http://dx.doi.org/ 10.1016/j.neuroimage.2014.10.044.
Pruim, R.H.R., Mennes, M., van Rooij, D., Llera, A., Buitelaar, J.K., Beckmann, C.F., 2015a. ICA-AROMA: a robust ICA-based strategy for removing motion artifacts from fMRI data. NeuroImage 112, 267–277.http://dx.doi.org/10.1016/j.neuroimage. 2015.02.064.
Pruim, R.H.R., Mennes, M., Buitelaar, J.K., Beckmann, C.F., 2015b. Evaluation of ICA-AROMA and alternative strategies for motion artifact removal in resting state fMRI. NeuroImage 112, 278–287.http://dx.doi.org/10.1016/j.neuroimage.2015.02.063. Roder, H.C., Marie Hoogendam, J.M., van der Veen, F., 2010. FMRI, antipsychotics and
schizophrenia. Influence of different antipsychotics on BOLD-signal. Curr. Pharm. Des. 16 (18), 2012–2025.http://dx.doi.org/10.2174/138161210791293088. Sanders, R.D., 2011. Hypothesis for the pathophysiology of delirium: role of baseline
brain network connectivity and changes in inhibitory tone. Med. Hypotheses 77 (1), 140–143.http://dx.doi.org/10.1016/j.mehy.2011.03.048.
Satterthwaite, T.D., Elliott, M.A., Gerraty, R.T., et al., 2013. An improved framework for
confound regression andfiltering for control of motion artifact in the preprocessing of resting-state functional connectivity data. NeuroImage 64, 240–256.http://dx.doi. org/10.1016/j.neuroimage.2012.08.052.
Smith, S.M., 2002. Fast robust automated brain extraction. Hum. Brain Mapp. 17 (3), 143–155.http://dx.doi.org/10.1002/hbm.10062.
Smith, S.M., Jenkinson, M., Woolrich, M.W., et al., 2004. Advances in functional and structural MR image analysis and implementation as FSL. NeuroImage 23, S208–S219.http://dx.doi.org/10.1016/j.neuroimage.2004.07.051.
Stam, C.J., 2014. Modern network science of neurological disorders. Nat. Rev. Neurosci. 15 (10), 683–695.http://dx.doi.org/10.1038/nrn3801.
Stam, C.J., van Straaten, E.C.W., 2012. The organization of physiological brain networks. Clin. Neurophysiol. 123 (6), 1067–1087.http://dx.doi.org/10.1016/j.clinph.2012. 01.011.
Stam, C.J., Tewarie, P., Van Dellen, E., van Straaten, E.C.W., Hillebrand, A., Van Mieghem, P., 2014. The trees and the forest: characterization of complex brain net-works with minimum spanning trees. Int. J. Psychophysiol. 92 (3), 129–138.http:// dx.doi.org/10.1016/j.ijpsycho.2014.04.001.
Tewarie, P., van Dellen, E., Hillebrand, A., Stam, C.J., 2015. The minimum spanning tree: an unbiased method for brain network analysis. NeuroImage 104, 177–188.http:// dx.doi.org/10.1016/j.neuroimage.2014.10.015.
Trzepacz, P.T., Mittal, D., Torres, R., Kanary, K., Norton, J., Jimerson, N., 2001. Validation of the delirium rating scale-Revised-98. J Neuropsychiatry Clin Neurosci. 13 (2), 229–242.http://dx.doi.org/10.1176/jnp.13.2.229.
Tzourio-Mazoyer, N., Landeau, B., Papathanassiou, D., et al., 2002. Automated anato-mical labeling of activations in SPM using a macroscopic anatoanato-mical Parcellation of the MNI MRI single-subject brain. NeuroImage 15 (1), 273–289.http://dx.doi.org/ 10.1006/nimg.2001.0978.
van Dellen, E., van der Kooi, A.W., Numan, T., et al., 2014. Decreased functional con-nectivity and disturbed directionality of informationflow in the electro-encephalography of intensive care unit patients with delirium after cardiac surgery. Anesthesiology 121 (2), 328–335.http://dx.doi.org/10.1097/ALN.
0000000000000329.
van Dellen, E., de Waal, H., van der Flier, W.M., et al., 2015. Loss of EEG network effi-ciency is related to cognitive impairment in dementia with Lewy bodies. Mov. Disord. 30 (13), 1785–1793.http://dx.doi.org/10.1002/mds.26309.
van den Heuvel, M., Sporns, O., 2013. Network hubs in the human brain. Trends Cogn. Sci. 17 (12), 683–696.http://dx.doi.org/10.1016/j.tics.2013.09.012.
van Wijk, B.C.M., Stam, C.J., Daffertshofer, A., Stam, C., Apkarian, A., 2010. Comparing brain networks of different size and connectivity density using graph theory. Sporns O, ed.. PLoS One 5 (10), e13701.http://dx.doi.org/10.1371/journal.pone.0013701. Wolters, A.E., Peelen, L.M., Veldhuijzen, D.S., et al., 2017. Long-term self-reported cog-nitive problems after delirium in the intensive care unit and the effect of systemic inflammation. J. Am. Geriatr. Soc. 65 (4), 786–791.http://dx.doi.org/10.1111/jgs. 14660.
Woolrich, M.W., Jbabdi, S., Patenaude, B., et al., 2009. Bayesian analysis of neuroimaging data in FSL. NeuroImage 45 (1), S173–S186.http://dx.doi.org/10.1016/j. neuroimage.2008.10.055.
Yan, C.-G., Cheung, B., Kelly, C., et al., 2013. A comprehensive assessment of regional variation in the impact of head micromovements on functional connectomics. NeuroImage 76, 183–201.http://dx.doi.org/10.1016/j.neuroimage.2013.03.004. Yu, M., Gouw, A.A., Hillebrand, A., et al., 2016. Different functional connectivity and
network topology in behavioral variant of frontotemporal dementia and Alzheimer's disease: an EEG study. Neurobiol. Aging 42, 150–162.http://dx.doi.org/10.1016/j. neurobiolaging.2016.03.018.
Zaal, I.J., Devlin, J.W., Peelen, L.M., Slooter, A.J.C., 2015. A systematic review of risk factors for delirium in the ICU*. Crit. Care Med. 43 (1), 40–47.http://dx.doi.org/10. 1097/CCM.0000000000000625.
Zhang, Y., Brady, M., Smith, S., 2001. Segmentation of brain MR images through a hidden Markov randomfield model and the expectation-maximization algorithm. IEEE Trans. Med. Imaging 20 (1), 45–57.http://dx.doi.org/10.1109/42.906424.