IOP Conference Series: Earth and Environmental Science
PAPER • OPEN ACCESS
An Analysis of the Carbon Fixation Change
according to the Greenbelt Deregulation Using
InVEST Model –In Case of Anyang and Gwacheon
City-To cite this article: JiYoung Choi and SangDon Lee 2018 IOP Conf. Ser.: Earth Environ. Sci. 167 012043
View the article online for updates and enhancements.
Related content
A study of atmospheric aerosol optical properties over Alexandria city- Egypt
E E Kohil, I H Saleh and Z F Ghatass
-Heavy metals characteristics of settled particles of streets dust from Diwaniyah City- Qadisiyah Governorate - Southern Iraq
Moutaz A. Al-Dabbas, Khalid H. Mahdi, Raad Al- Khafaji et al.
-Evaluation of the Fixation of Artificial Hip Joint by Acoustic Emission
Xiao-Jie Gao, Kagehisa Murota, Yoshitsugu Tomita et al.
1234567890 ‘’“”
8th International Conference on Environment Science and Engineering (ICESE 2018) IOP Publishing IOP Conf. Series: Earth and Environmental Science 167 (2018) 012043 doi :10.1088/1755-1315/167/1/012043
An Analysis of the Carbon Fixation Change according to the
Greenbelt Deregulation Using InVEST Model –In Case of
Anyang and Gwacheon City-
JiYoung Choi1 and SangDon Lee2
1 Ph, D Student in Department of Environmental Science and Engineering, Ewha Womans University, Seoul, South Korea.
2 Professor in Department of Environmental Science and Engineering, Ewha Womans University, Seoul, South Korea.
E-mail: jiyoungchoi1310@gmail.com
Abstract. The greenbelt regions in South Korea are now under the pressure of development as
the greenbelt around urban areas is deregulated. Due to the greenbelt deregulation, the environment formerly conserved in the greenbelt is being turned into bare ground, which is reserved for development, or has already been developed. Government deregulated 10% of the greenbelt in Gyeonggi Province in 2015 to solve the housing problems and secure industrial areas. In view of the environmental conservation and development policies, the impact of greenbelt deregulation was analyzed in the present study by comparing the amount of carbon fixation before and after the greenbelt deregulation by using the InVEST model. In Anyang city, the ratio of urbanization was significantly increased for ten years within the temporal scope of the present study and the carbon fixation was decreased by 48485.05 Mg of C. In Gwacheon city, the carbon fixation was decreased by 8492.17 Mg of C in the same period. The result of the present study may provide fundamental data for analyzing the economic value of the greenbelt that may be deregulated in the future and estimating the impact that land development policies may have on the environment and the society.
1. Introduction
South Korea's greenbelt was firstly designated in 1976 around Seoul in the regions between the radii of 15 and 25 km from the center of the city in the width of 10 km to secure green spaces and prevent the extension of urban areas. Later, the greenbelt was extended to the radius of 40 km from the center of Seoul to protect green spaces and drinking water sources[1]. However, because of the conflicts that continuously occurred in the greenbelt regions about the land use, 28.5% of the greenbelt throughout South Korea was deregulated in 2001 to resolve the civil complaints and increase housing reliability[2] In 2010, 107.42 km2 of the greenbelt was deregulated(table 1), and the largest portion of the deregulated greenbelt was in Gyeonggi Province (34.01%).
Deregulation of greenbelt causes not only expansion of urban areas but also reckless development due to excessive land use[3], [4], which may cause continuous reckless development in surrounding regions because of the conversion of the land use aimed at urbanization.
The purpose of the present study is to analyze the benefits of natural assets obtained from the presence of greenbelt in terms of carbon fixation with reference to the time of greenbelt deregulation. The national land use policy was analyzed in the present study with regard to the land use planning and environmental policy making in the temporal scope between 1990 when the greenbelt was conserved
2
1234567890 ‘’“”
8th International Conference on Environment Science and Engineering (ICESE 2018) IOP Publishing IOP Conf. Series: Earth and Environmental Science 167 (2018) 012043 doi :10.1088/1755-1315/167/1/012043
due to the need for sustainable land conservation and late 2000s when the greenbelt was started to be deregulated.
Table 1. The Status of Deregulation of Development Restriction Areas (Standard in 2010).
Section Seoul Daejeon Gwangju Busan Ulsan Daegu Incheon Area (km2) 0.65 4.53 13.03 9.04 4.53 7.53 2.10 Percentage (%) 0.61 4.22 12.13 8.42 4.22 7.01 1.95 Section Gyeonggi Chungnam Chugbuk Gyeongnam Jeonnam Gyeongbuk Total Area (km2) 36.53 1.56 1.53 9.04 14.53 2.61 107.42 Percentage (%) 34.01 1.45 1.42 8.42 13.53 2.43 100 Date: J J Yoon (2011) reconstruction[3].
2. Materials and Methods 2.1. Study Area
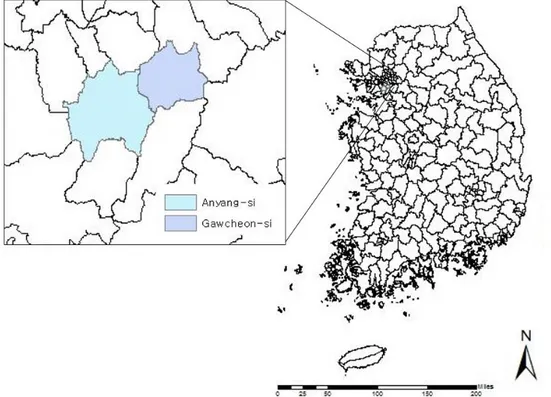
The spatial range is Gwacheon and Anyang city in Gyeonggi Province(figure 1). Research study area was selected in Gyeonggi Province with the highest rate of regional changes due to the deregulation the development-restricted zones. Among them, Gwacheon city is a major area where the environment is still preserved within greenbelt regulation. And Anyang city is selected due to the most variable land use area, when most of its greenbelts were released in 2000.
As about 92% of Gwacheon city is restricted to development with greenbelt, only about 8% of the areas are released, therefore they are preserved with greenbelt. Especially, as Anyang city geographically close to nearby industrial areas, a large-scale industrial space will be created to meet demand for related business partners. So, InVEST model was applied to these two areas where land use is significantly different.
1234567890 ‘’“”
8th International Conference on Environment Science and Engineering (ICESE 2018) IOP Publishing IOP Conf. Series: Earth and Environmental Science 167 (2018) 012043 doi :10.1088/1755-1315/167/1/012043
2.2. Research Methods 2.2.1 InVEST Model
InVEST (Integrated Valuation of Ecosystem Service and Tradeoff) model[5] is developed by Stanford University jointed National Capital Project and WWF (World Wide Fund For Nature) to identify between the natural assets of ecosystem and the economic relations. Based on result of ecosystem services assessment, policy-makers and stakeholders should set environmental management goals and create scenario in order to achieve the goals[6], [7].
The InVEST Version 3.3.3 Carbon model can present future changes as well as current values and analyze the changes and trends of ecosystem services based on a variety of spatio-time data.
Therefore based on the 1990 and late 2000s of Land-use map and 4 coefficient of carbon pool, it was calculated estimation of Carbon Fixation.
2.2.2 InVEST Carbon Model
Raster data file set drawn from Land-use Map and Carbon pool table to represent each of the land-use map classes are required for modelling by using Arc GIS Map 10.5.
Also another input data is the table of carbon pools (aboveground mass, belowground mass, soil, dead mass) (figure 2). This value was compiled from evaluation of published scientific literature on carbon storage to land-use classes and was obtained through the IPCC (Intergovernmental Panel on Climate Change)[8], [9], [10], [11].
Figure 2. InVEST Carbon model Process[7].
3. Results and Discussion
figure 3 shows the amount of carbon fixation in Gwacheon and Anyang city since 1990-2000s. Carbon fixation of water, wet-land, grass and forest regions was having high fixation amount and as the ratio of urban and barren regions was high, the carbon fixation tends to decrease. The model result of Gwacheon city was estimated to be 649266.44 Mg of C in 1990, and the carbon fixation in late 2000s was estimated to be 640774.25 Mg of C by decreasing 8492.17 Mg of C from the previous decade. Also, Anyang’s carbon fixation in 1990 was derived from 881866.88 Ma of C, and carbon fixation in late 2000s was estimated to 833381.81 Mg of C by decreasing 48485.05 Mg of C between 1990 and late 2000s.
The result is an analysis based on land-use cover map (LULC), causes of the changes can be interpreted based on them. Anyang city shows that the proportion of urban areas has changed significantly around city’ center. And Gwacheon city was analysed to have maintained the ratio of the
4
1234567890 ‘’“”
8th International Conference on Environment Science and Engineering (ICESE 2018) IOP Publishing IOP Conf. Series: Earth and Environmental Science 167 (2018) 012043 doi :10.1088/1755-1315/167/1/012043
forest area, but the barren region around the center was replaced by the urban area according to the time flows from 1990 to late 2000s.
A: Gwacheon City
a
1990s Late 2000s
B: AnYang City
1990s Late 2000s
a1: Water, 2: Urban, 3: Barren, 4: Wet-land, 5: Grass, 6: Forest, 7: Paddy area, 8: Agriculture area. Figure 3. Map of Carbon Fixation Result by InVEST Carbon model.
4. Conclusion
The study conducted a change in the research area by analysing the carbon fixation due to the deregulation of the Korean greenbelt. Due to the greenbelt deregulation, the environment protected by greenbelt releases has been developed into a barren and urban area and is under threat. Later, The South Korean government additionally deregulated 10% of the greenbelt in Gyeonggi Province in 2015 to solve the housing problems and secure industrial areas.
Accordingly, the impact of greenbelt deregulation was analyzed by comparing the amount of carbon fixation before and after the greenbelt deregulation by using the InVEST model for environmental conservation and development policies. In Anyang city, the carbon fixation was decreased by
1234567890 ‘’“”
8th International Conference on Environment Science and Engineering (ICESE 2018) IOP Publishing IOP Conf. Series: Earth and Environmental Science 167 (2018) 012043 doi :10.1088/1755-1315/167/1/012043
48485.05 Mg of C in 1990-2000s, and In case of Gwacheon city, it was decreased by 8492.17 Mg of C in the same period.
The results of this study can be applied to fundamental data for analyzing the economic value of the greenbelt that may be deregulated in the future and estimating the impact that land development policies may have on the environment and the society. And For more perfect assessment, it needs to combine soil analyses in terms of carbon fixation analysis in future studies.
5. References
[1] Ryu D H and Lee D K 2013 Evaluation on Economic Value of the Greenbelt’s Ecosystem Services in the Seoul Metropolitan Region J. Korea. National Association for Urban Planning and Design. 48 3 pp 279-292
[2] Moon M S 2016 A Study on the Industrial Space Improvement and the Establishment of the Development Restriction Area. Gyeonggi Development Institute. 251
[3] Yoon J J 2011 Development Restriction Area 1971-2011. Korea Land and Housing Institute. [4] Development of Decision Supporting Framework to Enhance Natural Capital Sustainability:
Focusing on Ecosystem Service Analysis. 2015 Korea Environment Institute
[5] Sharp R, Tallis H T, Ricketts T, Guerry A D, Wppd S A, Chaplin-Kramer R, Nelson E, Wolny S, P;wero N, Vigerstol K, Pennington D, Mendoza G, Aukema J, Foster J, Forrest J, Cameron D, Arkema K, Lonsdorf E, Kennedy C, Verutes G, Kim CK, Guannel G, Papenfus M, Tofr J, Marsik M, Bernhardt J, Griffin R, Glowinski K, Chaumount N, Perelaman A, Lacayo M, Mandle L, Hamel P, Vogl A L, Rogers L, Bierbower W 2015 InVEST User’s Guide. Stanford University, University of Minnesota, The Nature Conservancy, World Wildlife Fund
[6] IPCC 2001 Climate Change 2001: The Scientific Basis. Third Assessment Report of the Intergovernmental Panel on Climate Change. Cambridge University Press, New York. pp 365. [7] Natural Capital Project 2012 Informing Land-Use Plans in Central Sumatra. INVEST User
Guide Release +VERSION
[8] Kim C K 2014 Use the Framework of Ecosystem Service to Inform Sustainable Development of Marine and Coastal Environment. J. Society for Marine Environment and Energy. 11 4-4 [9] European Commission, Organisation for Economic Co-operation and Development, United
Nations, World Bank 2013 System of Environmental-Economic Accounting 2012 Experimental Ecosystem Accounting 1-204
[10] Korea Environment Institute 2015 Development of Decision Supporting Framework to Enhance Natural Capital Sustainability: Focusing on Ecosystem Service Analysis. Korea Environment Institute
[11] Lee H W, Kim C K, Hong H J, Roh Y H, Kang S I, Kim J H, Shin S C, Lee S J 2015 Development of Decision Supporting Framework to Enhance Natural Capital Sustainability: Focusing on Ecosystem Service Analysis. Korea Environment Institute. 3479-3651
Acknowledgments
This research was supported by Ministry of Science, ICT, and Future Planning in Korea (2015M3C8A6A06012735).
![Figure 2. InVEST Carbon model Process[7].](https://thumb-ap.123doks.com/thumbv2/123dokinfo/5077603.73497/4.892.197.704.527.814/figure-invest-carbon-model-process.webp)
