Superiority of Biphasic Over Monophasic Defibrillation Shocks is
Attributable to Less Intracellular Calcium Transient Heterogeneity
Gyo-Seung Hwang, MD, PhD, Liang Tang, PhD, Boyoung Joung, MD, PhD, Norishige Morita, MD, PhD, Hideki Hayashi, MD, PhD, Hrayr S. Karagueuzian, PhD, James N. Weiss, MD, Shien-Fong Lin, PhD, and Peng-Sheng Chen, MD
Division of Cardiology, Department of Medicine, Cedars-Sinai Medical Center (GSH, NM, HH), the Departments of Medicine (Cardiology) and Physiology, David Geffen School of Medicine at UCLA (JNW, HSK), Los Angeles, California and the Krannert Institute of Cardiology, Indiana University School of Medicine, Indianapolis, Indiana (LT, BYJ, SFL, PSC)
Abstract
Objectives—To test the hypothesis that superiority of biphasic waveform (BW) over monophasic waveform (MW) defibrillation shocks is attributable to less intracellular calcium (Cai) transient heterogeneity.
Background—The mechanism by which BW shocks have a higher defibrillation efficacy than MW shocks remains unclear.
Methods—We simultaneously mapped epicardial membrane potential (Vm) and Cai during 6 ms MW and 3/3 ms BW shocks in 19 Langendorff-perfused rabbit ventricles. After shock, the percentage of depolarized area was plotted over time. The maximum (peak) postshock values (VmP and CaiP, respectively) were used to measure heterogeneity. Higher VmP and CaiP imply less heterogeneity. Results—The defibrillation threshold was for BW and MW shocks were 288±99 V and 399±155 V, respectively (p=0.0005). Successful BW shocks had higher VmP (88±9 %) and CaiP (70±13 %) than unsuccessful MW shocks (VmP 76 %±10, p<0.001; CaiP, 57±8 %, p<0.001) of the same shock strength. In contrast, for unsuccessful BW and MW shocks of the same shock strengths, the VmP and CaiP were not significantly different. MW shocks more frequently created regions of low Cai surrounded by regions of high Cai (postshock Cai sinkholes). The defibrillation threshold for MW and BW shocks became similar after disabling the sarcoplasmic reticulum with thapsigargin and ryanodine.
Conclusions—The greater efficacy of BW shocks is directly related to their less heterogeneous effects on shock-induced sarcoplasmic reticulum Ca release and Cai transients. Less heterogeneous Cai transients reduces the probability of Cai sinkhole formation, thereby preventing the postshock reinitiation of VF.
Keywords
resuscitation; sarcoplamic reticulum; electrical stimulation; polarity
For correspondence: Peng-Sheng Chen, MD, Krannert Institute of Cardiology, 1801 N. Capitol Ave, E475, Indianapolis, IN 46202. Phone: 317-962-9755. Fax: 310-423-0318 email: chenpp@iupui.edu.
There are no conflicts of interests related to this basic science study.
Publisher's Disclaimer: This is a PDF file of an unedited manuscript that has been accepted for publication. As a service to our customers we are providing this early version of the manuscript. The manuscript will undergo copyediting, typesetting, and review of the resulting
NIH Public Access
Author Manuscript
J Am Coll Cardiol. Author manuscript; available in PMC 2009 September 2.
Published in final edited form as:
J Am Coll Cardiol. 2008 September 2; 52(10): 828–835. doi:10.1016/j.jacc.2008.05.040.
NIH-PA Author Manuscript
NIH-PA Author Manuscript
Biphasic waveform (BW) is more effective than monophasic waveform (MW) in achieving successful defibrillation. The mechanisms underlying the superiority of BW were unclear. One hypothesis is that BW improves defibrillation efficacy by lowering the excitation threshold (1). This hypothesis, however, was not supported by subsequent studies (2,3). Kao et al (4) showed that an electrical stimulus occurring during relative refractory period could induce graded responses and prolong action potential (AP). It is possible that action potential (refractoriness) extension could underlie the mechanisms of defibrillation (5). If so, then BW should be more effective than MW in prolonging the refractoriness. However, Zhou et al (6) showed that the BW shocks prolonged the action potential duration (APD) to a lesser degree than the MW shocks. Efimov et al (7) suggested that the higher defibrillation efficacy of BW may be related to the suppression of virtual electrode-induced phase singularities in the postshock period. In addition to changes of membrane potential, defibrillation shocks also have significant effects on intracellular calcium (Cai) transients (8). Hwang et al (9) demonstrated that the heterogeneous distribution of Cai during the postshock isoelectric window (10) plays a key role in the defibrillation outcome because the first postshock activation always occurred from a region of low Cai surrounded by high Cai (Cai sinkhole). We hypothesized that MW shocks would be more likely to produce Cai sinkholes than BW shocks of similar strengths by creating spatially distinct virtual anodes and cathodes during the shock. Because
hyperpolarization may have significantly different effects on the evolution of the Cai transient than depolarization, the spatially distinct virtual electrodes during a MW shock may accentuate Cai transient heterogeneity and facilitate the formation of Cai sinkholes. In contrast, during a BW shock, virtual anode formed during the first half of the shock become virtual cathode during the second half of the shock, and vice versa, producing a balanced effect on sarcoplasmic reticulum (SR) Ca release. This reduces Cai transient heterogeneity makes the formation of Cai sinkholes less likely. To test this hypothesis, we compared the effects of MW and BW shocks on the 50% probability of successful defibrillation (DFT50) in isolated Langendorff-perfused rabbit ventricles, using dual optical mapping to record epicardial membrane potential and Cai simultaneously (11). We found that superiority of BW over MW was due to less Cai transient heterogeneity, as hypothesized.
Methods
Surgical Preparation
The study protocol was approved by the Institutional Animal Care and Use Committee. New Zealand white rabbits (N=27) weighing 5.1 0.5 kg were used in this study. The hearts were perfused through aorta with Tyrode solution (NaCl 125, KCl 4.5, NaH2PO4 1.8, NaHCO3 24, CaCl2 1.8, MgCl2 0.5, and dextrose 5.5 mmol/L, added albumin 100 mg/L in deionized water). S1 pacing was given to left ventricular (LV) apex. Defibrillation shocks were applied through right ventricular (RV) endocardial and LV patch electrode using direct current shocks. Optical Mapping
The hearts were stained with Rhod-2 AM and RH237 (Molecular Probes) and excited with laser light at 532 nm (12). In the first 25 hearts, fluorescence was collected using two charge-coupled device (CCD) cameras (Dalsa) covering the same mapped field. We used a grid to calibrate the locations of the field of view of these two CCD cameras. The digital images (128 × 128 pixels) were gathered from the epicardium of the LV (25 × 25 mm2 area). We acquired 1000 frames continuously for 4 seconds. The actual camera speed was calibrated by the pacing cycle length of the Bloom stimulator. The calibrated frame rate, which varied between 250 frames per second to 400 frames per second, was used for data analyses. For the last 2 hearts, we used Micam Ultima-L dual camera system for data acquisition. There were 100X100 pixels per camera acquiring at 500 frames/s. Cytochalasin D (cyto-D, 5 μmol/L) was added to the perfusate to inhibit motion.
NIH-PA Author Manuscript
NIH-PA Author Manuscript
Dual Optical Mapping of MW and BW Shocks
After 8 S1 paced beats at 300 ms cycle length, fixed duration monophasic (6 ms) and biphasic (3/3 ms) truncated exponential waveform shocks were delivered from a Ventritex HVS-02 defibrillator in 19 hearts. The RV endocardial electrode was cathode and a patch on the LV posterior wall was anode during MW shocks. During BW shocks, the first phase used LV and RV electrodes for anode and cathode, respectively. The polarity switched during the second phase. After VF was induced by shock on T, an up-down algorithm was used to determine the DFT50. We defined the near-threshold shock strengths as shock strengths within 50 V from the DFT50 (13).
Effects of Ryanodine and Thapsigargin
We performed 6 additional experiments to test the importance of SR Ca cycling on MW and BW shock defibrillation. The DFT50 was estimated before and after 30 min of perfusion with ryanodine 10 μmol/L and thapsigargin 1 μmol/L.
Shock Polarity and APD
We delivered monophasic anodal shocks and cathodal shocks at 160 ms S1-shock coupling intervals to the same defibrillation electrodes in an additional 2 hearts. The S1 pacing cycle length was 350 ms for these 2 studies. The changes of APD throughout the mapped region were then analyzed.
Analysis of Optical Signals
The average fluorescence level (F̄) over the entire 1000 frames was first calculated for each pixel. The fluorescent level at different time points on that pixel was then compared with this average. The difference (delta) of the fluorescent level and the average fluorescence (F-F̄) was divided by the average fluorescence (F̄) to obtain a percentage of change above and below the average fluorescence. Shades of red and blue were used to indicate percentage of change above and below the average fluorescence, respectively, on the ratio maps.
Quantitative Analysis of Postshock Membrane Potential and Cai Changes
At each frame after shock, we determined the size (percentage) of the mapped region coded red. By default, the pixel is coded red if its fluorescence level is higher than the average (50%) fluorescence. We also performed the same analyses by coding the pixels red when the fluorescence exceeded (a) 25% average fluorescence and (b) 75% average fluorescence. We then plotted the percentage of frames coded red after defibrillation shocks (time zero) against time. The peak values (VmP and CaiP, respectively), and the time from the shock to their peak values (VmPT and CaiPT, respectively) were determined for each shock strength.
Previous studies showed that a near-threshold unsuccessful defibrillation shock is usually followed by synchronized repolarization (5), leading to the formation of a quiescent period during which no activation is present (13). In contrast to synchronized repolarization of membrane potential, the postshock Cai changes are not synchronized, with some areas showing continued Cai decline while the neighboring areas showing persistent Cai elevation. A Cai sinkhole is formed when a low Cai area is completely surrounded by high Cai area (9). Statistical Analysis
All data were presented as means ± SD. Student’s paired t tests were used to compare the mean values of VmP, CaiP, VmPT and CaiPT of the same shock strengths between MW and BW shocks ranged between 200V and 600V. Fisher’s exact test was used to compare the frequency of Cai sinkhole formation after MW and BW shocks. A P-value of ≤0.05 was considered statistically significant.
NIH-PA Author Manuscript
NIH-PA Author Manuscript
Results
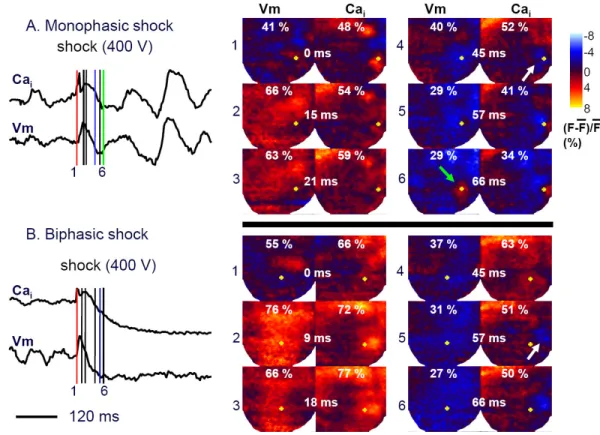
Unsuccessful MW Shocks and Successful BW Shocks at Equivalent Shock Strengths The DFT50 for MW shocks was higher than with BW shocks (399±155 V vs 288±99 V, P=0.0005). In 12 hearts, we analyzed 33 pairs of shocks at the same strength in which MW shocks resulted in failed defibrillation but BW shocks resulted in successful defibrillation. Figure 1 shows a typical example comparing an unsuccessful MW shock with a successful BW shock at the same intensity. The percent areas of the mapped region with greater than average membrane potential and Cai levels are indicated at the top of each map.
The VmP was larger after the BW shock (76%, Panel B2) than the MW shock (66%, Panel A2). The CaiP was also larger in BW than in MW (77% in Panel B3 vs 59% in Panel A3). The times between the shock and VmP (VmPT) after MW and BW shocks were 15 ms and 9 ms (Panel A2 and B2), respectively. The times between the shock and the CaiP (CaiPT) after the MW and BW shocks were 21 ms and 18 ms, respectively, in these episodes (Panel A3 and B3). The time of Cai sinkhole formation (white arrow) was 45 ms for the MW and was 57 ms for BW shock (Panels 4 and 5, respectively). For all 33 pairs of MW and BW shocks at the same shock strength, Cai sinkholes were observed in 100 % of the unsuccessful MW shocks and in 64 % of the successful BW shocks (p<0.001). As reported in a previous study (9), the Cai sinkholes were not observed in type A successful defibrillation. In 13 episodes, the first postshock activation originated from the Cai sinkholes within the mapped region (9). The VmP (76 %±10 vs. 88±9 %, p<0.001) and CaiP (57±8 % vs. 70±13 %, p<0.001) during the isoelectric window were lower after unsuccessful MW than successful BW shocks. The VmPT was 16±6 ms vs. 10±3 ms (P<0.001) and Cai PT was 23±6 ms vs 18±4 ms (P< 0.001) after MW and BW shocks, respectively. Figure 2 summarizes these findings.
These results were independent of the threshold fluorescence levels used to code the pixels red. When the threshold level was 75%, the VmP for MW and BW was 25±10% vs 32±16%, respectively (p=0.015) and the CaiP was 9±3% and 12±6%, respectively (p<0.001). When the threshold level was 25%, the VmP for MW and BW was 99±1% and 100±1% respectively (p<0.001) and the CaiP was 93±4% and 95±4%, respectively (p<0.001).
Unsuccessful BW and Unsuccessful MW Shocks at Equivalent Shock Strengths
We analyzed membrane potential-Cai dynamics during the postshock isoelectric window in 58 pairs (19 rabbits) of voltage-matched BW and MW shocks (354±106 V) near the DFT50 that failed to terminate VF. In contrast to the data presented in the previous paragraph, the VmP (78±9 % vs. 79±10 %) and CaiP (57±7 % vs. 58±7 %) during the isoelectric window were not different after failed MW and BW shocks, respectively. However, the isoelectric window was longer after BW shocks than MW shocks (65±11 ms vs 56±10 ms, respectively, P< 0.001). The VmPT was 16±6 ms vs. 11±4 ms (P< 0.001) and for Cai PT it was 22±7 ms vs 17±6 ms (P<0.001) after MW and BW shocks, respectively. Figure 3 shows these findings at different MW and BW shock strengths.
We compared 18 pairs of successful defibrillation induced by MW and BW shocks of equal strength (275±90 V). We found 7 of the 18 episodes in MW shocks and 3/18 (P=NS) in BW shocks were type B successful defibrillation (10).
Cai Sinkholes After MW and BW Shocks
We analyzed 29 pairs (MW vs. BW) of unsuccessful defibrillation episodes in which the earliest postshock focal activation originated from the Cai sinkholes. We found that the Cai sinkholes emerged significantly (P = 0.02) earlier after MW shocks (29±10 ms) than after BW shocks (35±11 ms) in all 29 episodes analyzed. For both MW and BW shocks, the successful
NIH-PA Author Manuscript
NIH-PA Author Manuscript
defibrillation was associated with larger VmP and CaiP than failed defibrillation (Table 1). After ryanodine and thapsigargin, the DFT50 for MW and BW shocks (232±42 V and 182±20 V, P=0.02) decreased to 165±43 V and 160±43 V (p=0.76), respectively.
Action potential and Cai Transient Characteristics After MW versus BW Shocks
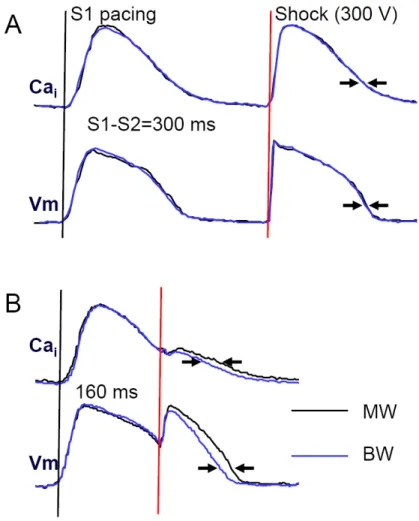
Figure 4A shows that when a shock was delivered at a long coupling interval (300 ms) when repolarization was complete, MW and BW shocks had similar effects on the action potential and Cai transient. However, when shocks were delivered at a shorter coupling interval (160 ms) during the relative refractory period (most frequently associated with the induction of VF), BW shocks caused less prolongation of the Cai transient duration than MW shocks (Figure 4B). Table 2 summarizes the results of all hearts studied. The single pixel analyses were performed by selecting a single representative pixel from the center of the mapped region. The summed fluorescence over the entire mapped region was also analyzed. We found that at the coupling interval of 160 or 140 ms, the duration of the Cai transient (at 70% return to baseline) was significantly shorter and more homogeneous for BW shocks than for MW shocks. The single pixel analyses showed the same trend.
Greater APD Prolongation at Virtual Anode than Virtual Cathode
To further characterize the effects of virtual anodes versus cathodes on APD, we compared monophasic anodal and cathodal shocks at an S1-shock interval of 160 ms in an additional two hearts. Figure 5A shows that both anodal and cathodal shocks prolonged APD at the site indicated by the arrows in Figure 5B. Figure 5B shows the formation of virtual anode and virtual cathode (arrows) during the anodal and cathodal shocks, respectively, on the epicardium near the RV endocardial electrodes. To compare the effects of shocks on APD, we subtracted the prolonged APD after the anodal shock (APD2) from that after the cathodal shock at all pixels. Figure 5C shows that in the region of the virtual electrodes there was greater
prolongation of APD at anodal sites than at cathodal sites, whereas in regions surrounding the virtual electrodes, the opposite occurred. The maps of a second heart showed the same finding.
Discussion
In the present study, we present evidence showing that the greater efficacy of BW shocks is associated with their less heterogeneous effects on shock-induced SR Ca release and Cai transients.
Postshock Heterogeneity and the Shock Outcome
We quantified the heterogeneity by VmP and CaiP. A higher peak value implies a greater ability for shocks to depolarize Vm and elevate SR Ca release everywhere, reducing the Vm dispersion and the likelihood of Cai sinkhole formation. Using this method, we found that the successful BW shocks resulted in less heterogeneous postshock Vm and Cai distributions than
unsuccessful MW shocks of the same strength. When both MW and BW shocks failed, there were no consistent differences between heterogeneity parameters. These findings indicate that successful defibrillation is associated with less postshock heterogeneity.
Sources of Shock-Induced Heterogeneity
We found that virtual anode sites were followed by larger APD prolongation than at virtual cathode sites, consistent with the hypothesis that hyperpolarization at virtual anodes increased the driving force for Ca entry through L-type Ca channels, triggering additional SR Ca release. The increased Cai then prolonged APD by potentiating inward Na-Ca exchange current, consistent with positive Cai-APD coupling (14). At virtual cathode sites, APD and Cai were also increased by further membrane depolarization, perhaps by reactivating recovered L-type
NIH-PA Author Manuscript
NIH-PA Author Manuscript
Ca channels, but the effects were more modest. These differential APD prolongation effects were observed only in late phase 2 or phase 3 of the AP, but not after full repolarization. During fibrillation, the effects of virtual cathodes and anodes on APD and Cai transient duration are also likely to be variable depending on local repolarization state relative to the timing of the shock. This makes it unlikely that Cai sinkholes would reliably form at virtual anodes or cathodes. Nevertheless, the greater efficacy of BW shocks at preventing or delaying Cai sinkhole formation is probably best attributed to an overall more balanced effect on the APD and the Cai transient, since regions that are virtual cathodes during the first half of the shock become virtual anodes during the second half of the shock, and vice versa. That is, the switching between anode and cathode half way through the shock should partially neutralize the heterogeneous effects of virtual electrodes on APD and Cai, hence reducing postshock heterogeneity and improving defibrillation efficacy.
Comparison With Previous Studies
Raman et al (15) have studied the effects of shocks on Cai, and found that the effects of shocks depend on the timing of application. Their analyses focused on the changes of Cai during the shock. However, Figure 2 of that manuscript showed a greater magnitude of Cai elevation and APD prolongation at virtual anode site than at virtual cathode site. Figure 5 of the present report is consistent with their findings. Yabe et al (16) gave shocks 300 ms after the last paced beat. Pacing studies before and after shocks showed BW caused less conduction block than MW. Because we found no differences of Cai transients after BW shocks and MW shocks given 300 ms after the last paced beat, Yabe’s findings cannot be explained by the changes of Cai transients.
Limitations
Due to the existence of transmural heterogeneity (17), the changes in Vm and Cai in the intramural or subendocardial layers of the ventricles might be different than that on the epicardium. A limitation of our study is that we were not able to map the shock effects below the epicardium to determine the transmural changes of Vm and Cai. It is possible that the mitochondrial Ca signal influenced the recording of Ca transient. However, previous studies showed that Rhod-2 was primarily trapped in the cytosol and not in subcellular organelles such as mitochondria (11).
Summary and Implications
BW shocks result in less spatial heterogeneity of Cai and delayed formation of Cai sinkholes, which in turn leads to delayed onset of the first postshock activation and longer isoelectric window as compared with MW shocks. The delayed emergence of the first postshock activation provides greater recovery time for the ventricles, thereby ensuring a higher safety factor for propagation without wavebreak. This sequence of events explains the mechanisms by which BW is more effective than MW in achieving ventricular defibrillation. We conclude that the greater efficacy of BW shocks is directly related to their less heterogeneous postshock Cai transient distribution, thus reducing the probability of Cai sinkholes formation and VF reinitiation.
Acknowledgements
We thank Avile McCullen, Lei Lin, Elaine Lebowitz and Sandra Owens for their assistance.
This study was supported by the NIH Grants P01 HL78931, R01 HL78932, 58533, 71140, University of California Tobacco Related Disease Research Program (14IT-0001); American Heart Association Grant-in-Aid, Western States Affiliate (0255937Y and 0555057Y), National Scientist Development Grant (0335308N), Established Investigator Award (#0540093N), Kawata, Laubisch, Price and Medtronic-Zipes Endowments, and a Chun Hwang Fellowship for Cardiac Arrhythmia Honoring Dr Asher Kimchi, Los Angeles, Calif. Medtronic, St Jude and Cryocath have donated
NIH-PA Author Manuscript
NIH-PA Author Manuscript
equipment to our research laboratory. Dr Chen is a consultant to Medtronic Inc. However, this paper did not include any data on commercial products or advocate off-label use of drugs or equipment.
Reference List
1. Jones JL, Jones RE, Balasky G. Improved cardiac cell excitation with symmetrical biphasic defibrillator waveforms. Am J Physiol 1987;253:H1418–H1424. [PubMed: 3425743]
2. Wharton JM, Richard VJ, Murry CE, et al. Electrophysiological effects of monophasic and biphasic stimuli in normal and infarcted dogs. Pacing Clin Electrophysiol 1990;13:1158–72. [PubMed: 1700392]
3. Daubert JP, Frazier DW, Wolf PD, Franz MR, Smith WM, Ideker RE. Response of relatively refractory canine myocardium to monophasic and biphasic shocks. Circulation 1991;84:2522–38. [PubMed: 1959202]
4. Kao CY, Hoffman BF. Graded and decremental response in heart muscle fibers. Am J Physiol 1958;194:187–96. [PubMed: 13559448]
5. Dillon SM. Optical recordings in the rabbit heart show that defibrillation strength shocks prolong the duration of depolarization and the refractory period. Circ Res 1991;69:842–56. [PubMed: 1873877] 6. Zhou X, Knisley SB, Wolf PD, Rollins DL, Smith WM, Ideker RE. Prolongation of repolarization
time by electric field stimulation with monophasic and biphasic shocks in open-chest dogs. Circ Res 1991;68:1761–7. [PubMed: 2036724]
7. Efimov IR, Cheng Y, Yamanouchi Y, Tchou PJ. Direct evidence of the role of virtual electrode-induced phase singularity in success and failure of defibrillation. J Cardiovasc Electrophysiol 2000;11:861–8. [PubMed: 10969748]
8. Fast VG, Ideker RE. Simultaneous optical mapping of transmembrane potential and intracellular calcium in myocyte cultures. J Cardiovasc Electrophysiol 2000;11:547–56. [PubMed: 10826934] 9. Hwang G-S, hayashi H, Tang L, et al. Intracellular calcium and vulnerability to fibrillation and
defibrillation in Langendorff-perfused rabbit ventricles. Circulation 2006;114:2595–603. [PubMed: 17116770]
10. Chen P-S, Shibata N, Dixon EG, et al. Activation during ventricular defibrillation in open-chest dogs. Evidence of complete cessation and regeneration of ventricular fibrillation after unsuccessful shocks. J Clin Invest 1986;77:810–23. [PubMed: 3949979]
11. Choi BR, Salama G. Simultaneous maps of optical action potentials and calcium transients in guinea-pig hearts: mechanisms underlying concordant alternans. J Physiol 2000;529(Pt 1):171–88. [PubMed: 11080260]
12. Omichi C, Lamp ST, Lin SF, et al. Intracellular Ca dynamics in ventricular fibrillation. Am J Physiol Heart Circ Physiol 2004;286:H1836–H1844. [PubMed: 14704235]
13. Wang NC, Lee M-H, Ohara T, et al. Optical mapping of ventricular defibrillation in isolated swine right ventricles: demonstration of a postshock isoelectric window after near-threshold defibrillation shocks. Circulation 2001;104:227–33. [PubMed: 11447091]
14. Sato D, Shiferaw Y, Qu Z, Garfinkel A, Weiss JN, Karma A. Inferring the cellular origin of voltage and calcium alternans from the spatial scales of phase reversal during discordant alternans. Biophys J 2007;92:L33–L35. [PubMed: 17172300]
15. Raman V, Pollard AE, Fast VG. Shock-induced changes of Ca(i)2+ and Vm in myocyte cultures and computer model: Dependence on the timing of shock application. Cardiovasc Res 2007;73:101–10. [PubMed: 17134687]
16. Yabe S, Smith WM, Daubert JP, Wolf PD, Rollins DL, Ideker RE. Conduction disturbances caused by high current density electric fields. Circ Res 1990;66:1190–203. [PubMed: 2335021]
17. Antzelevitch C. Heterogeneity and cardiac arrhythmias: an overview. Heart Rhythm 2007;4:964–72. [PubMed: 17599687]
Abbreviations and Acronyms
APD
action potential duration
NIH-PA Author Manuscript
NIH-PA Author Manuscript
BW
biphasic waveform Cai
intracellular calcium CaiP
the peak (maximum) area showing higher than average Cai after shock CaiPT
time from shock to the CaiP DFT50
shock strength associated with 50% probability of successful defibrillation
F̄
The average fluorescence level SR
sarcoplasmic reticulum VmP
the peak (maximum) area showing simultaneous depolarization of the membrane potential after shock
VmPT
time from shock to the VmP
NIH-PA Author Manuscript
NIH-PA Author Manuscript
Figure 1. Dual optical mapping of failed defibrillation with MW and successful defibrillation with BW shocks
Left panels of A and B show the time course of the average fluorescence of the entire mapped region following a MW (upper trace) or BW shock (lower trace). Right color panels show fluorescence intensity snapshots after a failed shock (400 V) delivered at 0 ms. Red, blue and green line segments indicate the time of shock, the time of Cai sinkhole formation and the end of the isoelectric window, respectively. The yellow dots on Vm maps are at the same location as the yellow dots on the Cai maps.
NIH-PA Author Manuscript
NIH-PA Author Manuscript
Figure 2. Comparison between successful BW and unsuccessful MW shocks of the same strength
There were significant differential effects of MW and BW shocks on VmP and CaiP, VmPT and CaiPT.
NIH-PA Author Manuscript
NIH-PA Author Manuscript
Figure 3. Comparison between unsuccessful BW and unsuccessful MW shocks of the same strength
There were no differences of VmP and CaiP for MW and BW shocks of the same strength. However, there were significant differences of VmPT and CaiPT.
NIH-PA Author Manuscript
NIH-PA Author Manuscript
Figure 4. The change of APD70 and CaiD70 after MW and BW shocks delivered at different coupling intervals
MW and BW shocks resulted in different APD70 and CaiD70 when the coupling interval was short (160 ms), but not when the coupling interval was 300 ms. The optical signals were generated by averaging the fluorescence of the entire mapped region.
NIH-PA Author Manuscript
NIH-PA Author Manuscript
Figure 5. Delta APD and Cai transient duration (CaT) maps and virtual electrode distribution during a 300 V monophasic shock
A shows the effects of shock (S) on the optical recordings at the sites indicated by arrows in B. B shows virtual anode (blue) and virtual cathode (red) during the monophasic shocks. C shows the difference (delta) map between the APD of the post-shock beat (APD2) constructed by subtracting APD2 of a cathodal shock by APD2 of an anodal shock. White to red colors indicate longer APD at the virtual anode than at virtual cathode, whereas the difference is reversed at surrounding sites.
NIH-PA Author Manuscript
NIH-PA Author Manuscript
NIH-PA Author Manuscript
NIH-PA Author Manuscript
NIH-PA Author Manuscript
Table 1
Effects of shock strength
MW fail MW success P-value BW Fail BW success P-value Voltage (V) 268±98 396±149 223±79 318±96 VmP (%) 78±14 93±7 0.002 76±10 91±7 <0.001 VmPT (ms) 19±9 14±4 0.03 12±4 9±2 0.01 Ca i P (%) 53±5 72±13 <0.001 54±6 68±12 <0.001 Ca i PT (ms) 27±9 21±4 0.03 21±6 17±5 0.04
Time from shock to Ca
i sink hole (ms) 33±10 47±12 0.03 24±11 48±16 0.02
NIH-PA Author Manuscript
NIH-PA Author Manuscript
NIH-PA Author Manuscript
Table 2
Vm and Ca
i
changes Induced by Shock on T
Single Representative Pixel
Summed Fluorescence Analyses
APD 70 (ms) Ca i70 (ms) APD 70 (ms) Ca i70 (ms) CI MW BW MW BW MW BW MW BW 300 ms 164±23 163±28 167±23 165±21 148±8 147±12 151±13 151±11 180 ms 256±45 261±46 253±43 256±41 270±38 269±34 266±42 265±41 160 ms 210±33 206±32 204±35 191±44* 214±36 208±34* 204±31 197±30* 140 ms 195±33 189±42 182±24 177±21* 186±18 177±21* 192±19 185±20*
P< 0.05 compared with MW BW, biphasic waveform; CI, coupling interval; MW, monophasic waveform Ca
i70
, duration of the Ca
i
transient between the onset and 70% return to baseline.
APD
70