https://doi.org/10.1177/1756286420925679 https://doi.org/10.1177/1756286420925679 Therapeutic Advances in Neurological Disorders
journals.sagepub.com/home/tan 1
Ther Adv Neurol Disord
2020, Vol. 13: 1–10 DOI: 10.1177/ 1756286420925679 © The Author(s), 2020. Article reuse guidelines: sagepub.com/journals-permissions
Introduction
Stroke is the leading cause of acquired disabilities in adults.1 Stroke-related impairments cause
dras-tic reductions in patients’ daily living activities and quality of life. To regain independence and quality of life after stroke, effective rehabilitation planning is essential. Recovery prediction can help clini-cians design individually tailored rehabilitation plans, including realistic discharge planning and appropriate allocation of time and resources. In addition, it allows patients to set realistic goals.2
Neuroimaging-based brain connectivity analyses are already used in recovery prediction, and several predictors have been identified.3–7 Neurologic
research has emphasized that the effects of neuro-logical disorders are exerted over an entire network because the brain is organized in networks of con-nections among many neurons.8–10 Damage caused
by stroke can diffuse through the brain networks and influence the function of distant brain regions even when the damage to the brain structure is a focal lesion.9,11 Therefore, using a brain
connectiv-ity analysis for recovery prediction is an appropriate approach. However, prediction remains difficult because of inter-individual variability.
Previous clinical studies have used various predic-tive markers. Among them, initial motor function is the most representative.2,12,13 However, it has
Prediction of motor recovery using indirect
connectivity in a lesion network after
ischemic stroke
Jungsoo Lee, Eunhee Park, Ahee Lee, Won Hyuk Chang, Dae-Shik Kim and Yun-Hee Kim Abstract
Background: Recovery prediction can assist in the planning for impairment-focused
rehabilitation after a stroke. This study investigated a new prediction model based on a lesion network analysis. To predict the potential for recovery, we focused on the next link-step connectivity of the direct neighbors of a lesion.
Methods: We hypothesized that this connectivity would contribute to recovery after stroke onset. Each lesion in a patient who had suffered a stroke was transferred to a healthy subject. First link-step connectivity was identified by observing voxels functionally connected to each lesion. Next (second) link-step connectivity of the first link-step connectivity was extracted by calculating statistical dependencies between time courses of regions not directly connected to a lesion and regions identified as first step connectivity. Lesion impact on second link-step connectivity was quantified by comparing the lesion network and reference network. Results: The lower the impact of a lesion was on second link-step connectivity in the brain network, the better the improvement in motor function during recovery. A prediction model containing a proposed predictor, initial motor function, age, and lesion volume was established. A multivariate analysis revealed that this model accurately predicted recovery at 3 months poststroke (R 2 = 0.788; cross-validation, R 2 = 0.746, RMSE = 13.15).
Conclusion: This model can potentially be used in clinical practice to develop individually tailored rehabilitation programs for patients suffering from motor impairments after stroke.
Keywords: lesion network, motor function, motor recovery, prediction model, stroke
Received: 1 January 2020; revised manuscript accepted: 20 April 2020.
Correspondence to:
Yun-Hee Kim
Department of Physical and Rehabilitation Medicine, Center for Prevention and Rehabilitation, Heart Vascular Stroke Institute, Samsung Medical Center, Sungkyunkwan University School of Medicine, Department of Health Sciences and Technology, Department of Medical Device Management & Research, Department of Digital Health, SAIHST, Sungkyunkwan University, 81 Irwon-ro, Gangnam-gu, Seoul 06351, Republic of Korea yunkim@skku.edu, yun1225.kim@samsung. com Jungsoo Lee Won Hyuk Chang
Department of Physical and Rehabilitation Medicine, Samsung Medical Center, Sungkyunkwan University School of Medicine, Seoul, Republic of Korea Eunhee Park Department of Physical and Rehabilitation Medicine, Kyungpook National University Medical Center, Daegu, Republic of Korea
Ahee Lee
Department of Health Sciences and Technology, Department of Medical Device Management & Research, Department of Digital Health, SAIHST, Sungkyunkwan University, Seoul, Republic of Korea
Dae-Shik Kim
School of Electrical Engineering, Korea Advanced Institute of Science and Technology, Daejeon, Republic of Korea
limitations in predicting motor recovery in patients with severe stroke.13 Furthermore, for
clinical purposes, an accurate prediction model beyond initial motor function itself is needed. Our aim in this study was to use magnetic reso-nance imaging (MRI) data and initial motor func-tion in a brain connectivity analysis to propose a new predictor that can accurately predict recov-ery from stroke.
Previous studies have demonstrated widespread remote changes in connectivity in regions in both hemispheres as the result of a focal lesion.8,14,15
Also, motor learning after stroke is performed by widespread networks in the whole brain, without the need for a motor-related central region, and many regions in widespread networks compen-sate for learning success.16 In this respect, an
investigation of the overall connectivity in the whole brain and the indirect connectivity of the damaged area, beyond the direct connectivity of the damaged area, might be important for under-standing recovery after stroke.
The second link-step connectivity of a lesion net-work (the next link-step beyond a lesion’s direct con-nectivity) was obtained from resting-state functional MRI (fMRI) and investigated using the following considerations: (a) second link-step connectivity is likely to be highly affected by a lesion because con-nectivity is adjacently connected to a lesion when considering the spread of damage throughout the entire network; (b) the connectivity forms a wider brain network and broadly covers more brain regions than first link-step connectivity in terms of informa-tion spreading within a network structure. Therefore, by quantifying second link-step connectivity, the impact of the focal lesion on the whole brain net-work can be assessed according to points (a) and (b). Furthermore, this connectivity is expected to actively contribute to recovery after stroke onset because it does not suffer actual physical damage from the focal lesion. During the recovery period, a lesion with a low impact on connectivity enables cost-effective reorganization to allow recovery across the whole brain network, so second link-step connectivity might indicate the potential for functional recovery. Therefore, we hypothesized that patients whose lesions had a low impact on second link-step con-nectivity would be more likely to recover from stroke damage, as reflected by better motor recovery, than patients whose lesions had high impacts on second link-step connectivity.
Materials and methods
Participants and experimental design
A total of 64 patients who had suffered ischemic stroke (36 men and 28 women, aged 57.9 ± 12.6 years) underwent MRI data acquisi-tion 2 weeks after stroke onset (T1), and their motor function was measured on the same day as MRI data acquisition. At 3 months after stroke onset (T2), motor function was measured again to assess functional improvement. The Fugl– Meyer assessment (FMA)17 score was used as a
measurement of motor function. The T1 FMA score was also used as a measure of initial motor function (baseline). These subjects were collected from the stroke database held by the Department of Physical and Rehabilitation Medicine at Samsung Medical Center, which has been col-lecting MRI data from patients who had suffered strokes and healthy subjects since 2007. Inclusion criteria were first-onset unilateral ischemic stroke and age 19 years or older at the time of stroke onset. Patients were excluded if they exhibited any clinically significant or unstable medical con-ditions, any neuropsychiatric comorbidity other than stroke, or any contraindication to MRI. The clinical information of participants is summarized in Table 1 and Supplemental Table 1. Resting-state fMRI data from 64 healthy subjects (26 men and 38 women, aged 50.0 ± 16.5 years) who reported no history of psychiatric or neurological problems were also used in this study. This retro-spective study was performed in accordance with relevant guidelines and the regulations of the Declaration of Helsinki. Ethical approval was obtained from the Institutional Review Board (IRB) of Samsung Medical Center, Seoul, Republic of Korea. We received an exemption from informed consent from the IRB because we used only previously collected data and did not exceed minimal risk.
Data acquisition
Participants were instructed to keep their eyes closed and remain motionless during the resting-state fMRI scan. The fMRI data were acquired using a Philips ACHIEVA® MR scanner (Philips
Medical Systems, Best, The Netherlands) operating at 3 T. During each session, 100 whole-brain images were collected using a T2*-weighted, gradient echo-planar imaging sequence with the following metrics: 35 axial slices, slice thickness = 4 mm, no gap,
matrix size = 128 × 128, repetition time = 3000 ms, echo time = 35 ms, flip angle = 90°, and field of view = 220 × 220 mm. T1-weighted images were acquired with the following settings: 124 axial slices, slice thickness = 1.6 mm, no gap, matrix size = 512 × 512, repetition time = 13.9 ms, echo time = 6.89 ms, flip angle = 8°, and field of view = 240 × 240 mm for lesion segmenta-tion and atlas transformasegmenta-tion.
Data processing
Preprocessing was performed using the SPM8 package (Welcome Trust Centre for Neuroimaging, University College London, London, UK). Functional images were processed as follows: (a) slice timing correction; (b) spatial realignment for head motion correction; (c) spatial normalization into the Montreal Neurological Institute (MNI) atlas space resampling to 2-mm isotropic voxels. Spatial smoothing of the normalized images was per-formed using a 6-mm full-width half-maximum Gaussian kernel. For the connectivity analysis, sev-eral nuisance sources were removed by linear regression of 22 nuisance parameters. Parameters were obtained from six head motion parameters and six first-order temporal derivatives of the motion parameters. Each of the five parameters was obtained from a principal component analysis of the temporal components of white matter and ventricle signals as nuisance regressors for effective noise correction.18 Band-pass filtering between
0.009 and 0.08 Hz was performed to remove con-stant offsets and linear trends. Nuisance regression and band-pass filtering were processed using MATLAB (MathWorks, Natick, MA, USA). Connectivity was obtained by calculating the sta-tistical dependencies between time courses using Pearson’s correlation coefficients. We examined positive correlation coefficients in this study. A voxel-wise connectivity analysis (seed-based approach) was used to extract the first link-step connectivity. The connectivity map had a threshold of p < 0.00005 (uncorrected).19 A region-wise connectivity
analy-sis was used to extract second link-step connectiv-ity. An automated anatomical labeling (AAL) template20 was used for the region-wise
connectiv-ity analysis. The AAL template was segmented into 116 regions (90 regions in the cerebrum and 26 regions in the cerebellum) covering the whole brain. We averaged nine regions in the left and right cerebellum and eight regions in the vermis. The brainstem region was added by drawing it manually on the AAL atlas. The resulting modi-fied AAL atlas, which contained 94 regions, was co-registered to the normalized fMRI data space using SPM8 and then analyzed.
Each patient lesion was segmented on a T1- weighted structural image with reference to appar-ent hyper-intensities on a diffusion-weighted image that was acquired at the patient’s first neurology appointment. One medical doctor manually drew the lesion maps of all patients using MRIcro lesion Table 1. Patient demographics.
Age (years) Mean ± SD 57.9 ± 12.6 Sex (n) Male 36 Female 28 Side of lesion (n) Right 33 Left 31 Bilateral 0 Location of lesion (n) Supratentorial 45 Infratentorial 19 Type of stroke (n) Hemorrhagic 0 Ischemic 64 Initial severity (n)
Mild and moderate (FMA >55) 19
Severe (FMA ⩽55) 45
Time poststroke (days)
T1, Mean ± SD 14.8 ± 6.9
T2, Mean ± SD 97.4 ± 11.7
FMA scores
T1, Mean ± SD 43.5 ± 23.3
T2, Mean ± SD 67.5 ± 25.9
FMA, Fugl–Meyer Assessment; SD, standard deviation; T1, 2 weeks poststroke; T2, 3 months poststroke.
mapping software (https://www.mccauslandcenter .sc.edu/crnl/). Each lesion was normalized into the standard MNI space. The results were visualized using the xjView toolbox (http://www.alivelearn .net/xjview) (Figure 1). The lesion side of the map was flipped to the right side for visualization.
Second link-step functional connectivity from lesions
Recently, a lesion network mapping method has been used to investigate the expanding localization of symptoms from heterogeneous lesions.19,21 That method is based on
lesion-seeded, resting-state, functional connectivity. We based our extraction of a lesion’s second link-step connectivity on that lesion network mapping method. Our framework involved seven steps (Figure 2). (Step 1) The lesion image of a patient and the resting-state fMRI of a healthy subject were normalized into the standard MNI space. The normalized lesion was used as the first seed region in the seed-based approach. (Step 2) A seed-voxel-seed-based approach was performed using a mean time course of the lesion volume in resting-state fMRI of a healthy subject (first link-step, voxel-wise connectivity, p < 0.00005). Extracting that first link-step connectivity of a lesion is similar to the previously published lesion network mapping method.19 (Step 3) The second seed
was the volume of all the lesion-seeded con-nected voxels (the first link-step connectivity of the lesion) in a region of the modified AAL atlas. Therefore, multiple second seeds were found because the first link-step connectivity covered multiple regions. (Step 4) The
connectivity was calculated between the mean time course of the second seed and the mean time courses of all other AAL atlas regions except for the lesion-seeded connected voxels (second link-step, region-wise connectivity, p < 0.01). (Step 5) Step 4, region-wise connec-tivity, was repeated for each second seed region, and an adjacency matrix was constructed by inserting the correlation values in rows corre-sponding to the seed regions. (Step 6) The asymmetric adjacency matrix obtained from Step 5 was then made symmetric by adding the transpose matrix. For example, say that two regions in the modified AAL atlas (regions 1 and 2) contain lesion-seeded connected voxels. The second seed in region 1 consists of all the lesion-seeded connected voxels in region 1, and the connectivity (W(1,2)) is calculated between the mean time course of the second seed in region 1 and the mean time course of all the voxels in region 2 except the lesion-seeded con-nected voxels. Meanwhile, the second seed in region 2 contains the lesion-seeded connected voxels in region 2, and the connectivity (W(2,1)) is calculated between the mean time course of the second seed in region 2 and the mean time course of all the voxels in region 1 except the lesion-seeded connected voxels. We trans-formed the asymmetric matrix into a symmetric matrix by adding the transpose matrix (W(1,2) + W(2,1)). If two regions include second
seeds (lesion-seeded connected voxels), we wanted to reflect an aggravated effect between regions 1 and 2 to distinguish that situation from one in which only a single region has a second seed (W(1,2) or W(2,1)) to clarify the con-trast of lesion impact. (Step 7) The adjacency Figure 1. Lesion maps. All masks of stroke lesions were flipped to the right hemisphere.
matrices corresponding to a lesion were repeat-edly obtained from all healthy subjects (AP H1 1,AP H1 2,AP H1 3, ...)by following Step (1) through Step (6), and then all the matrices were averaged. The averaged matrix represents the second link-step connectivity of one lesion. Therefore, the second link-step connectivity matrix of a patient lesion (
A
P1) was defined as follows: A A n P i n P Hi 1 1 1 =∑
=where AP Hi1 is the second link-step connectivity matrix of the i-th healthy subject, and n is the number of healthy subjects. All matrices AP1−AP64 are illustrated in Supplemental Figure 1.
We quantitatively measured the impact of a lesion on the brain network by counting the number of unconnected and weaker connections compared with the reference connectivity matrix (ref A_ )
in the second link-step connectivity matrix (A matrix). The number of connections is our pre-dictor in the study. The ref A_ was obtained by averaging the modified AAL connectivity matri-ces of all healthy subjects. The connectivity matrix does not mask any lesion area, and the lesion-seeded connected voxels and intrinsic con-nectivity matrix are extracted.
C A ref A C if C and i j otherw ij ij ij ij ij = = < ≠ _ , , 1 0 1 iise Predictor C i m j m ij = = =
∑∑
1 1where
A
ij is an element of the second link-step connectivity matrix of one patient, ref _Aij is anelement of the reference connectivity matrix, m is the number of regions, and Cij is illustrated in Supplemental Figure 2. In this study, a connection with less than the reference connection strength was defined as a connection that was weakly impacted by the lesion. A connection with no strength was defined as a connection that was not indirectly impacted by the lesion. Therefore, our proposed predictor corresponds to the number of connections with weak and no lesion impacts.
Statistical analysis
We used linear regression to identify the relation-ship between the improvement of motor function and the proposed predictor. A multiple regression was also used to establish the proposed prediction model using the proposed predictor and patient Figure 2. Framework to extract the second link-step connectivity of a lesion.
characteristics. Leave-one-out cross-validation (LOOCV) and k-fold cross-validation were per-formed to assess the performance of our proposed prediction model. These statistics were derived using the statistics toolbox of MATLAB R2014b. Results
Univariate analysis
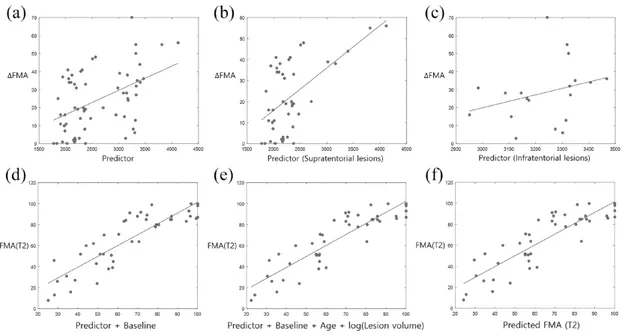
The second link-step connectivity of 64 lesions was extracted. The proposed predictor used the number of second link-step connections (the number of connections in the adjacency matrix in Supple-mental Figure 2). A linear regression model was used to investigate the relationships between the proposed predictor and motor function recovery (∆FMA = FMA (T2) – FMA (T1)) (Figure 3(a)). The predictor did correlate with motor function recovery (r = 0.470, p = 8.79e-05, R2 = 0.221).
We also divided patients into groups based on whether their lesion was supratentorial or infraten-torial, and again investigated the relationship between our predictor and improvements in motor function (Figure 3(b) and (c)). Our predictor was highly significant for patients with supratentorial lesions but not for patients with infratentorial lesions (supratentorial lesions, r = 0.588, p = 2.15e-05, R2 = 0.346; infratentorial lesions, r = 0.295,
p = 0.2217, R2 = 0.087). When assessing the
relationship between the clinical characteristics of patients and motor function recovery, we found that age and lesion volume correlated with motor function recovery (age, r = 0.335, p = 0.0068,
R2 = 0.112; lesion volume, r = 0.257, p = 0.0403,
R2 = 0.066) (Supplemental Figure 3). Multivariate analysis for supratentorial lesions
We investigated the combined model between both variables (predictor + baseline) using a multiple linear regression model. The combined model dem-onstrated high accuracy in predicting motor func-tion after 3 months (FMA (T2)) (r = 0.868, p = 1.13e-14, R2
= 0.753, root mean square error (RMSE) = 12.97) (Figure 3(d)). A multivariate analysis considering patient characteristics at base-line, age, and lesion volume as independent factors was performed. The best prediction model was FMA (T2) ~ 1 + Predictor + Baseline + Age + log(Lesion volume) (r = 0.888, p = 3.79e-16,
R2
= 0.788, RMSE = 12.01) (Figure 3(e)). In the multivariate analysis (Table 2), the proposed
pre-dictor remained significant and contributed signifi-cantly to the accuracy of the prediction.
A multivariate analysis of all variables except the proposed predictor was performed to investigate the proposed predictor’s worth in predicting motor function. This model was FMA (T2) ~ 1 + Baseline + Age + log(Lesion volume) (r = 0.824, p = 3.14e-12, R2 = 0.679, RMSE = 14.77). R2
increased by more than 0.1 when our proposed pre-dictor was added and RMSE decreased by more than 2.7. Our proposed predictor thus valuably enhanced the accuracy of the prediction. Furthermore, the proposed predictor was not cor-related with other variables (lesion volume, p = 0.8264; age, p = 0.2004; baseline, p = 0.7127).
Cross-validation
The LOOCV results are shown in Figure 3(f), which shows the relationship between the pre-dicted FMA score obtained from the model and the actual FMA score obtained from the test data at 3 months poststroke. Those results verify the performance of our model (r = 0.864, p = 2.08e-14, R2 = 0.746, RMSE = 13.15). A 9-fold
cross-validation (5 test datasets, 40 training data-sets) was also performed, and the mean perfor-mance (r = 0.863, p = 3.12e-14, R2 = 0.744,
RMSE = 13.19) obtained after 30 trials was sim-ilar to the LOOCV results.
Discussion
Second link-step connectivity as a recovery predictor
One of the main findings of this study was that the impact of a lesion on the second link-step connec-tivity is related to improvement in motor function during the recovery period. This is distinct from previous studies that focused on connections directly damaged by a lesion. Several recent stud-ies have demonstrated widespread remote changes in connectivity in regions between both hemi-spheres due to a focal lesion.8,14,15 Furthermore,
Beckman et al. showed that a focal lesion impacted brain connectivity in diverse networks,22
regard-less of the location of the affected or unaffected side or the motor network.8,14,23 The terms
‘con-nectional’ and ‘connectomal diaschisis’ have been coined recently.11 Based on these studies, we
lesion on large-scale networks might be valuable for designing rehabilitation plans and determining prognosis. We demonstrated that the less the impact of a lesion on second link-step connectivity in a whole brain network, the better the improve-ment in motor function. In this study, age and lesion volume were also associated and negatively correlated with improved motor function, in agreement with previous studies.24–27
Recovery prediction using resting-state functional connectivity analysis
Resting-state functional connectivity (rs-FC) analysis has been used widely in neurologic research to investigate recovery patterns and to find recovery-related indicators. However, ana-tomical or diffusion tensor imaging (DTI) data analysis has primarily been used in recovery pre-diction studies.28 These analyses are useful for
Figure 3. Relationships between variables (proposed predictor (a), proposed predictor for supratentorial lesions (b), and proposed predictor for infratentorial lesions (c)) and motor function recovery (∆FMA) in univariate analysis (all lesions, r = 0.470, p = 8.79e-05, R2 = 0.221; supratentorial lesions, r = 0.588, p = 2.15e-05, R2 = 0.346; infratentorial lesions, r = 0.295, p = 0.2217, R2 = 0.087). (d) Relationship between the combined model (baseline + proposed predictor) and motor function at 3 months poststroke (FMA (T2)) (r = 0.868, p = 1.13e-14, R2 = 0.753). (e) Results from the multiple linear regression model [FMA (T2) ~
1 + Predictor + Baseline + Age + log(Lesion volume)] (r = 0.888, p = 3.79e-16, R2 = 0.788). (f) Validation results. Relationship between predicted motor function (predicted FMA (T2)) and actual motor function at 3 months poststroke (FMA (T2)) (r = 0.864, p = 2.08e-14, R2 = 0.746, RMSE = 13.15).
FMA, Fugl–Meyer Assessment; RMSE, root-mean-square error; T2, 3 months poststroke.
Table 2. Multiple linear regression model.
FMA (T2) ~ 1 + Predictor + Baseline + Age + log(Lesion volume)
Variable Estimate SE t value p value
Predictor 0.3408 0.076 4.46 6.42e-05
Baseline 0.8087 0.077 10.46 5.21e-13
Age –0.1107 0.079 –1.40 0.1678
log(Lesion volume) –0.1446 0.076 –1.90 0.0646
investigating the direct influences of a lesion loca-tion, size, or damaged motor pathways. In this study, we focused on indirectly damaged connec-tivity (second link-step connecconnec-tivity) to predict functional recovery. rs-FC analysis is more flexi-ble than anatomical or DTI analysis. In other words, rs-FC analysis has fewer technical limita-tions than the other two techniques, which is why we chose it to validate our hypothesis. Stroke lesions include white matter structures. Typically, fMRI analysis is applied to investigate neural sig-nals in gray matter structures. Several recent stud-ies have investigated fMRI signals in white matter structures.29–33 In addition, convergence between
anatomical connectivity obtained from DTI anal-ysis and functional connectivity obtained from rs-FC analysis has been detected,34 and novel
analyses such as lesion network mapping using fMRI signals obtained from white matter struc-tures have been applied to study neurological dis-orders.19,21,34 We validated the importance of
indirectly damaged connectivity and confirmed the potential of our method for predicting recov-ery using rs-FC analysis.
Advantages and limitations of the study
First link-step and second link-step connectivities from a lesion were obtained sequentially from healthy subjects. Many second link-step connec-tivity matrices from all healthy subjects were aver-aged to obtain the second link-step connectivity from each lesion. This improves the signal to noise ratio. We verified our model in a wide variety of initial impairment patients (from extremely severe to slightly severe patients). In a previous study, ini-tial impairment showed relatively low prediction accuracy in patients with a severe initial deficit.35
Our model demonstrated high predictive accuracy even though severe patients (FMA (T1) ⩽55) who showed high variability in recovery composed a large proportion of our test population.
This study also had several limitations. First, the proposed predictor was less valuable for infraten-torial lesions than suprateninfraten-torial lesions. Our method mainly assessed the global effect of lesions in cortical regions, and the functional connectiv-ity of the pons or medulla is sparse in cortical regions.19,36 The brainstem regions also include
physiological noise, such as cardiac and respira-tory cycles, which should be removed through physiological monitoring.37,38 As a result, the
second link-step connectivity of infratentorial
lesions in our study had relatively low strength and was indistinguishable among lesions (Supplemental Figure 4). Another limitation of this study is the period of recovery. In this study, FMA improvement scores from approximately 3 months after stroke onset were used to quantify motor function recovery. Additional motor func-tion can be recovered after a longer period of time. However, according to previous studies, most spontaneous recovery occurs within the first 3 months after stroke onset.39 Lastly, information
related to the spatial topography of the second link-step connectivity is not provided. That infor-mation would provide insight for noninvasive brain stimulation protocols. Beyond the magni-tude of the index, further study regarding that spatial topography is needed.
Conclusion
We measured lesion impacts on second link-step connectivity in the lesion network to develop a predictor of stroke recovery and proposed a pre-diction model to predict motor function 3 months poststroke. The model, including a proposed pre-dictor, initial motor function, lesion volume, and age, demonstrated high accuracy for predicting motor function at 3 months poststroke. This model can potentially be used in clinical practice to develop individually tailored rehabilitation programs for patients suffering from motor impairments after stroke.
Funding
The authors disclosed receipt of the following financial support for the research, authorship, and/or publication of this article: This work was supported by a National Research Foundation of Korea (NRF) grant funded by the Korean government (NRF-2020R1A2C3010304, NRF- 2020R1C1C1011688, NRF-2017M3A9G5083 690).
Conflict of interest statement
The authors declare that there is no conflict of interest.
ORCID iD
Yun-Hee Kim https://orcid.org/0000-0001- 6101-8851
Supplemental material
Supplemental material for this article is available online.
References
1. Go AS, Mozaffarian D, Roger VL, et al. Heart disease and stroke statistics-2014 update.
Circulation 2014; 129: e28–e292.
2. Stinear C. Prediction of recovery of motor function after stroke. Lancet Neurol 2010; 9: 1228–1232.
3. Siegel JS, Ramsey LE, Snyder AZ, et al. Disruptions of network connectivity predict impairment in multiple behavioral domains after stroke. Proc Natl Acad Sci USA 2016; 113: E4367–E4376.
4. Kuceyeski A, Navi BB, Kamel H, et al. Structural connectome disruption at baseline predicts 6-months post-stroke outcome. Hum Brain Mapp 2016; 37: 2587–2601.
5. Jiang L, Xu H and Yu C. Brain connectivity plasticity in the motor network after ischemic stroke. Neural Plast 2013; 2013.
6. Burke Quinlan E, Dodakian L, See J, et al. Neural function, injury, and stroke subtype predict treatment gains after stroke. Ann Neurol 2015; 77: 132–145.
7. Lee J, Lee M, Kim D-S, et al. Functional reorganization and prediction of motor recovery after a stroke: a graph theoretical analysis of functional networks. Restor Neurol Neurosci 2015; 33: 785–793.
8. Carter AR, Astafiev SV, Lang CE, et al. Resting interhemispheric functional magnetic resonance imaging connectivity predicts performance after stroke. Ann Neurol 2010; 67: 365–375.
9. Honey CJ and Sporns O. Dynamical consequences of lesions in cortical networks.
Hum Brain Mapp 2008; 29: 802–809.
10. Carter AR, Shulman GL and Corbetta M. Why use a connectivity-based approach to study stroke and recovery of function? Neuroimage 2012; 62: 2271–2280.
11. Carrera E and Tononi G. Diaschisis: past, present, future. Brain 2014; 137: 2408–2422. 12. Saposnik G, Guzik AK, Reeves M, et al. Stroke
Prognostication using Age and NIH Stroke Scale SPAN-100. Neurology 2013; 80: 21–28.
13. Prabhakaran S, Zarahn E, Riley C, et al. Inter-individual variability in the capacity for motor recovery after ischemic stroke. Neurorehabil
Neural Repair 2007; 22: 64–71.
14. He BJ, Snyder AZ, Vincent JL, et al. Breakdown of functional connectivity in frontoparietal networks underlies behavioral deficits in spatial neglect. Neuron 2007; 53: 905–918.
15. Wang L, Yu C, Chen H, et al. Dynamic functional reorganization of the motor execution network after stroke. Brain 2010; 133: 1224–1238.
16. Dahms C, Brodoehl S, Witte OW, et al. The importance of different learning stages for motor sequence learning after stroke. Hum Brain Mapp 2020; 41: 270–286.
17. Fugl-Meyer AR, Jääskö L, Leyman I, et al. The post-stroke hemiplegic patient. 1. A method for evaluation of physical performance. Scand J
Rehabil Med 1974; 7: 13–31.
18. Chai XJ, Castañón AN, Öngür D, et al.
Anticorrelations in resting state networks without global signal regression. Neuroimage 2012; 59: 1420–1428.
19. Boes AD, Prasad S, Liu H, et al. Network localization of neurological symptoms from focal brain lesions. Brain 2015; 138: 3061–3075. 20. Tzourio-Mazoyer N, Landeau B, Papathanassiou
D, et al. Automated anatomical labeling of activations in SPM using a macroscopic anatomical parcellation of the MNI MRI single-subject brain. Neuroimage 2002; 15: 273–289. 21. Laganiere S, Boes AD and Fox MD. Network
localization of hemichorea-hemiballismus.
Neurology 2016; 86: 2187–2195.
22. Beckmann CF, DeLuca M, Devlin JT, et al. Investigations into resting-state connectivity using independent component analysis. Philos Trans R
Soc Lond B Biol Sci 2005; 360: 1001–1013.
23. Ovadia-Caro S, Villringer K, Fiebach J, et al. Longitudinal effects of lesions on functional networks after stroke. J Cereb Blood Flow Metab 2013; 33: 1279–1285.
24. Thijs VN, Lansberg MG, Beaulieu C, et al. Is early ischemic lesion volume on diffusion-weighted imaging an independent predictor of stroke outcome? A multivariable analysis. Stroke 2000; 31: 2597–2602.
25. Bagg S, Pombo AP and Hopman W. Effect of age on functional outcomes after stroke rehabilitation.
Stroke 2002; 33: 179–185.
26. Schiemanck S, Post M, Kwakkel G, et al. Ischemic lesion volume correlates with long-term functional outcome and quality of life of middle cerebral artery stroke survivors. Restor Neurol
Neurosci 2005; 23: 257–263.
27. Schiemanck S, Post M, Witkamp TD, et al. Relationship between ischemic lesion volume and functional status in the 2nd week after middle cerebral artery stroke. Neurorehabil Neural Repair 2005; 19: 133–138.
28. Stinear CM and Ward NS. How useful is imaging in predicting outcomes in stroke rehabilitation?
Int J Stroke 2013; 8: 33–37.
29. Mazerolle EL, Beyea SD, Gawryluk JR, et
al. Confirming white matter fMRI activation
in the corpus callosum: co-localization with DTI tractography. Neuroimage 2010; 50: 616–621.
30. Gawryluk JR, Mazerolle EL, Brewer KD, et al. Investigation of fMRI activation in the internal capsule. BMC Neurosc 2011; 12: 56.
31. Fabri M and Polonara G. Functional topography of human corpus callosum: an FMRI mapping study. Neural Plast 2013; 2013.
32. Mazerolle EL, Gawryluk JR, Dillen KN, et al. Sensitivity to white matter fMRI activation Increases with field strength. PLoS One 2013; 8: e58130.
33. Gawryluk JR, Mazerolle EL and D'Arcy RC. Does functional MRI detect activation in white matter? A review of emerging evidence, issues, and future directions. Front Neurosci 2014; 8: 239.
34. Fox MD, Buckner RL, Liu H, et al. Resting-state networks link invasive and noninvasive brain stimulation across diverse psychiatric and neurological diseases. Proc Natl Acad Sci USA 2014; 111: E4367–E4375.
35. Bigourdan A, Munsch F, Coupé P, et al. Early fiber number ratio is a surrogate of corticospinal tract integrity and predicts motor recovery after stroke. Stroke 2016; 47: 1053–1059.
36. Engström M, Karlsson T and Landtblom A-M. Reduced thalamic and pontine connectivity in Kleine–Levin syndrome. Front Neurol 2014; 5: 42. 37. Brooks JC, Faull OK, Pattinson KT, et al.
Physiological noise in brainstem FMRI. Front
Hum Neurosci 2013; 7.
38. Harvey AK, Pattinson KT, Brooks JC, et al. Brainstem functional magnetic resonance imaging: disentangling signal from physiological noise. Journal of Magn Reson Imaging 2008; 28: 1337–1344.
39. Cramer SC. Repairing the human brain after stroke: I. Mechanisms of spontaneous recovery.
Ann Neurol 2008; 63: 272–287.
Visit SAGE journals online journals.sagepub.com/ home/tan