저작자표시-비영리-변경금지 2.0 대한민국 이용자는 아래의 조건을 따르는 경우에 한하여 자유롭게 l 이 저작물을 복제, 배포, 전송, 전시, 공연 및 방송할 수 있습니다. 다음과 같은 조건을 따라야 합니다: l 귀하는, 이 저작물의 재이용이나 배포의 경우, 이 저작물에 적용된 이용허락조건 을 명확하게 나타내어야 합니다. l 저작권자로부터 별도의 허가를 받으면 이러한 조건들은 적용되지 않습니다. 저작권법에 따른 이용자의 권리는 위의 내용에 의하여 영향을 받지 않습니다. 이것은 이용허락규약(Legal Code)을 이해하기 쉽게 요약한 것입니다. Disclaimer 저작자표시. 귀하는 원저작자를 표시하여야 합니다. 비영리. 귀하는 이 저작물을 영리 목적으로 이용할 수 없습니다. 변경금지. 귀하는 이 저작물을 개작, 변형 또는 가공할 수 없습니다.
Doctoral Thesis in Medicine
Potential Neuroprotection Against
Detrimental Effects of Diabetes and
Hyperglycemia in Ischemic Stroke
Ajou University Graduate School
Major in Medicine
Potential Neuroprotection Against
Detrimental Effects of Diabetes and
Hyperglycemia in Ischemic Stroke
Supervised by Jin Soo Lee
I submit this thesis as the Doctoral thesis in Medicine
August, 2018
Ajou University Graduate School
Major in Medicine
The Doctoral thesis of Seong-Joon Lee in Medicine is hereby
approved.
Thesis Defence Committee President
Ji Man Hong
Byung Gon Kim
Yup Kang
Oh Young Bang
Jin Soo Lee
Ajou University Graduate School
July 7
th, 2018
ACKNOWLEDGEMENTS
I would like to express my gratitude to all those who gave me the opportunity to complete this thesis. I am deeply indebted to Prof. Jin Soo Lee (Ajou University, Korea) for giving me inspiration for my thesis, the wholehearted guidance, and encouragements throughout the preparation of this thesis. I thank Prof. Ji Man Hong (Ajou University, Korea) for valuable advice and criticism, and support in completion of this thesis as the chief of Ajou University Stroke Team; Prof. Byung Gon Kim (Ajou University, Korea) for valuable assistance that encompass the context of this thesis; Prof. Yup Kang (Ajou University, Korea) for valuable assistance that deepened my understanding of glucose metabolism, diabetes mellitus, and diabetic animal models; Prof. Oh Young Bang (Sungkyunkwan University, Korea) for valuable assistance that helped me improve the weaknesses of my thesis. I especially thank Bok Seon Yoon who was my personal tutor for approaching basic researches.
Most of all, I would like to thank my family. My wife, Young In Eom, gave me absolute support throughout be preparation of this thesis. I also thank my son, Kyu Hwa Lee, and the baby to be born, for all the joy and happiness they have given me.
June 20th, 2018
-ABSTRACT-
Potential neuroprotection against detrimental effects of
diabetes and hyperglycemia in ischemic stroke
Hyperglycemia and Diabetes mellitus (DM) is a common comorbidity of ischemic stroke, and it is associated with adverse events such as early neurological deterioration (END), infarct growth, hemorrhagic transformation, and increased mortality. In PART I, we evaluated the association between fibrinogen, a prothrombotic protein, and END of diabetic patients with ischemic stroke. In PART II, we evaluated potential effects of admission hyperglycemia on outcomes, infarct growth, and hemorrhagic transformation after endovascular treatment (EVT). In part III, in diabetic rats, we evaluated the ant-ischemic effects of pretreatment with evogliptin, a dipeptidyl peptidase (DPP-4) inhibitor, and metformin, respectively, and combined.
PART I: Early Neurological deterioration and fibrinogen
We included 3814 ischemic stroke patients within 72 hours of onset. To evaluate the association between fibrinogen and END (National Institutes of Health Stroke Scale [NIHSS] ≥ 2 increase within 1 week of admission), analysis based on propensity score matching between END and non-END population in DM (END, n=261; non-END, n=522) and non-DM populations (END, n=399; non-END, n=798) was performed. Fibrinogen levels were overall higher in the END subgroup compared to non-END subgroup. Only in the DM population were fibrinogen levels an independent predictor for END (fibrinogen levels 300–599 mg/dL, odds ratio: 1.618, 95% confidence interval: 1.037 – 2.525, p=0.034, fibrinogen levels ≥600 mg/dL, 2.575, 1.018 – 6.514, p=0.046; non-DM population, p=0.393). In diabetic patients with acute
PART II: Adverse effects of hyperglycemia after reperfusion therapy
Between January 2011 and May 2016, patients that underwent EVT with pre-procedural and post-pre-procedural diffusion-weighted imaging were identified from a multicenter registry. Normoglycemia was defined as a glucose level ≤110 mg/dL, moderate hyperglycemia as >110 and ≤170 mg/dL, and overt hyperglycemia as >170 mg/dL. Its effects on poor outcomes (3-month modified Rankin Scale score 3–6), infarct growth, and parenchymal hematoma type 2 were analyzed. Of 720 patients encountered, 341 patients were eligible. Glycated hemoglobin levels were higher in overt hyperglycemia group compared to normoglycemia/moderate hyperglycemia group (p<0.001). Moderate hyperglycemia (odds ratio 2.37 [95% confidence interval 1.26– 4.45], p=0.007) and overt hyperglycemia (2.84 [1.19–6.81], p=0.019) were associated with poor outcomes. Post-procedural infarct volumes were significantly greater in hyperglycemic patients (padjusted = 0.003). Both findings
were confirmed in the total population, and the non-reperfusion subgroup. Only overt hyperglycemia (9.28 [1.66–51.88], p = 0.011) was associated with parenchymal hematoma type 2. This association was confirmed in the total population, and reperfusion subgroup.
PART III: Potential neuroprotection of antidiabetic drugs
Type 1 diabetes was induced by intraperitoneal injection of streptozotocin in rats aged 6~8 weeks. The rats were treated with vehicle, evogliptin, metformin, or evogliptin/metformin co-administration for 30 days. Stroke was induced by transient middle cerebral artery occlusion afterwards. Ischemic damage was measured by determining infarct volume through T2 weighted magnetic resonance imaging. The results showed pronounced reduction of infarct volume in the co-administration group. Blood glucose lowering effects were
significant in the metformin group and co-administration group, while glycated hemoglobin levels were significantly lower in the co-administration group. Plasma insulin levels were significantly higher in the co-administration group. These results show that combined treatment of metformin and evogliptin provide further glycemic control, improve beta cell function and offer neuroprotective effects against ischemic stroke.
Key Words: Hyperglycemia, Diabetes mellitus, fibrinogen, endovascular therapy, evogliptin
TABLE OF CONTENTS
ABSTRACT···i
TABLE OF CONTENTS···iv
LIST OF FIGURES···viii
LIST OF TABLES···x
PART I. Early Neurological Deterioration Fibrinogen Level as a Marker for Early Neurological Deterioration in Patients with Acute Ischemic Stroke and Diabetes I. INTRODUCTION···2
II. METHODS···3
A. Study population···3
B. Data acquisition···4
C. Propensity score matching and statistical analysis···5
III. RESULTS···7
A. Analysis of total population···7
B. Analysis of diabetic population and propensity score matching···11
C. Analysis of non-DM population and propensity score matching···16
PART II. Reperfusion
Varying Levels of Hyperglycemia Adversely Affect Clinicoradiographic Outcomes After Endovascular Reperfusion Treatment
I. INTRODUCTION···26
II. METHODS···28
A. Patient enrollment···28
B. Evaluation···29
C. Procedures··· 30
D. Grouping of presenting hyperglycemia and definition of DM···31
E. Statistical analysis··· 32
III. RESULTS···33
A. Baseline characteristics stratified according to glucose status at hospitalization···33
B. Reperfusion treatment and outcomes···36
C. Infarct growth··· 40
D. Hemorrhagic complications··· 43
IV. DISCUSSION···46
Co-administration of Metformin and The DPP-4 Inhibitor Evogliptin Reduces Cerebral Infarct Volume in Diabetic Rat Brain
I. INTRODUCTION···52
II. METHODS··· 54
A. Animals and experimental groups···54
B. Drug treatment···55
C. Transient middle cerebral artery occlusion···57
D. Magnetic resonance imaging···58
E. Sacrifice and analysis of plasma and tissue··· 59
F. Immunohistochemistry···60
G. Statistical analysis···61
III. RESULTS···62
A. Effect on body weight, food intake, and serial blood glucose levels after STZ induced diabetes and antidiabetic therapy···62
B. Effects of antidiabetic medication on final infarct volume···64
C. Final glucose levels, HbA1c levels, plasma insulin levels and GLP-1 levels after antidiabetic therapy···66
D. GLP-1 immunohistochemistry in ischemic rat brain tissue···69
IV. DISCUSSION···74
LIST OF FIGURES
PART I. Early Neurological Deterioration
Fibrinogen Level as a Marker for Early Neurological Deterioration in Patients with Acute Ischemic Stroke and Diabetes
Figure 1. A Dot plot depicting standardized mean differences before and after propensity score matching. ···6
PART II. Reperfusion
Varying Levels of Hyperglycemia Adversely Affect Clinicoradiographic Outcomes After Endovascular Reperfusion Treatment
Figure 1. Changes in pre & post-procedure cerebral infarct volume According to hyperglycemia present on admission. ···41
PART III. Potential Neuroprotection
Co-administration of Metformin and The DPP-4 Inhibitor Evogliptin Reduces Cerebral Infarct Volume in Diabetic Rat Brain
Figure 1. The changes according to time of body weight and food intake, fasting blood glucose after streptozotocin injection. ···63
Figure 2. The anti-stroke effect of drugs measured by MR T2WI infarct volume at 1day after tMCAO in streptozotocin induced diabetes rats. ···65 Figure 3. The effect of drug in final blood glucose, HbA1c, plasma insulin and active GLP-1 levels after streptozotocin. ···67 Figure 4. The NeuN and DAPI staining in brain cortex tissue at 1day after tMCAO localizes the GLP-1R staining to the neurons. ···70 Figure 5. The GLP-1R expression in brain cortical tissue at 1day after tMCAO. ···72 Figure 6. The GLP-1R expression in striatal brain tissue at 1 day after tMCAO. ···73
LIST OF TABLES
PART I. Early Neurological Deterioration
Fibrinogen Level as a Marker for Early Neurological Deterioration in Patients with Acute Ischemic Stroke and Diabetes
Table 1. Comparison of baseline data in END population and Non-END population. ···8 Table 2. Validation of potential factors associated with early neurologic deterioration. ···10 Table 3. Characteristics of END patients in the diabetic population. ···12 Table 4. A logistic regression model to validate association between fibrinogen levels and END after propensity score matching in the diabetic population. ···15 Table 5. Characteristics of END patients in non-diabetic population. ···17 Table 6. A logistic regression model to validate association between fibrinogen levels and END after propensity score matching in non-diabetic population. ···20
PART II. Reperfusion
Varying Levels of Hyperglycemia Adversely Affect Clinicoradiographic Outcomes After Endovascular Reperfusion Treatment
Table 1. Baseline characteristics and pretreatment factors according to glycemic subgroups on presentation. ···34 Table 2. Reperfusion treatment and outcomes according to glycemic subgroup. ···37 Table 3. Logistic regression model of hyperglycemia as a risk factor for a poor outcomes according to reperfusion status after endovascular revascularization therapy. ···38 Table 4. Logistic regression model of hyperglycemia as a risk factor for parenchymal hematoma type 2 according to reperfusion status after endovascular revascularization therapy. ···44
PART III. Potential Neuroprotection
Co-administration of Metformin and The DPP-4 Inhibitor Evogliptin Reduces Cerebral Infarct Volume in Diabetic Rat Brain
PART I. Early Neurological Deterioration
Fibrinogen Level as a Marker for Early Neurological
Deterioration in Patients with Acute Ischemic Stroke and
I. INTRODUCTION
Diabetes mellitus (DM) and hyperglycemia adversely affect the outcome and pathophysiology of acute ischemic stroke. In both case-control (Barber et al., 2004) and cohort studies (Weimar et al., 2005), the associations between DM and early neurological deterioration (END) (Davalos et al., 1999; Kim et al., 2015), more complications (Kamalesh et al., 2008), severe handicap and disability (Megherbi et
al., 2003; Lee et al., 2015), and mortality (Kamalesh et al., 2008), have been reported.
Hyperglycemia is also associated with bigger lesion size (Els et al., 2002), symptomatic intracranial hemorrhages (Demchuk et al., 1999; Lansberg et al., 2007), edema (Berger and Hakim, 1986), and mortality (Candelise et al., 1985). While END is more frequently encountered in diabetic patients, the specific mechanism for how DM promotes END are not well known. In clinical practice, predicting END allows for more timely intervention. Therefore, gaining further insight into the mechanisms of END specific to patients with DM will improve the ability to identify and intervene in END in apparently sensitive populations. One possible mechanism involves fibrinogen, which is a prothrombotic protein and an acute phase reactant known to be elevated in DM patients (Meigs et al., 2000; Dunn and Ariens, 2004). Indeed, numerous literature shows that fibrinogen is associated with development of coronary artery thrombi and future cardiac events (Ernst, 1993; Koenig, 2003). However, the link between hyperfibrinogenemia and END in acute ischemic stroke has yet to be demonstrated. In this study, we accessed whether elevated fibrinogen levels in diabetic patients with acute ischemic stroke were associated with END in a large, single-center population.
II. METHODS
A. Study population
This was a retrospective study approved by the Institutional Review Board, and performed in accordance with the ethical standards of the 1964 Declaration of Helsinki and its later amendments. The study was based on consecutive patients enrolled in a hospital stroke database. From this database, we reviewed patients from January 2000 to 2015. Among them, 3814 patients with acute ischemic stroke within 72 hours of onset, with available National Institutes of Health Stroke Scale (NIHSS) data were included.
B. Data acquisition
According to a previous study which showed that prediabetic levels of hba1c >6.1% were associated with increased stroke recurrence (Wu et al., 2013), the diagnosis of DM was defined as either a prior diagnosis of diabetes, or glycated hemoglobin (HbA1c) levels >6.1% at admission. Lab data of classic stroke risk factors and hemostatic profiles such as fibrinogen, fibrin degradation products (FDP), D-dimer were obtained on admission. Erythrocyte sedimentation rate (ESR), and standard C-reactive protein (CRP) levels were analyzed as an acute inflammatory marker, to compare with fibrinogen. The components of the metabolic syndrome were also analyzed. Lab data to evaluate diabetic conditions, such as fasting glucose levels, urine glucose, urine proteins, HbA1c levels, etc. were also included in the analysis. Trial of Org 10172 in Acute Stroke Treatment (TOAST) classification, and NIHSS scores on admission and at discharge were collected from the database.
C. Propensity score matching and statistical analysis
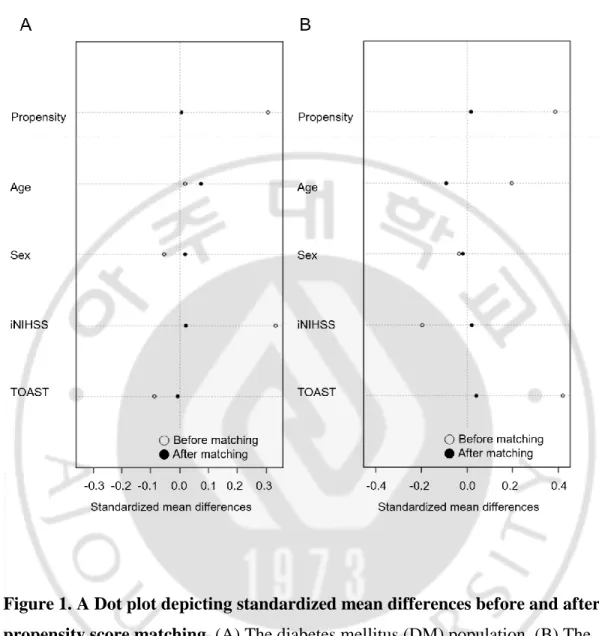
END was defined as an increase in NIHSS score of 2 or more within 7 days post admission (Kanamaru et al., 2017), as modified from a previous study. A sensitive criteria in defining END was used, to detect subtle changes. Since END is influenced by higher initial NIHSS and TOAST classifications, propensity score matching was used to adjust well-matched confounding factors. Univariate and multivariate analyses were performed to evaluate the effects of fibrinogen and other predictors of END among 3814 acute stroke patients. Multivariate analysis was performed by adjusting age, sex, comorbid hypertension, DM, initial NIHSS, and TOAST classification. The p value for diabetes status x fibrinogen level interaction was calculated by a logistic regression model. For subgroup analysis, patients were divided into DM (n= 1360) and non-DM (n=2454) populations. In each subgroup, a 1:2 propensity score matching was performed between END patients and non-END patients adjusting age, sex, initial NIHSS score, and TOAST classification (Figure 1A-B). Differences between the two groups before and after propensity score matching were analyzed, using χ2 test for categorical variables and Student’s t-test
for continuous variables. Multiple logistic regression analysis was then performed, adjusting for clinical variables associated with END such as age, sex, hypertension, initial NIHSS, and TOAST classification, as well as with potentially significant factors in the univariate analysis (p<0.005), to confirm the significance of fibrinogen levels on END. All statistical analyses were performed using IBM SPSS Statistics 20 software (Chicago, IL).
Figure 1. A Dot plot depicting standardized mean differences before and after propensity score matching. (A) The diabetes mellitus (DM) population. (B) The
III. RESULTS
A. Analysis of total population
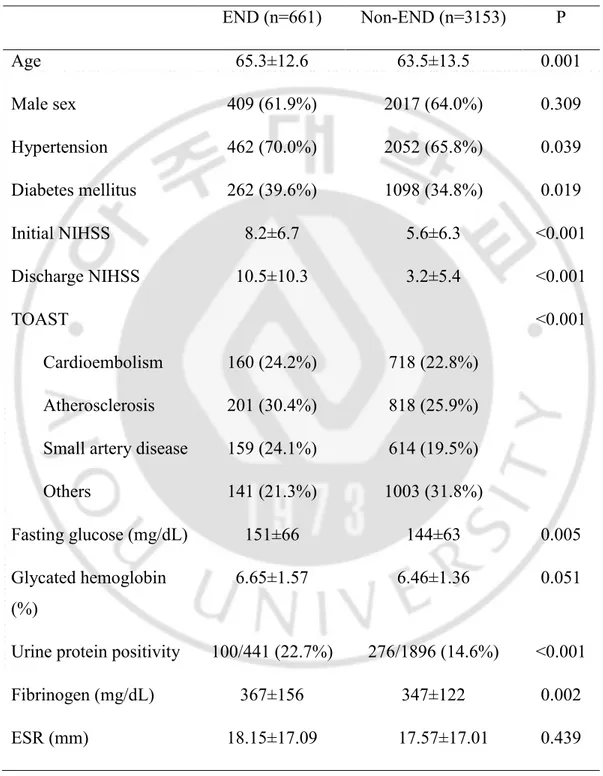
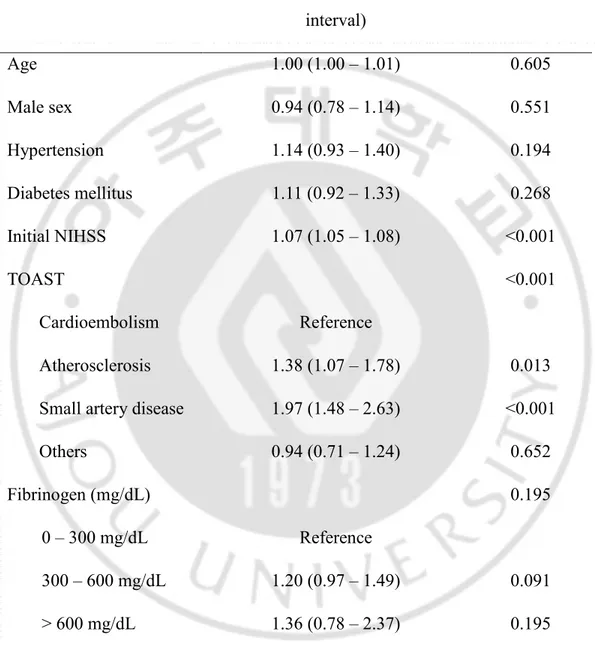
Of 3814 acute stroke patients, 661 (17.3%) experienced END. Patients in the END group were older (65.3 ± 12.6 vs. 63.5 ± 13.5, p=0.001), and more frequently had comorbid DM (39.6% vs. 34.8%, p=0.019), hypertension (70.0% vs. 65.8%, p=0.039), a higher initial NIHSS (8.2 ± 6.7 vs. 5.6 ± 6.3, p<0.001), higher fasting glucose (151 ± 66 vs. 144 ± 63 mg/dL, p=0.005), positive urine proteins (22.7% vs. 14.6%, p<0.001), and higher fibrinogen levels (367 ± 156 vs. 347 ± 122 mg/dL, p=0.002) (Table 1). In a multiple regression analysis of the entire population, high fibrinogen levels were not significantly associated with END after adjustment of confounders (p=0.195) (Table 2). The interaction between diabetes status and fibrinogen levels for END was not statistically significant (p=0.101).
Table 1. Comparison of baseline data in END population and Non-END population. END (n=661) Non-END (n=3153) P Age 65.3±12.6 63.5±13.5 0.001 Male sex 409 (61.9%) 2017 (64.0%) 0.309 Hypertension 462 (70.0%) 2052 (65.8%) 0.039 Diabetes mellitus 262 (39.6%) 1098 (34.8%) 0.019 Initial NIHSS 8.2±6.7 5.6±6.3 <0.001 Discharge NIHSS 10.5±10.3 3.2±5.4 <0.001 TOAST <0.001 Cardioembolism 160 (24.2%) 718 (22.8%) Atherosclerosis 201 (30.4%) 818 (25.9%)
Small artery disease 159 (24.1%) 614 (19.5%)
Others 141 (21.3%) 1003 (31.8%)
Fasting glucose (mg/dL) 151±66 144±63 0.005
Glycated hemoglobin (%)
6.65±1.57 6.46±1.36 0.051
Urine protein positivity 100/441 (22.7%) 276/1896 (14.6%) <0.001
Fibrinogen (mg/dL) 367±156 347±122 0.002
CRP (mg/dL) 0.81± 2.00 0.73±2.33 0.459 Metabolic syndrome 288 (43.6%) 1295 (41.1%) 0.236 Lipid panel T.chol (mg/dL) 179.54±42.07 179.15±51.46 0.857 LDL (mg/dL) 107.42±37.48 105.68±35.45 0.262 HDL (mg/dL) 45.65±12.87 45.94±13.40 0.616 TG (mg/dL) 139.77±122.26 142.83±117.81 0.552
END, Early neurological deterioration, NIHSS, National Institutes of Health Stroke Scale; TOAST, Trial of Org 10172 in Acute Stroke Treatment; ESR, Erythrocyte Sedimentation Rate; CRP, C-Reactive Protein; T.chol, Total Cholesterol; LDL, Low Density Lipoprotein; HDL, High Density Lipoprotein; TG, Triglyceride.
Table 2. Validation of potential factors associated with early neurologic deterioration.
Odds ratio (95% confidence interval) P Age 1.00 (1.00 – 1.01) 0.605 Male sex 0.94 (0.78 – 1.14) 0.551 Hypertension 1.14 (0.93 – 1.40) 0.194 Diabetes mellitus 1.11 (0.92 – 1.33) 0.268 Initial NIHSS 1.07 (1.05 – 1.08) <0.001 TOAST <0.001 Cardioembolism Reference Atherosclerosis 1.38 (1.07 – 1.78) 0.013
Small artery disease 1.97 (1.48 – 2.63) <0.001
Others 0.94 (0.71 – 1.24) 0.652
Fibrinogen (mg/dL) 0.195
0 – 300 mg/dL Reference
300 – 600 mg/dL 1.20 (0.97 – 1.49) 0.091
> 600 mg/dL 1.36 (0.78 – 2.37) 0.195
NIHSS, National Institutes of Health Stroke Scale; TOAST, Trial of Org 10172 in Acute Stroke Treatment.
B. Analysis of diabetic population and propensity score matching
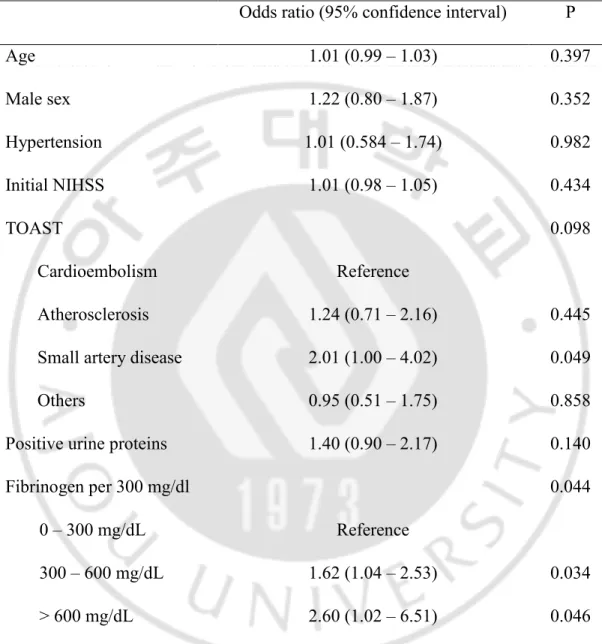
There were 1360 diabetic and 2454 non-diabetic patients. In the DM population (END=262, non-END=1098), comorbid hypertension (81.6% vs. 74.6%, p=0.017), initial NIHSS (10.4 ± 10.6 vs. 3.6 ± 5.7, p<0.001), positive urine proteins (35.1% vs. 21.2%, p<0.001), and fibrinogen levels (392.9 ± 204.2 mg/dL, p=0.012) were significantly higher in the END population compared to non-END population (Table 3). Propensity score matching was performed for age, sex, initial NIHSS, and TOAST classification. The relative multivariate imbalance measure L1 was 0.621 before matching, and 0.609 after matching. No covariate exhibited a large imbalance. After matching, proteinuria (34.7% vs. 23.4%, p=0.007), and hyperfibrinogenemia (392.8 ± 204.6 vs. 361 ± 123.1 mg/dL, p=0.009) were still significantly associated with END (Table 3). In this population, further logistic regression analysis was performed adjusting for age, sex, hypertension, TOAST classification, and proteinuria. Fibrinogen was still significantly associated with END in the DM population (fibrinogen <300 mg/dL as reference; fibrinogen levels 300~599 mg/dL, odds ratio: 1.618, 95% confidence interval: 1.037 – 2.525, p=0.034, fibrinogen levels ≥600 mg/dL, 2.575, 1.018 – 6.514, p=0.046) (Table 4).
Table 3. Characteristics of END patients in the diabetic population.
Before matching After matching*
END (n=262) Non-END (n=1098) P END (n=261) Non-END (n=522) P Age 65.3±11.8 65.1±11.7 0.771 65.3±11.8 64.8±11.8 0.593 Male sex 160 (61.1%) 700 (63.8%) 0.418 159 (60.9%) 315 (60.3%) 0.877 Hypertension 213 (81.6%) 812(74.6%) 0.017 213 (81.6%) 431 (82.6%) 0.741 Initial NIHSS 8.0±6.6 5.7±6.4 <0.001 7.9±6.6 7.6±6.8 0.562 Discharge NIHSS 10.4±10.6 3.6±5.7 <0.001 10.4±10.5 4.8±6.5 <0.001 TOAST 0.167 0.169 Cardioembolism 52 (19.8%) 221 (20.1%) 52 (19.9%) 111 (21.3%) Atherosclerosis 88 (33.6%) 328 (29.8%) 88 (33.7%) 163 (31.2%)
Others 58 (22.1%) 314 (28.6%) 57 (21.8%) 146 (28.0%) Fasting glucose
(mg/dL) 190.9±84.1 184.0±85.5 0.238 190.7±84.2 189.5±87.8 0.852
Glycated hemoglobin
(%) 7.5±1.7 7.3±1.5 0.119 7.5±1.7 7.4±1.6 0.392
Urine protein positivity 59 (35.1%) 143 (21.2%) <0.001 58 (34.7%) 76 (23.4%) 0.007
Fibrinogen (mg/dL) 392.9±204.2 359.0±119.1 0.012 392.8±204.6 361.1±123.1 0.009 ESR (mm) 22.0±20.5 21.2±20.1 0.547 22.0±20.5 21.3±18.9 0.643 CRP (mg/dL) 0.9±2.3 0.9±2.8 0.931 0.9±2.3 1.1±3.2 0.528 Metabolic syndrome 149 (56.9%) 609 (55.5%) 0.681 149 (57.1%) 305 (58.4%) 0.720 Lipid panel T.chol (mg/dL) 179.6±43.2 181.7±69.0 0.629 179.3±43.0 182.2±47.4 0.396 LDL (mg/dL) 106.3±37.7 106.1±37.4 0.919 106.0±37.4 107.5±38.1 0.604 HDL (mg/dL) 43.7±11.7 43.9±15.0 0.825 43.7±11.7 44.0±12.1 0.775
TG (mg/dL) 158.6±113.5 163.4±133.4 0.600 158.7±113.7 165.6±153.3 0.521
END, Early neurological deterioration; NIHSS, National Institutes of Health Stroke Scale; TOAST, Trial of Org 10172 in Acute Stroke Treatment; ESR, Erythrocyte Sedimentation Rate; CRP, C-Reactive Protein; T.chol, Total Cholesterol; LDL, Low Density Lipoprotein; HDL, High Density Lipoprotein; TG, Triglyceride.
Table 4. A logistic regression model to validate association between fibrinogen levels and END after propensity score matching* in the diabetic population.
Odds ratio (95% confidence interval) P
Age 1.01 (0.99 – 1.03) 0.397 Male sex 1.22 (0.80 – 1.87) 0.352 Hypertension 1.01 (0.584 – 1.74) 0.982 Initial NIHSS 1.01 (0.98 – 1.05) 0.434 TOAST 0.098 Cardioembolism Reference Atherosclerosis 1.24 (0.71 – 2.16) 0.445
Small artery disease 2.01 (1.00 – 4.02) 0.049
Others 0.95 (0.51 – 1.75) 0.858
Positive urine proteins 1.40 (0.90 – 2.17) 0.140
Fibrinogen per 300 mg/dl 0.044
0 – 300 mg/dL Reference
300 – 600 mg/dL 1.62 (1.04 – 2.53) 0.034
> 600 mg/dL 2.60 (1.02 – 6.51) 0.046
NIHSS, National Institutes of Health Stroke Scale; TOAST, Trial of Org 10172 in Acute Stroke Treatment.
C. Analysis of non-DM population and propensity score matching
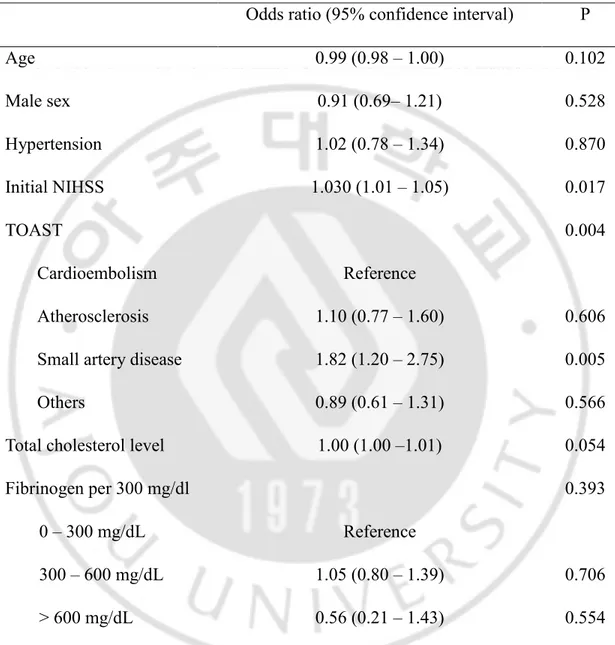
In the non-DM population (END=399, Non-END=2055), age (65.3 ± 13.2 vs. 62.7 ± 14.3, p<0.001), initial NIHSS (8.4 ± 6.8 vs. 5.6 ± 6.3, p<0.001), and fasting glucose levels (125.6 ± 30.9 vs. 122.1 ± 29.7 mg/dL, p=0.036) were significantly higher in the END group, and TOAST classification differed (p<0.001) (Table 5). Propensity score matching for age, sex, initial NIHSS, and TOAST classification was performed, and the relative multivariate imbalance measure L1 was 0.581 before matching, and 0.525 after matching. The covariates did not show a large imbalance. After matching, TOAST classification (p=0.003), higher total cholesterol levels (179.5 ± 41.3 vs. 173.6 ± 38.4 mg/dL, p=0.015), and higher low density lipoprotein levels (108.2 ± 37.4 vs. 102.8 ± 34.3 mg/dL, p=0.015) were significantly associated with END (Table 5). Multivariate analysis including age, male sex, presence of hypertension, initial NIHSS, TOAST classification, and total cholesterol levels as covariables in this matched population did not show association between fibrinogen and END (p=0.393) (Table 6).
Table 5. Characteristics of END patients in the non-diabetic population.
Before matching After matching*
END (n=399) Non-END (n=2055) P END (n=399) Non-END (n=798) P Age 65.3±13.2 62.7±14.3 <0.001 65.3±13.2 66.4±13.4 0.145 Male sex 249 (62.4%) 1317 (64.1%) 0.522 249 (62.4%) 505 (63.3%) 0.767 Hypertension 249 (62.4%) 1240 (61.1%) 0.636 249 (62.4%) 494 (62.6%) 0.945 Initial NIHSS 8.4±6.8 5.6±6.3 <0.001 8.4±6.8 8.2±6.7 0.520 Discharge NIHSS 10.6±10.2 3.0±5.2 <0.001 10.6±10.2 4.4±6.2 <0.001 TOAST <0.001 0.003 Cardioembolism 108 (27.1%) 497 (24.2%) 108 (27.1%) 246 (30.8%) Atherosclerosis 113 (28.3%) 490 (23.8%) 113 (28.3%) 216 (27.1%) Small artery disease 95 (23.8%) 379 (18.4%) 95 (23.8%) 126 (15.8%)
Others 83 (20.8%) 689 (33.5%) 83 (20.8%) 210 (26.3%) Fasting glucose (mg/dL) 125.6±30.9 122.1±29.7 0.036 125.6±30.9 123.6±32.6 0.332 Glycated hemoglobin (%) 5.7±0.3 5.7±0.3 0.209 5.7±0.3 5.6±0.3 0.211
Urine protein positivity 41 (15.0%) 133 (10.9%) 0.055 41 (15.0%) 62 (12.6%) 0.348
Fibrinogen (mg/dL) 350.3±110.2 340.6±123.1 0.160 350.3±110.2 352.0±152.4 0.850 ESR (mm) 15.6±13.9 15.7±14.8 0.956 15.6±13.9 16.8±15.7 0.196 CRP (mg/dL) 0.7±1.8 0.6±2.0 0.324 0.7±1.8 0.8±2.4 0.777 Metabolic syndrome 139 (34.8%) 686 (33.4%) 0.573 139 (34.8%) 265 (33.2%) 0.574 Lipid panel T.chol (mg/dL) 179.5±41.3 177.8±38.9 0.416 179.5±41.3 173.6±38.4 0.015 LDL (mg/dL) 108.2±37.4 105.5±34.4 0.193 108.2±37.4 102.8±34.3 0.015
TG (mg/dL) 127.4±123.3 131.8±106.9 0.474 127.4±123.3 125.5±94.9 0.780
END, Early neurological deterioration; NIHSS, National Institutes of Health Stroke Scale; TOAST, Trial of Org 10172 in Acute Stroke Treatment; ESR, Erythrocyte Sedimentation Rate; CRP, C-Reactive Protein; T.chol, Total Cholesterol; LDL, Low Density Lipoprotein; HDL, High Density Lipoprotein; TG, Triglyceride.
Table 6. A logistic regression model to validate association between fibrinogen levels and END after propensity score matching in non-diabetic population.
Odds ratio (95% confidence interval) P
Age 0.99 (0.98 – 1.00) 0.102 Male sex 0.91 (0.69– 1.21) 0.528 Hypertension 1.02 (0.78 – 1.34) 0.870 Initial NIHSS 1.030 (1.01 – 1.05) 0.017 TOAST 0.004 Cardioembolism Reference Atherosclerosis 1.10 (0.77 – 1.60) 0.606
Small artery disease 1.82 (1.20 – 2.75) 0.005
Others 0.89 (0.61 – 1.31) 0.566
Total cholesterol level 1.00 (1.00 –1.01) 0.054
Fibrinogen per 300 mg/dl 0.393
0 – 300 mg/dL Reference
300 – 600 mg/dL 1.05 (0.80 – 1.39) 0.706
> 600 mg/dL 0.56 (0.21 – 1.43) 0.554
NIHSS, National Institutes of Health Stroke Scale; TOAST, Trial of Org 10172 in Acute Stroke Treatment.
IV. DISCUSSION
Using propensity score matching and multiple logistic regression analysis, we have found that hyperfibrinogenemia in patients with acute stroke and DM is associated with END. The influence of hyperfibrinogenemia on END was consistent in the DM subgroup, but it did not hold true in the non-DM subgroup.
High fibrinogen levels itself can directly induce higher frequency of END in diabetic individuals via activation of the coagulation cascade. The formation of fibrin clots from fibrinogen is the final common stage of both the extrinsic and intrinsic pathways (Herrick et al., 1999). Growth of atherosclerotic lesions is also initiated in part by fibrin deposition (Forsyth et al., 2001; Tousoulis et al., 2011). Fibrinogen also promotes platelet aggregation by binding to the glycoprotein IIb/IIIa receptor and increasing its reactivity (Schneider et al., 1999).
An indirect understanding of this phenomenon is that hyperfibrinogenemia may also reflect thrombotic conditions induced by hyperinsulinemia and prolonged glycation. Fibrinogen levels in diabetic individuals are known to correlate with insulin resistance and metabolic syndrome (Meigs et al., 2000). Prolonged glycation also induces a thrombogenic state. Studies on fibrin clot structure under diabetic conditions have shown that fibrinogen is glycosylated in vivo (Hammer et al., 1989), causing a change in clot structure, reducing permeability (Brownlee et al., 1983), reducing fibrinolysis (Bobbink et al., 1997), and reducing α-chain crosslinking (Lutjens et al., 1988). Thus, insulin resistance and prolonged glycation increase the risk of thrombosis and supports the development of vascular disease (Grant, 2007). These studies lead us to assume that fibrinogen levels may represent a marker of platelet aggregation or progression to a prothrombotic phenotype in patients with diabetes (Grant, 2007).
This is the first study that shows association between diabetic hyperfibrinogenemia and a higher frequency of END after ischemic stroke. Elevated
fibrinogen levels are strongly and independently correlated with risk of coronary arterial disease, stroke, and peripheral arterial disease in epidemiological studies (Wilhelmsen et al., 1984; Qizilbash et al., 1991; Ernst, 1993; Lee et al., 1993; Danesh et al., 2005). In stroke, carotid artery stenosis is associated with elevated fibrinogen levels (Kofoed et al., 2003), and the Stroke Treatment with Ancrod Trial (STAT) and European Stroke Treatment with Ancrod Trial (ESTAT) has shown that stroke onset plasma fibrinogen levels are associated with poor functional outcome (del Zoppo et al., 2009). However, no previous report has proven that diabetic hyperfibrinogenemia is associated with END in acute stroke.
For patients with diabetes and hyperfibrinogenemia following acute ischemic stroke, more potent antiplatelet therapy may be considered. Elevated fibrinogen concentrations in our diabetic patients may be related to antiplatelet resistance, resulting in END. In the Japanese Primary Prevention of Atherosclerosis with Aspirin for Diabetes (JPAD) trial (Ogawa et al., 2008), and the Prevention of Progression of Arterial Disease and Diabetes (POPAPAD) trial (Belch et al., 2008), it has been shown that aspirin monotherapy for prevention of cardiovascular events in diabetic patients is less effective. Furthermore, recent data indicate that responses to clopidogrel in diabetic patients are suboptimal (Hall et al., 2011). Accordingly, diabetes may be associated with considerable resistance to aspirin and clopidogrel therapy, and it could be an underlying causal factor for the frequent END observed. Recent studies evaluating platelet aggregation properties in acute coronary syndrome have shown that antiplatelet drug resistance is significantly associated with metabolic syndrome and fibrinogen levels and high sensitivity CRP were higher in this population. Serum fibrinogen levels showed a strong association with drug resistance (Paul et al., 2013). Taking such results into consideration, diabetic patients with elevated fibrinogen levels may need stronger choices for antiplatelet therapy.
defibrase, based on the idea that reducing fibrin may reduce blood viscosity, improve blood flow, and help remove the blood clot blocking the artery and re-establish blood flow (Hao et al., 2012). In eight trials of 5701 patients in total, fibrin-depleting agents slightly reduced the proportion of patients who died or were disabled, and reduced stroke recurrences compared to the control group (Hao et al., 2012). However, symptomatic intracranial hemorrhage were as twice as frequent in the treatment group compared to the control group (Hao et al., 2012). The issue of intracranial hemorrhage is also a major issue diabetic patients with hyperfibrinogenemia. Plasma fibrinogen levels are associated with silent cerebrovascular lesions (Aono et al., 2007), and these are a known risk factor for intracerebral hemorrhage (Neumann-Haefelin et al., 2006). The use of fibrin-depleting agents in DM patients may result in higher risk of hemorrhagic complications. Therefore, although selective use of fibrin-depleting agents in diabetic patients END may be considered, further clinical studies are needed to address such risks.
There are some limitations to our study. First, the retrospective nature of the study may result in selection bias. We hope that maximizing the number of patients included in the study and performing adequate propensity score matching can minimize this issue. Second, a somewhat lengthy temporal definition of END (<7 days) can incorporate a heterogeneous range of underlying mechanisms. Due to the retrospective nature and large number of patients enrolled, the various underlying mechanisms could not be addressed. Third, medications and imaging variables such as intracranial occlusion, stenosis, or diffusion weighted image volume were not included for analysis. However, variables such as TOAST classification, and NIHSS scores were included, and the large patient numbers included may supplement such limitations. We hope we can address such issues in later studies.
In conclusion, admission hyperfibrinogenemia in diabetic patients with acute ischemic stroke is independently associated with END. An elevated fibrinogen
level is can be marker of a prothrombotic condition or antiplatelet-resistance related to DM which may affect patient prognosis. On the other hand, such patients may be a subpopulation wherein fibrin-depleting therapy may be effective.
PART II. Reperfusion
Varying Levels of Hyperglycemia Adversely Affect
Clinicoradiographic Outcomes After Endovascular
I. INTRODUCTION
In patients with stroke, presenting hyperglycemia and diabetes mellitus (DM) predict poor outcome after intravenous (IV) thrombolysis (Poppe et al., 2009). They are also independently associated with early neurological deterioration after thrombolysis (Davalos et al., 1999) as well as increased intracerebral hemorrhage (ICH) (Lansberg et al., 2007). The mechanisms underlying these associations are mainly studied in rodent models of ischemia reperfusion injury (Kruyt et al., 2010). In contrast, reperfusion status could not be well validated in previous IV thrombolysis studies. Such discrepancy has created a gap between laboratory research findings and clinical research. However, recent major randomized controlled trials have determined endovascular treatment (EVT) as standard therapy (Berkhemer et al., 2015; Campbell et al., 2015; Goyal et al., 2015; Jovin et al., 2015; Saver et al., 2015), and reported reperfusion rates range from 59% to as high as 88% (Berkhemer et al., 2015; Campbell et al., 2015; Goyal et al., 2015; Jovin et al., 2015; Saver et al., 2015), readdressing importance of ischemia reperfusion injury in clinical settings.
Another obstacle to discriminating the effects of hyperglycemia and DM is that there is difficulty in defining the respective effects of the two conditions in patient outcomes. Furthermore, the phenomenon of stress hyperglycemia occurs in severe stroke or cardiac disease in the absence of DM. To address this issue, we have made an effort to approximate the most appropriate cut-off values for the classifications of normoglycemia, moderate (or non-diabetic) hyperglycemia, and overt (or diabetic) hyperglycemia using the ASIAN KR registry. The ASIAN KR registry enrolled patients with acute ischemic stroke in whom EVT was performed with modern devices and techniques at three comprehensive stroke centers in Korea (Lee et al., 2018).
independently affect clinical outcome, infarct growth, and hemorrhagic conversion in patients with acute large artery occlusion with successful reperfusion expected. We classified patients into normoglycemic, moderately hyperglycemic, and overtly hyperglycemic groups, and evaluated the differences in clinical outcomes, diffusion-weighted imaging (DWI) infarct growth, and development of post-procedural parenchymal hematoma type 2 according to glycemic groups.
II. METHODS
A. Patient enrollment
The ASIAN KR registry, which includes data from 720 patients, is intended for observational studies of consecutive patients over the age of 18 who received EVT for treatment of acute ischemic stroke. Patient data from the ASIAN KR registry was collected from January 2011 to May 2016 at three Korean stroke centers (Lee et al., 2018). All clinical data were de-identified and allocated study identification numbers. The protocol was approved by the Institutional Review Board of each participating hospital in accordance with the ethical standards of the 1964 Declaration of Helsinki and its later amendments. Written informed consent was waived due to the retrospective nature of the study.
For this study we applied the following criteria: (1) acute occlusion of the intracranial large artery in the anterior circulation; (2) onset-to-puncture time less than 720 min, and (3) both pre-procedural and post-procedural DWI volumes were obtained within 1 week of onset of stroke. Pre-procedural brain computed tomography (CT) or magnetic resonance imaging (MRI) with angiographic data was performed upon admission. Post-procedural CT or MRI was usually obtained within 5 to 7 daysof admission.
B. Evaluations
Premorbid modified Rankin Scale (mRS) scores, admission National Institutes of Health Stroke Scale (NIHSS) scores, and 3 month mRS scores were analyzed. A 3-month mRS score of 0–2 or no change compared with the premorbid mRS score was classified as a good outcome and a 3-month mRS score of 3–6 was classified as poor. Routine laboratory results were also collected. Core laboratory imaging analyses was performed after de-identification and blinding of clinical data by stroke neurologists, neuroradiologists, and neurointerventionists to ensure consistent grading and eliminate possible bias. The location of the initial large vessel occlusion was identified on baseline angiography (SJL). Internal carotid artery (ICA) T, ICA I, middle cerebral artery (MCA) M1, and MCA M2 superior and inferior divisions were included in this study. ICA T was defined as an occlusive lesion in both M1 and ICA including or excluding the A1 segments. ICA I was defined as an occlusive intracranial lesion of the ICA sparing M1 and A1 (Liebeskind et al., 2015). Alberta Stroke Program Early CT scores (ASPECTS) were classified on non-contrast CT (SIS). Successful reperfusion was defined as modified Treatment In Cerebral Ischemia (mTICI) grade 2b–3 (JSL, YHH) (Tomsick et al., 2008). Post-procedural hemorrhagic complications were classified according to the European Cooperative Acute Stroke Study (Fiorelli et al., 1999) criteria. Subarachnoid hemorrhage (SAH) was classified by modified Fisher scale (SIS) (Frontera et al., 2006). Parenchymal hematoma type 2 or grade 3–4 subarachnoid hemorrhage, or both were regarded as serious procedural hemorrhagic complications. Pre-procedural and post-procedural DWI stroke volumes were evaluated (by JWC) using NordicICE semi-automated software (NordicNeuroLab, Bergen, Norway).
C. Procedures
The type of EVT procedure was decided by the treating physician. Direct aspiration and stent retrieval were used in most cases (Roth et al., 2010; Kang et al., 2011; Nogueira et al., 2012; Saver et al., 2012). Balloon guide catheters, intracranial or extracranial angioplasty, and/or stenting were used as needed.
D. Grouping of presenting hyperglycemia and definition of DM
Glucose levels were routinely measured at hospitalization, and glycated hemoglobin (HbA1C) was measured according to the protocol of each stroke center.
As assessed by literature reviews and preliminary analysis, glycemic subgroup on presentation was trichotomized into normoglycemia (≤110 mg/dL) (Capes et al., 2001), moderate hyperglycemia (>110 mg/dL and ≤170 mg/dL), or overt hyperglycemia (>170 mg/dL) (Bruno et al., 2004). Comorbid DM was defined as a previous diagnosis of DM, or an HbA1c on admission of >6.5%.
E. Statistical analysis
Comparative analyses of the glycemic subgroups groups were conducted for clinical characteristics, imaging, and treatment outcomes. Differences between the three groups were analyzed using the χ2 test for categorical variables or analysis of
variance for continuous variables. To evaluate the effect of glycemic subgroups on patient outcome, logistic regression analysis was performed adjusting for age, sex, premorbid mRS score, initial NIHSS score, IV tissue plasminogen activator (tPA) treatment, pre-procedural DWI volume, onset-to-puncture time, site of occlusion, final successful reperfusion, and serious post-procedural hemorrhagic complications. Infarct growth (post-procedure DWI volume – pre-procedure DWI volume, mL) was first directly compared between the glycemic groups. Second, an analysis of covariance was performed comparing post-procedural DWI volumes between normoglycemic and hyperglycemic (>110 mg/dL) patients while controlling for age, sex, pre-procedural DWI volume, site of occlusion, and final reperfusion. Finally, to evaluate hemorrhagic complications, a logistic regression analysis was performed for association between glycemic subgroups and occurrence of parenchymal hematoma type 2 adjusted for age, sex, initial NIHSS score, IV tPA treatment, pre-procedure DWI volume, onset-to-puncture time, and site of occlusion. For subgroup analyses, the variables were evaluated in the reperfusion (successful) group (post-procedural mTICI 2b – 3) and non-reperfusion (unsuccessful) group (mTICI 0 – 2a) for association between glucose levels and treatment outcomes, post-procedural infarct volume and occurrence of parenchymal hematoma type 2, respectively. The data are presented as the mean ± standard deviation or as the median (interquartile range). A p-value < 0.05 was considered statistically significant. All statistical analyses were performed using IBM SPSS Statistics version 22 software (IBM Corp., Armonk, NY, USA).
III. RESULTS
A. Baseline characteristics stratified according to presenting glycemic subgroups
Among the 720 patients in the registry, 341 met the inclusion criteria for this study. One hundred and ten patients presented with normoglycemia, 180 with moderate hyperglycemia, and 51 with overt hyperglycemia. Clinical features, pretreatment factors, reperfusion procedures, and outcomes according to glucose status at admission are shown in Table 1. While a statistically significant difference in glucose levels was seen across the trichotomized groups by definition, the presence of comorbid DM was significantly increased only in the group with overt hyperglycemia (10.0% and 18.9% vs. 86.3%, respectively; p < 0.001). HbA1c levels
showed similar trends (5.7% ± 0.5% and 5.9% ± 0.6% vs. 8.1% ± 1.9%, respectively; p < 0.001). Initial NIHSS scores did not vary between the groups (15.0 [11.00–18.25] vs. 16.0 [12.0–20.0] vs. 16.0 [13.0–20.0], respectively; p = 0.084). White blood cell count, and erythrocyte sedimentation rate on admission were elevated significantly in hyperglycemia groups.
Table 1. Baseline characteristics and pretreatment factors according to glycemic subgroups on presentation. Normoglycemia (n=110) Moderate hyperglycemia (n=180) Overt hyperglycemia (n=51) p-value Clinical characteristics Age, years 65.8 ± 14.5 68.5 ± 11.4 66.5 ± 11.7 0.190 Male sex 67 (60.9%) 99 (55.0%) 27 (52.9%) 0.523 Hypertension 61 (55.5%) 113 (62.8%) 33 (64.7%) 0.380 Diabetes mellitus 11 (10.0%) 34 (18.9%) 44 (86.3%) < 0.001 Atrial fibrillation 49 (44.5%) 101 (56.1%) 23 (45.1%) 0.110 Smoking 29 (26.4%) 42 (23.3%) 13 (25.5%) 0.835 Premorbid mRS 0.0 [0.0–0.0] 0.0 [0.0–0.0] 0.0 [0.0–0.0] 0.445 Admission NIHSS score 15.0 [11.00–18.25] 16.0 [12.0–20.0] 16.0 [13.0–20.0] 0.084 Laboratory data Glucose (mg/dL) 98.6 ± 9.1 130.3 ± 14.6 236.2 ± 61.9 < 0.001* HbA1c (%) 5.7 ± 0.5 5.9 ± 0.6 8.1 ± 1.9 <0.001† Hemoglobin 13.4 ± 1.9 13.6 ± 1.7 13.4 ± 2.0 0.761 WBC 7.8 ± 2.3 8.6 ± 3.0 8.1 ± 2.8 0.038‡ Platelet 223.4 ± 70.8 223.2 ± 77.0 225.4 ± 60.3 0.983 ESR (mg/dL) 12.4 ± 11.8 12.8 ± 13.4 20.2 ± 18.3 0.001* Pre-procedural imaging factors Intracranial occlusion 0.182 ICA T 36 (32.7%) 50 (27.8%) 8 (15.7%) ICA I 7 (6.4%) 12 (6.7%) 3 (5.9%) MCA M1 55 (50.0%) 102 (56.7%) 36 (70.6%) MCA M2 superior 5 (4.5%) 10 (5.6%) 0 (0.0%) MCA M2 inferior 7 (6.4%) 6 (3.3%) 4 (7.8%) ASPECTS 8.0 [5.0–9.0] 7.0 [5.0–9.0] 7.0 [5.0–9.0] 0.892 Pre-procedural DWI volume (mL) 23.5 ± 29.1 23.0 ± 30.9 23.5 ± 33.9 0.990 Onset to pre-procedural MRI (min) 225 ± 159 234 ± 143 247 ± 171 0.694
*Normoglycemia vs. moderate hyperglycemia vs. overt hyperglycemia, p < 0.05, Bonferroni post-hoc test; †normoglycemia/moderate hyperglycemia vs. overt hyperglycemia, p < 0.05, Bonferroni
post-hoc test; ‡normoglycemia vs. moderate hyperglycemia, p<0.05, Bonferroni post-hoc test. HbA1c,
glycated hemoglobin; mRS, modified Rankin Scale; IQR, interquartile range; NIHSS, National Institutes of Health Stroke Scale; SBP, systolic blood pressure; DBP, diastolic blood pressure; MBP, mean blood pressure; WBC, white blood cell; ESR, erythrocyte sedimentation rate; ICA, internal carotid artery; MCA, middle cerebral artery; ASPECTS, Alberta Stroke Program Early CT score; DWI, diffusion-weighted imaging.
B. Reperfusion treatment and outcomes
The initial occlusion site, ASPECTS, and pre-procedural DWI infarct volumes did not differ between the three groups. Onset to pre-procedural MRI, onset-to-puncture time, procedure time, and onset to post-procedural MRI also did not differ between the three groups.
With respect to reperfusion methods and outcomes (Table 2), IV tPA infusion was more common in the normoglycemia and moderate hyperglycemia groups than in the overt hyperglycemia group (66.4% and 60.6% vs. 39.2%, respectively; p = 0.004). With regard to EVT, there was no significant difference in use of the stent retrieval method and the direct aspiration method between the three groups. There was also no significant difference in the success rate of reperfusion between the three groups.
In the moderate and overt hyperglycemia groups, poor outcomes at 3 months were significantly more common than in the normoglycemia group (42.2% and 45.1% vs. 25.5%, respectively; p = 0.007). In the logistic regression model for poor outcome (Table 3), both moderate hyperglycemia (odds ratio [OR] 2.37, 95% confidence interval [CI] 1.26–4.45, p = 0.007) and overt hyperglycemia (OR 2.84, 95% CI 1.19– 6.81, p = 0.019) were independent predictors of a poor outcome (normoglycemia as reference), suggesting a cut-off admission glucose value of >110 mg/dL for a poor prognosis. When logistic regression analysis was performed based on reperfusion status, this association was seen in the non-reperfusion group (n = 69) but not in the reperfusion group (n = 272).
Table 2. Reperfusion treatment and outcomes according to glycemic subgroup. Normoglycemia (n=110) Moderate hyperglycemia (n=180) Overt hyperglycemia (n=51) p-value Reperfusion treatment IV tPA infusion 73 (66.4%) 109 (60.6%) 20 (39.2%) 0.004 Onset-to-puncture time (min) 286 ± 165 298 ± 145 307 ± 173 0.680 Procedure time (min) 71.1 ± 39.2 69.9 ± 40.0 67.5 ± 45.9 0.874 Successful reperfusion 84 (76.4%) 146 (81.1%) 42 (82.4%) 0.548 Outcomes Hemorrhagic transformation 0.045 No hemorrhage 86 (78.2%) 132 (73.3%) 30 (58.8%) HI type 1 11 (10.0%) 15 (8.3%) 3 (5.9%) HI type 2 4 (3.6%) 18 (10.0%) 8 (15.7%) PH type 1 6 (5.5%) 10 (5.6%) 5 (9.8%) PH type 2 3 (2.7%) 5 (2.8%) 5 (9.8%) Post-procedural DWI volume (mL) 49.1 ± 53.5 64.0 ± 77.8 71.5 ± 93.5 0.126 Onset to
post-procedural MRI (min) 6109 ± 2462 6218 ± 2478 5865 ± 2404 0.662 Infarct growth (mL) 25.6 ± 40.8 41.0 ± 65.3 48.0 ± 79.4 0.045* 3-month mRS 3–6 28 (25.5%) 76 (42.2%) 23 (45.1%) 0.007 The data are presented as the mean ± standard deviation, or number (%). *Normoglycemia vs. moderate hyperglycemia, p = 0.114; normoglycemia vs. overt hyperglycemia, p = 0.095, Bonferroni post-hoc test. IV tPA, intravenous tissue plasminogen activator; DWI, diffusion-weighted imaging; HI, hemorrhagic infarct; PH, parenchymal hematoma.
Table 3. Logistic regression model of hyperglycemia as a risk factor for a poor outcomes according to reperfusion Status after endovascular revascularization therapy.
Overall (n = 341) Reperfusion subgroup (n = 272) Non-reperfusion subgroup (n = 69) OR (95% CI) p-value OR (95% CI) p-value OR (95% CI) p-value Age 1.05 (1.03–1.08) < 0.001 1.05 (1.02–1.08) 0.001 1.07 (1.01–1.14) 0.030 Sex 0.94 (0.55–1.62) 0.826 0.92 (0.49–1.71) 0.793 1.43 (0.36–5.73) 0.616 Premorbid mRS score 0.083 0.126 0.598
mRS0 Reference Reference Reference
mRS1 2.37 (1.05–5.35) 0.039 2.40 (0.94–6.14) 0.068 4.72 (0.50–44.61) 0.176 mRS2 4.53 (1.13–18.18) 0.033 4.69 (1.08–20.44) 0.040 - 0.999 mRS3 1.13 (0.23–5.58) 0.879 1.81 (0.29–11.21) 0.525 0.47 (0.01–21.22) 0.700 mRS4 2.12 (0.06–78.41) 0.684 2.43 (0.07–89.64) 0.629
Admission NIHSS score 1.12 (1.06–1.19) < 0.001 1.12 (1.05–1.20) 0.001 1.19 (1.01–1.39) 0.035 IV tPA 1.134 (0.58–2.22) 0.714 1.14 (0.52–2.50) 0.735 1.49 (0.22–10.15) 0.682 Baseline intracranial
occlusion 0.917 0.775 0.904
ICA T Reference Reference Reference
ICA I 1.01 (0.33–3.09) 0.993 0.88 (0.27–2.95) 0.840 3.68 (0.03–503.34) 0.604 MCA M1 1.00 (0.54–1.88) 0.990 0.92 (0.45–1.87) 0.822 0.84 (0.16–4.46) 0.835
MCA M2 superior 0.54 (0.12–2.32) 0.403 0.29 (0.05–1.94) 0.203 1.20 (0.22–6.44) 0.999 MCA M2 inferior 1.28 (0.36–4.62) 0.706 1.21 (0.27–5.44) 0.804 - 0.471 Pre-treatment DWI volume 1.02 (1.01–1.03) 0.002 1.02 (1.01–1.03) 0.002 1.00 (0.98–1.02) 0.704 Onset to puncture 1.00 (1.00–1.00) 0.044 1.00 (1.00–1.01) 0.025 1.00 (1.00–1.01) 0.604 Final mTICI 2b–3 0.24 (0.12–0.46) < 0.001
PH2 or SAH 3–4 8.25 (2.15–31.66) 0.002 3.97 (0.88–17.89) 0.073 - 0.999
Glucose level 0.014 0.171 0.007
Normoglycemia Reference Reference Reference
Moderate hyperglycemia 2.37 (1.26–4.45) 0.007 1.86 (0.90–3.82) 0.094 10.99 (2.15–56.25) 0.016 Overt hyperglycemia 2.84 (1.19–6.81) 0.019 2.24 (0.83–6.02) 0.112 35.5 (1.93–653.02) 0.002
OR, odds ratio; CI, confidence interval; mRS, modified Rankin Scale; NIHSS, National Institutes of Health Stroke Scale; IV tPA, intravenous tissue plasminogen activator; ICA, internal carotid artery; MCA, middle cerebral artery; DWI, diffusion-weighted imaging; mTICI, modified Treatment In Cerebral Ischemia; PH2, parenchymal hematoma type 2; SAH, subarachnoid hemorrhage.
C. Infarct growth
When infarct growth was compared according to admission glycemic subgroups, a significant intergroup difference was found (25.6 ± 40.8 mL vs. 41.0 ± 65.3 mL vs. 48.0 ± 79.4 mL, respectively; p = 0.045). When patients were dichotomized into normoglycemia and hyperglycemia groups (cut-off glucose level, 110 mg/dL), post-procedural infarct volume was significantly greater in the hyperglycemia group (49.1 ± 53.5 mL vs. 65.6 ± 81.4 mL, respectively; padjusted =
0.003) while pre-procedural volumes did not significantly differ (23.5 ± 29.1 mL vs. 23.1 ± 31.5 mL, p = 0.913). Similar to clinical outcomes, this difference was significant in the non-reperfusion group (normoglycemia vs. hyperglycemia; 54.0 ± 58.2 mL vs. 126.0 ± 109.5 mL, padjusted = 0.005), but not for the reperfusion groups
(normoglycemia vs. hyperglycemia; 47.6 ± 52.2 mL vs. 51.9 ± 66.5 mL, padjusted =
Fig 1. Changes in pre & post-procedure cerebral infarct volume According to hyperglycemia present on admission. (A) Total population, (B) reperfusion
subgroup, and (C) non-reperfusion subgroup. Post-procedural infarct volumes were compared using analysis of covariance, adjusting for pre-procedural DWI volume, age, sex, site of occlusion, and successful reperfusion.; DWI, diffusion-weighted imaging
D. Hemorrhagic complications
Increase in hemorrhagic complications were mainly associated with overt hyperglycemia (p = 0.045) (Table 2). When glycemic subgroup was incorporated into a logistic regression model for occurrence of parenchymal hematoma type 2 (Table 4), only overt hyperglycemia showed an independent association (OR 9.28, CI 1.66–51.88, p = 0.011) referenced by normoglycemia. In a subgroup analysis according to reperfusion status, overt hyperglycemia was associated with parenchymal hematoma type 2 only in the reperfusion group (OR 12.34, CI 1.60– 95.07, p = 0.016) as referenced to normoglycemia, but the association was insignificant in the non-reperfusion group. Overt hyperglycemia was also confirmed to be as an independent predictor of parenchymal hematoma type 1–2 (OR 3.75, CI 1.25–11.23, p = 0.018), and any type of hemorrhagic transformation (OR 3.10, CI 1.39–6.92, p = 0.006) with adjustment of the same covariables.
Table 4. Logistic regression model of hyperglycemia as a risk factor for parenchymal hematoma type 2 according to reperfusion status after endovascular revascularization therapy.
Overall (n = 341) Reperfusion subgroup (n = 272) Non-reperfusion subgroup (n = 69) OR (95% CI) p-value OR (95% CI) p-value OR (95% CI) p-value Age 0.99 (0.94–1.04) 0.670 1.00 (0.93–1.04) 0.542 - 1.000 Sex 1.89 (0.51–6.98) 0.342 1.30 (0.33–5.08) 0.702 - 1.000 Admission NIHSS score 1.04 (0.92–1.17) 0.583 1.03 (0.90–1.19) 0.634 - 1.000 IV tPA 0.93 (0.21–4.11) 0.926 1.22 (0.24–6.33) 0.810 - 0.999 Baseline intracranial
occlusion 0.048 0.111 1.000
ICA T Reference Reference Reference
ICA I 0.00 (0.00) 0.998 0.00 (0.00) 0.998 - 1.000 MCA M1 0.15 (0.03–0.66) 0.012 0.09 (0.02–0.52) 0.007 - 1.000 MCA M2 superior 3.66 (0.60–22.21) 0.159 1.42 (0.14–14.36) 0.768 - 0.999 MCA M2 inferior 0.00 (0.00) 0.998 0.00 (0.00) 0.999 - 1.000 Pre-procedure DWI volume 1.01 (1.00–1.03) 0.126 1.01 (1.00–1.03) 0.130 - 1.000 Onset to puncture 1.00 (1.00–1.01) 0.730 1.00 (1.00–1.01) 0.300 - 0.999 Final mTICI 2b–3 1.52 (0.28–8.14) 0.624 Glucose level 0.009 0.025 1.000
Overt hyperglycemia 9.28 (1.66–51.88) 0.011 12.34 (1.60–95.07) 0.016 - 1.000 OR, odds ratio; CI, confidence interval; NIHSS, National Institutes of Health Stroke Scale; IV tPA, intravenous tissue plasminogen activator; ICA, internal carotid artery; MCA, middle cerebral artery; DWI, diffusion-weighted imaging; mTICI, modified Treatment In Cerebral Ischemia.
IV. DISCUSSION
The present study demonstrates that hyperglycemia at hospitalization are independently associated with poor outcomes, infarct growth, and hemorrhagic complications; furthermore, the glucose level cut-off points to predict these results varied. Overall, hyperglycemia was associated with a poor functional outcome and infarct growth, while overt hyperglycemia was associated with hemorrhagic complications. In the non-reperfusion subgroup, the association between hyperglycemia and infarct growth was dominant, while the association between overt hyperglycemia and hemorrhagic complications were dominant in the reperfusion subgroup. The comorbidity of DM was 10% in the normoglycemia group, 18% in the moderate hyperglycemia group, and 80% in the overt hyperglycemia group. A similar trend was seen for mean HbA1c levels, suggesting that overt hyperglycemia
on presentation may be representative of sustained hyperglycemia, while moderate levels of hyperglycemia might be more representative of hyperglycemia under non-diabetic or pre-non-diabetic conditions.
Post-procedural infarct volumes were significantly larger in the moderate and overt hyperglycemia groups than in the normoglycemia group, and both groups were independently associated with poor outcome. This corresponds to a relatively low cut-off glucose level of >110mg/dL. While infarct growth seems to be a mediator between hyperglycemia and a poor outcome, there was no correlation between admission glucose and infarct growth nor an interaction between glucose level and infarct growth in terms of poor outcomes (data not shown). This suggests that such associations may not be linear, and an approach using cut-off values may better represent the phenomenon. The significance of glucose levels as an independent predictor for outcomes and infarct growth disappeared in multivariable analysis when patients with successful reperfusion were analyzed, whereas both significant associations were still present in patients with unsuccessful reperfusion. This finding
implies that successful reperfusion may overcome the negative effects of hyperglycemia. This observation is partly supported by analysis of MR CLEAN data, which showed no interaction of hyperglycemia and EVT effect when compared with non-endovascular treatment, indicating that admission hyperglycemia is not a contraindication for EVT (Osei et al., 2017).
Several mechanisms via which moderate hyperglycemia leads to poor outcomes and infarct growth can be postulated. First, possibility is the concept of stress hyperglycemia. Meta-analyses demonstrate a strong correlation between glucose levels > 110 to 126 mg/dL and poor outcomes only in non-diabetic patients with acute ischemic stroke (Capes et al., 2001). Glucose levels are known to increase with increasing stroke severity via activation of the hypothalamic-pituitary-adrenal axis (Feibel et al., 1977; O'Neill et al., 1991). Second, direct contribution of hyperglycemia itself in aggravation of ischemic stroke needs to be considered. Decreased reperfusion and penumbral salvage are associated with hyperglycemia, resulting in infarct growth (Venables et al., 1985; Kruyt et al., 2010). Further, hyperglycemia results in reduced penumbral salvage in patients with perfusion-diffusion mismatch (Kagansky et al., 2001; Parsons et al., 2002). A third mechanism worth discussing is that presenting hyperglycemia may represent pre-existing abnormalities in glucose metabolism. Significant number of ischemic stroke patients without history of DM have impaired glucose metabolism, insulin resistance, or DM at follow-up (Kernan et al., 2005; Vancheri et al., 2005). Thus presenting hyperglycemia may reflect insulin resistance and comprise the metabolic syndrome, known to be associated with poor leptomeningeal collateral status in acute ischemic stroke (Menon et al., 2013). However, pre-diabetic conditions were not addressed in this study, and further studies are needed to address this issue.
In the present study, overt hyperglycemia, or diabetic levels of hyperglycemia, was associated with severe intracerebral hemorrhage, particularly in
the reperfusion subgroup. The results suggest that reperfusion injury can be exacerbated by chronic sustained hyperglycemia. The association between DM and ICH in patients with ischemic stroke after IV thrombolysis is well recognized (Demchuk et al., 1999). However, IV tPA was not associated with the clinical outcomes in our endovascular population. In endovascular populations, associations between sustained hyperglycemia or DM and hemorrhagic transformation have been recently reported; however, in one study, the endovascular devices and methods used were somewhat outdated (Nogueira et al., 2015), and in another study using stent retrievers, the significance for hyperglycemia was not shown, but DM was confirmed to be significant (Jiang et al., 2015). Oxidative stress and activation of inflammation are reported to be aggravated in overt hyperglycemia, resulting in dysfunction of the blood-brain barrier (Bouchard et al., 2002; Kamada et al., 2007; Martini and Kent, 2007). Moreover, severe hyperglycemia significantly worsens cortical intracellular acidosis and results in mitochondrial dysfunction in the ischemic penumbra (Anderson et al., 1999). Such mechanisms can lead to hemorrhagic transformation and extensive hemorrhage (de Courten-Myers et al., 1992). Elevated erythrocyte sedimentation rates were seen in patients with overt hyperglycemia in our study, which may indicate such inflammatory reactions.
In terms of glucose cut-off values, a previous large-scale study of patients who received IV tPA yielded results similar to those of the present study. The Safe Implementation of Treatment in Stroke International Stroke Thrombolysis Register (SITS-ISTR), involving over 16,000 acute ischemic stroke patients treated with thrombolysis, show that glucose levels > 120 mg/dL were associated with increased mortality, while levels > 180 mg/dL were associated with symptomatic ICH (Ahmed
et al., 2010). The ORs for mortality and functional dependence were significantly
higher for glucose levels > 120 mg/dL in non-diabetic patients, while the values for mortality and functional independence were 181–200 mg/dL and 160 mg/dL,
higher in both diabetic and non-diabetic patients with glucose levels of 181–200 mg/dL compared with that for patients who had lower glucose levels (Ahmed et al., 2010). These results and our present findings both provide similar ranges of dual glucose cut-off values, and the lower value is associated with poor outcome and the higher value is associated with hemorrhagic complications. Our present research further reveals that higher glucose cut-off values may be associated with sustained hyperglycemia and comorbid DM.
There are limitations to the present study. First, although our analysis includes multicenter data, it is limited by the observational study design. Nonetheless, the population was medium-sized and presented with acceptable revascularization profiles. Second, the retrospective study design precluded the use of symptomatic ICH as an endpoint, more widely used in EVT trials. However, parenchymal hematoma type 2, used in the current study as a hemorrhagic outcome is strongly associated with clinical deterioration (Berger et al., 2001). Third, patients were only included when both pre-procedural and post-procedural MRI data were available. Post-procedural MRI data were not available for patients with severe pathology or for those who expired, resulting in selection bias. Nevertheless, the analysis of infarct growth through both pre-procedural and short-term post-procedural DWI is not easy to perform in clinical studies, and we believe that this data has a novel value. Finally, the management of hyperglycemia might have differed between hospitals and attending physicians. Management of hyperglycemia is another unresolved issue, and therapeutic trials such as the Stroke Hyperglycemia Insulin Network Effort (SHINE) currently focus in resolving such issues (Bruno et al., 2014).
In conclusion, in Korean patients with acute intracranial large artery occlusion who underwent EVT, moderate to overt hyperglycemia on admission was associated with a poor outcome and infarct growth in the total population and those who did not achieve successful reperfusion. Additionally, overt hyperglycemia was
associated with significant hemorrhagic complications in the total population, and patients with successful reperfusion. These findings should be confirmed in future large-scale prospective cohorts.