R E S E A R C H
Open Access
Effects of high fat diet-induced obesity on
vitamin D metabolism and tissue
distribution in vitamin D deficient or
supplemented mice
Chan Yoon Park
1, Yongho Shin
2, Jeong-Han Kim
2, Shuang Zhu
1, Young Sun Jung
1and Sung Nim Han
1,3*Abstract
Background: Vitamin D deficiency has been often observed in obese persons. One of the mechanisms suggested for low vitamin D status in obesity was decreased bioavailability of vitamin D (VD) due to sequestration in adipose tissue. However, only few studies have investigated this mechanism via quantifying vitamin D levels from tissues from the obese.
Methods: Six-wk-old C57BL/6 mice were fed 10 or 45% kcal fat (CON or HFD) diets containing 50, 1000 or 25,000 IU vitamin D3/kg diet (LVd, CVd or HVd) for 13 wks. Serum 25-hydroxyvitamin D (25(OH)D) levels were determined by radioimmunoassay and liver and adipose tissue cholecalciferol (VD3) and 25-hydrocholecalciferol (25(OH)D3) levels were measured by LC-MS/MS. mRNA levels of jejunal Mttp, Cd36, Sr-b1, Npc1l1, and Abca1 and liver and adipose tissue 25-hydroxylases (Cyp2r1 and Cyp27a1) were determined by real-time PCR.
Results: Serum 25(OH)D levels were affected by dietary vitamin D content but differential effects were observed between HFD and CON groups. When vitamin D intake was at a supplementary level, the HFD-HVd group had lower serum 25(OH)D levels than the CON-HVd group, while there was no significant difference between the HFD and CON groups fed LVd or CVd. Total amount of VD3in liver and adipose tissue were significantly higher in HFD-HVd group compared with the CON-HFD-HVd group. However, no difference in total amount of tissue VD3was observed between the CON and HFD groups fed CVd. In jejunum, mRNA levels of Mttp and Abca1 were significantly higher in HFD groups than CON groups. There was no difference in mRNA levels of liver 25-hydroxylases by both dietary fat amount and vitamin D content.
Conclusion: A significant amount of VD3seemed to be stored in the liver and adipose tissue when dietary vitamin D is at a supplementation level; thus excess body adiposity could contribute to relatively low serum 25(OH)D level when vitamin D was supplemented.
Keywords: Vitamin D supplementation, Obesity, Tissue vitamin D, 25-hydroxyvitamin D, Vitamin D absorption
© The Author(s). 2020 Open Access This article is licensed under a Creative Commons Attribution 4.0 International License, which permits use, sharing, adaptation, distribution and reproduction in any medium or format, as long as you give appropriate credit to the original author(s) and the source, provide a link to the Creative Commons licence, and indicate if changes were made. The images or other third party material in this article are included in the article's Creative Commons licence, unless indicated otherwise in a credit line to the material. If material is not included in the article's Creative Commons licence and your intended use is not permitted by statutory regulation or exceeds the permitted use, you will need to obtain permission directly from the copyright holder. To view a copy of this licence, visithttp://creativecommons.org/licenses/by/4.0/. The Creative Commons Public Domain Dedication waiver (http://creativecommons.org/publicdomain/zero/1.0/) applies to the data made available in this article, unless otherwise stated in a credit line to the data.
* Correspondence:snhan@snu.ac.kr
1
Department of Food and Nutrition, College of Human Ecology, Seoul National University, 1 Gwanak-ro, Gwanak-gu, Seoul, South Korea
3Research Institute of Human Ecology, Seoul National University, Seoul, South
Korea
Background
Vitamin D (VD) insufficiency (serum 25-hydroxyvitamin D (25(OH)D) levels lower than 30 ng/mL) is highly prevalent worldwide and it has been estimated that more than 30–50% of the populations in Europe and the US, and more than 50% in East Asia are VD insufficient or deficient [1–3]. Low serum 25(OH)D levels have been observed in obese persons and circulating 25(OH)D levels correlated inversely with body mass index and body fat mass [4–6]. It has been reported that the preva-lence of VD deficiency was 35% higher in obese persons and 24% higher in overweight persons compared with non-obese persons [7]. Although several mechanisms such as low ultraviolet B (UVB) exposure of obese people and VD sequestration or dilution into adipose tissue have been proposed for the higher prevalence of VD deficiency among the obese, the causes of their low 25(OH)D levels are still inconclusive.
Early studies on adipose tissue using animals or humans supplemented with14C-radiolabeled cholecalcif-erol (VD3) followed by measuring the radioactivity have shown that VD and its metabolites are stored in adipose tissue [8, 9]. Wortsman et al. [10] observed that serum 25(OH)D levels increased more in a non-obese group compared with an obese group when they were on ex-posure to UVB or when VD supplements were given to them. Thus, it has been suggested that adiposity could lead to the decreased bioavailability of VD due to VD sequestration in body fat. Furthermore, Drincic et al. [6] proposed volumetric dilution (VD distributed over a larger body size) as the reason for low serum 25(OH)D concentration in the obese. An inverse association be-tween serum 25(OH)D levels and body fat mass using the hyperbolic fit model (the mathematical expression of dilution) was used for explaining low VD status associ-ated with obesity. Although VD sequestration or volu-metric dilution might explain the VD deficiency observed in the obese, few studies have directly demon-strated these hypotheses by quantifying VD levels in adi-pose tissue and comparing VD levels between obese and non-obese subjects due to the difficulty in measuring fat-soluble VD from small quantities of fat tissue [11– 13]. In human studies, it is difficult to control for the variables related to VD synthesis in the skin, such as UVB exposure time, usage of sunblock, season, and age. Therefore, environmentally controllable animal studies are needed to provide evidence for how obesity affects the storage of VD in soft tissues and VD metabolism.
VD is fat-soluble and is usually absorbed with dietary fat by passive diffusion in proximal jejunum and distal ileum [14]. Dietary VD is packaged into chylomicrons with triglycerides, cholesterol, and other lipids within the intestine wall, and this process is dependent on microsomal triglyceride transfer protein (MTP) [15–17].
VD contained in chylomicron is secreted into lymphatic system and some of them are taken into adipose tissue and liver during chylomicron hydrolysis by lipoprotein lipase (LPL). Fat intake could influence the absorption of dietary VD in the small intestine and the impact of the fat amount in a meal on serum VD status has been in-vestigated in several studies, although the results remain inconclusive. Raimundo et al. [18] reported that a single oral intake of 50,000 IU VD3 with a high-fat meal con-taining 25.6 g fat/meal resulted in a significant increase in serum 25(OH)D levels after 14 days, while there was no significant change in 25(OH)D levels when VD was taken with a low-fat meal (1.7 g fat/meal). Dawson-Hughes et al. [19] observed that plasma VD3level at 12 h after taking 50,000 IU VD3tablet with a low-fat meal (10% kcal, 11.1 g total fat) was 20% higher when com-pared with the plasma VD3levels after VD3 taken with no meal or a high-fat meal (50% kcal, 35.2 g total fat). Recent studies have suggested the possibility of VD ab-sorption through protein-mediated diffusion by choles-terol transporter proteins such as scavenger receptor class B type 1 (SR-B1), cluster of differentiation 36 (CD36), and Niemann-Pick C1-Like 1 (NPC1L1) and their expression levels could be affected by obesity or the amount of fat intake [20,21]. Therefore, in addition to adiposity, dietary fat amount and the expression of transporter proteins involved in VD absorption should be considered for the circulatory 25(OH)D response to VD intake.
The objective of this study was to investigate whether obesity affects VD metabolism and tissue dis-tribution when dietary VD was at deficient or supple-mentation levels. To achieve this purpose, circulatory and tissue levels of vitamin D and expression of genes involved in vitamin D absorption and metabolism were determined in obese and control mice fed different levels of vitamin D.
Methods
Animals and diets
Six-week-old C57BL/6 male mice (Central Animal Laboratory, Seoul, Korea) were housed in the specific-pathogen-free animal facility at Seoul National Univer-sity with environmentally controlled temperature (23 ± 1 °C), relative humidity (50 ± 10%), and a 12-h light/12-h dark cycle. After 5 d of acclimation with the control diet, the mice were assigned to 6 groups and fed control (10% kcal fat, CON) or high-fat (45% kcal fat, HFD) diets containing three different levels of VD3 [low (50 IU/kg diet, LVd), control (1000 IU/kg diet, CVd), or high (25, 000 IU/kg diet, HVd)] ad libitum for 13 wk. (CON-LVd, #119320; CON-CVd, #103816; CON-HVd, #119321; HFD-LVd, #119318; HFD-CVd, #103818; HFD-HVd, #119319; Dyets, Inc., Bethlehem, PA, USA) (See
additional file1: Table S1). Food intake was measured 4 times per week and body weight was recorded weekly. Food intake in mice was measured by providing known amount of food and subtracting the weight of remaining food. At the end of the 13th week, the animals were fasted for 12 h and two animals from each group were anesthetized with 1.5 g/ kg urethane (intraperitoneal), then scanned with a Hologic Discovery DEXA instru-ment (Hologic, Toronto, ON, Canada). After 12 h of fasting, all mice were euthanized by CO2 asphyxiation.
Blood, liver, small intestine (duodenum, jejunum, and ileum), kidney, and adipose tissue were collected, weighed, and stored at− 80 °C until analyzed.
Determination of liver triacylglycerol (TG) levels
Lipid was extracted from the liver according to the method by Folch et al. [22], then liver TG levels were determined using a commercial kit (Asan pharmaceut-ical, Seoul, Korea) based on an enzymatic assay.
Determination of serum 25(OH)D levels
Serum 25(OH)D levels were measured via a radio-immunoassay (RIA) using commercial RIA kit (DiaSorin, Stillwater, MN, USA) according to the manufacturer’s instructions. The radioactivity was measured with an automatic gamma counter (2470 Wizard2, Perkin Elmer, Shelton, CT, USA).
Determination of vitamin D3and 25(OH)D3levels in liver and adipose tissue
Chemicals and reagents
VD3, 25(OH)D3, isotopically labeled 6, 19, 19 [d3]-VD3, d3–25(OH)D3, methyl tert-butyl ether (MTBE), formic acid (LC-MS grade), and ammonium formate (≥99.0%) were purchased from Sigma-Aldrich (St. Louis, MO, USA). Methanol, ethanol, and acetonitrile (AcN) were liquid chromatography/mass spectrometry (LC/MS)-grade and purchased from Fisher Scientific (Pittsburgh, PA, USA). Ultra-pure water was prepared with LaboS-tar™ TWF UV 7 (Siemens, MA, USA).
Sample preparation and PTAD derivatization
VD3 and 25(OH)D3 were analyzed from liver and adi-pose tissue using a modification of the original method by Lipkie et al. [12]. Quality control (QC) samples used for the external standard curve were prepared from the adipose tissue and liver of 22-week-old C57BL6 mice fed a VD-deficient diet (50 IU VD3/kg diet). Detailed procedure is described in additional file [Additional file 1- Method].
LC-MS/MS analysis
A Shimadzu LCMS-8040 triple quadrupole mass spec-trometer with a Shimadzu Nexara X
ultra-high-performance liquid chromatography (UHPLC; Kyoto, Japan) system was used for the separation of PTAD-derivatized VD3 and 25(OH)D3. In the UHPLC system, a Kinetex® C18 column (100 × 2.1 mm, 2.6μm, Phenom-enex, Torrance, CA, USA) with a SecurityGuard™ Ultra guard column (Phenomenex) was used to separate each target analyte peak. The oven temperature was 40 °C. Mobile phase A was 0.1% formic acid and 5 mM methyl-amine in water and B was 0.1% formic acid in methanol, and the flow rate was 0.2 mL/min. The gradient for B was started with 20% total volume and 30 s later, %B was raised to 70% for 0.5 min, ramped to 99% for 17.5 min, and held for 3 min. Next, %B was dropped sharply to 20% for 0.5 min and held for 5 min. The total run time was 27 min. The injection volume was 5μL.
In the MS system, electrospray (ESI)-positive mode was used for the ionization of the target compounds. The nebulizing and drying gas (nitrogen) flows were 3 and 15 L/min, respectively. The desolvation line and heat block temperature were 250 and 400 °C, respectively. The collision-induced dissociation gas was argon. Sched-uled multiple reaction monitoring (MRM) was used for each analyte, and its detection window and dwell time were ± 1 min and 10 ms, respectively. LCMS software (version 5.60, LabSolutions) was used for data processing.
Validation of vitamin D3and 25(OH)D3quantification method
To validate the accuracy of the method, liver or adipose tissue was homogenized in PBS to 33% (w/w) solutions. 10μL of internal standard (a mixture of d3-VD3 and d3–25(OH)D3, 1μg/ mL) was added to 400 μL of hom-ogenate, then spiked with 10μL of 2, 10, or 100 ng/ mL of d3-VD3 and d3–25(OH)D3 mixture in AcN (final spiked levels: 1.5, 7.5, or 75 ng/g tissue). The endogenous VD3 level was determined from the sample with only the internal standard added. Accuracy was evaluated with 3 samples, repeated over 3 days, by the following equation: (mean of measured value/QC sample value) × 100%.
Within-day precision was determined by analyzing the same liver and epididymal fat homogenates three separ-ate times in 1 day. Between-day precision was deter-mined by analyzing the same QC sample on 3 different days. Precision was determined as the relative coefficient of variation (%CV): (standard deviation/mean) × 100%.
RNA extraction and real time PCR
Total RNA was extracted using Trizol reagent (Invitro-gen, Carlsbad, CA, USA). The quality of the RNA sample was determined using agarose gel electrophoresis with the Gel Doc XR system (Bio-Rad Laboratories, Hercules, CA, USA), and the absorbance at 260 and 280
nm with a nano-spectrophotometer (NANO-200, BIOAND Co., Gyeonggi, Korea). cDNA was synthesized using a PrimeScript™II 1st strand cDNA synthesis kit (Takara Bio., Shiga, Japan) with a thermal cycler (Ap-plied Biosystems, Foster City, CA, USA). mRNA levels of cytochrome P450 2R1 (Cyp2r1), cytochrome P450 27A1 (Cyp27a1), low density lipoprotein receptor-related pro-tein 1 (Lrp1), and VD binding propro-tein (Dbp) in the liver, lipoprotein lipase (Lpl) in the adipose tissue, microsomal triglyceride transfer protein (Mttp), cluster of differen-tiation 36 (Cd36), scavenger receptor class B member 1 (Sr-b1), Niemann-Pick C1-Like 1 (Npc1l1), and ATP-binding cassette transporter (Abca1) in the jejunum were determined using real-time PCR with SYBR Premix Ex Taq (Takara bio.) and StepOne Real-time PCR System (Applied Biosystems). All values were normalized to the levels of Gapdh and expressed as relative mRNA level compared to the average level of the CON-CVd group. The sequences of primers used in this study are presented in Additional file1: Table S2.
Statistical analyses
All data were analyzed using SPSS statistical software version 23.0 (IBM SPSS Statistics, Chicago, IL, USA). Normality in distribution was determined based on the results of a Shapiro-Wilk test and Q-Q plot. For data not following the normal distribution (Sr-b1 and Lpl), square root transformation was done for statistical ana-lysis. To evaluate the overall effects of dietary fat amount and VD content, and their interaction, comparisons were made by two-way ANOVAs. Further individual compari-sons among groups were done by Fisher’s least signifi-cant difference post hoc test. For analyses of correlations between serum 25(OH)D level (dependent variable) and other factors, Pearson’s correlation was used to
determine the association between parameters. All data are presented as means ± SEMs and P < 0.05 was consi-dered as statistically significant.
Results
Body weight, adipose tissue and liver weights, food intake, and liver TG levels
There was no significant difference in body weight at week 0 among the groups. The HFD groups had 38.7% higher body weight (P < 0.001) and 107.4% higher white adipose tissue weight (P < 0.001) com-pared with the CON groups. Overall, there was no statistically significant effect of dietary VD content on body weight and adipose tissue weight (Table 1), and the average daily food intake (g/day) was not affected by dietary VD content or fat amount. Based on the VD content of the experimental diets and daily food intake (g/day), the actual daily VD intake (IU/day) calculated was 0.15, 2.8, or 71.3 IU/day in the CON groups (LVd, CVd, or HVd, respectively) and 0.18, 3.7, or 82.5 IU/day in the HFD groups (LVd, CVd, or HVd, respectively). Liver weight per body weight (g/ 100 g body weight) and liver TG levels were signifi-cantly higher in the HFD groups than the CON groups. Overall, VD content in the diet did not affect the liver weight or liver TG levels.
Serum 25(OH)D concentration
Overall, dietary VD content had a significant effect (P < 0.001) on serum 25(OH)D levels (Fig.1). The aver-age values of serum 25(OH)D were 10.8 ng/mL in LVd group, 26.7 ng/mL in CVd group, and 74.9 ng/mL in HVd group. An increase in dietary VD content resulted in higher serum 25(OH)D levels in both the CON and HFD groups; however, the 25(OH)D levels showed
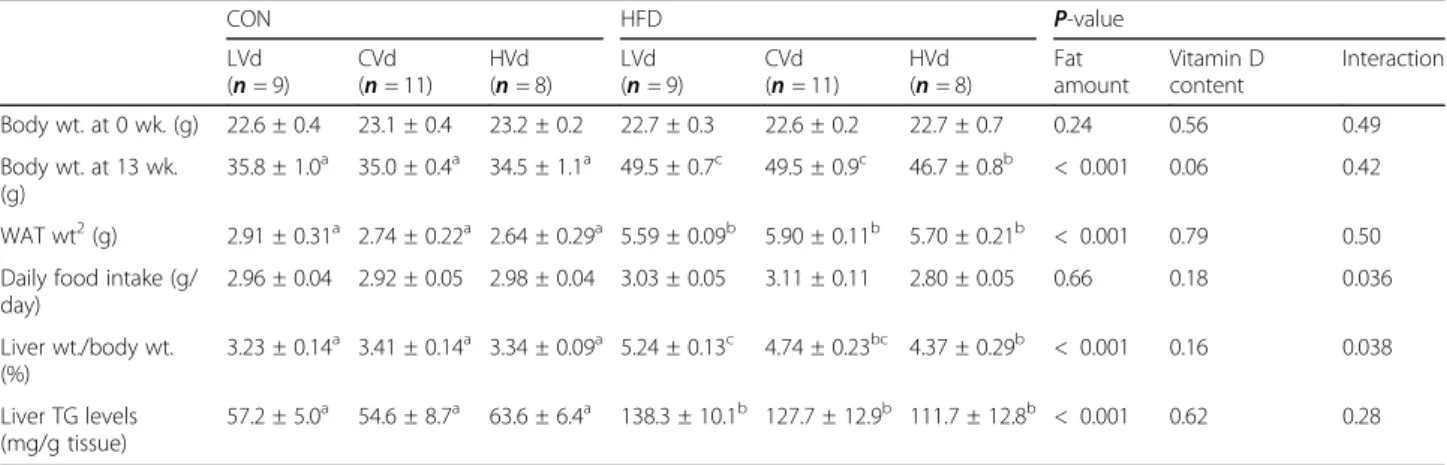
Table 1 Body weight (wt.), white adipose tissue (WAT) wt., dietary intake, liver wt., and liver TG levels in the CON and HFD groups fed different levels of vitamin D1
CON HFD P-value LVd (n = 9) CVd (n = 11) HVd (n = 8) LVd (n = 9) CVd (n = 11) HVd (n = 8) Fat amount Vitamin D content Interaction Body wt. at 0 wk. (g) 22.6 ± 0.4 23.1 ± 0.4 23.2 ± 0.2 22.7 ± 0.3 22.6 ± 0.2 22.7 ± 0.7 0.24 0.56 0.49 Body wt. at 13 wk. (g) 35.8 ± 1.0a 35.0 ± 0.4a 34.5 ± 1.1a 49.5 ± 0.7c 49.5 ± 0.9c 46.7 ± 0.8b < 0.001 0.06 0.42 WAT wt2(g) 2.91 ± 0.31a 2.74 ± 0.22a 2.64 ± 0.29a 5.59 ± 0.09b 5.90 ± 0.11b 5.70 ± 0.21b < 0.001 0.79 0.50 Daily food intake (g/
day) 2.96 ± 0.04 2.92 ± 0.05 2.98 ± 0.04 3.03 ± 0.05 3.11 ± 0.11 2.80 ± 0.05 0.66 0.18 0.036 Liver wt./body wt. (%) 3.23 ± 0.14a 3.41 ± 0.14a 3.34 ± 0.09a 5.24 ± 0.13c 4.74 ± 0.23bc 4.37 ± 0.29b < 0.001 0.16 0.038 Liver TG levels (mg/g tissue) 57.2 ± 5.0a 54.6 ± 8.7a 63.6 ± 6.4a 138.3 ± 10.1b 127.7 ± 12.9b 111.7 ± 12.8b < 0.001 0.62 0.28 1
Two-way ANOVA was used to determine the significant effects of fat amount and vitamin D content, and an interaction.ab
Different superscripts indicate significant difference (P < 0.05) by Fisher’s LSD multiple comparison test. Data are presented as means ± SEMs.2
White adipose tissue weight included epididymal, subcutaneous, retroperitoneum, and perinephric fats. CON 10% kcal fat diet, HFD 45% kcal fat diet; LVd Low vitamin D, CVd Control vitamin D, HVd High vitamin D
different patterns between the two depending on the dietary VD content (interaction, P < 0.001). In the LVd groups, the serum 25(OH)D level tended to be higher in the HFD-LVd group compared with the CON-LVd group (P = 0.05, 76.6% higher). On the other hand, when the VD level in the diet was at a supplementary level, the HFD-HVd group had significantly lower serum 25(OH)D level than the CON-HVd group (P < 0.001, 19.7% lower), in spite of higher daily VD intake in HFD-HVd group (82.5 IU/day) compared with the CON-HFD-HVd group (71.3 IU/day). Serum 25(OH)D levels in HVd group negatively correlated with body weight (g) and white adipose tissue (g) (r = − 0.762, P < 0.01; r = − 0.833, P < 0.01, respectively). With the control level of dietary VD (in the CVd groups), there was no significant differ-ence in the serum 25(OH)D concentration between the CON-CVd and HFD-CVd groups.
The mRNA levels of genes involved in vitamin D absorption in small intestine
The expression levels of cholesterol transporter genes (Cd36, Sr-b1, Npc1l1, and Abca1) and Mttp in the je-junum were determined to investigate the effects of diet-ary VD content or fat amount on VD absorption in the small intestine (Fig. 2A). Among the cholesterol trans-porter genes, the mRNA levels of Abca1 in the jejunum were significantly higher and Cd36 mRNA levels tended to be higher (P = 0.08) in the HFD groups compared with the CON groups, but the mRNA levels of Sr-b1 were significantly lower. The expression levels of Mttp (essential for the assembly of apolipoproteins and lipid
into chylomicrons) in the jejunum were higher in the HFD groups than the CON groups (P = 0.002). Dietary VD content did not affect the expression of genes involved in VD absorption.
The mRNA levels of genes involved in vitamin D transport
The expression of genes involved in the chylomicron hy-drolysis and VD transport was determined. mRNA levels of epididymal Lpl were significantly lower in the HFD groups than the CON groups, while dietary VD content had no effect on epididymal Lpl expression levels. mRNA levels of liver Lrp1 and Dbp were not signifi-cantly affected by either dietary fat amount or VD contents (Fig.2B).
Liver and adipose tissue vitamin D3and 25(OH)D3levels Optimization of analytical instrument condition and method validation
For the PTAD-derivatized target compounds (VD3, d3 -VD3, 25(OH)D3, and d3–25(OH)D3), a full scan analysis was conducted in which both of them were ionized with protons ([M + H]+) in ESI-positive mode. Those in ionization form were selected as the precursor ions, and a product ion scan was performed with various collision energy levels to select the quantifier ions by considering sensitivity and selectivity. MRM transitions and reten-tion time (tR) for PTAD-VD3, PTAD-25(OH)D3, and
their internal standards are given in an Additional file1: Table S3. Using the matrix-matched standard, the limits of quantitation (LOQs) of VD3and 25(OH)D3were de-termined with a signal-to-noise ratio≥ 10 for each peak in the chromatogram. The LOQs of VD3and 25(OH)D3 Fig. 1 Serum 25(OH)D levels (ng/mL). Data are presented as means ± SEMs, n = 6 for each group. Two-way ANOVA was used to determine the significant effects of dietary fat amount and vitamin D content, and an interaction.abDifferent superscripts indicate significant difference (P < 0.05) by Fisher’s LSD multiple comparison test. CON: 10% kcal fat diet; HFD: 45% kcal fat diet; LVd: Low vitamin D; CVd: Control vitamin D; HVd: High vitamin D
in the liver and adipose tissue samples were 1 ng/mL. The linear ranges for the samples were 1~1000 ng/mL and cor-relation coefficients (r2) were determined for the linearity of the calibration curve; r2for both liver and adipose tissue was≥0.990.
The accuracy determined from the levels of three spikes (1.5, 7.5, and 75 ng/g tissue) was 96 ~ 103% and 97 ~ 107% in adipose tissue and 96 ~ 107% and 96 ~ 103% in liver tissue for VD3 and 25(OH)D3, re-spectively (Additional file 1: Table S4). The precision (within-day and between-day) of VD3 and 25(OH)D3
from liver and adipose tissue is shown in Table S5 in the Additional file 1.
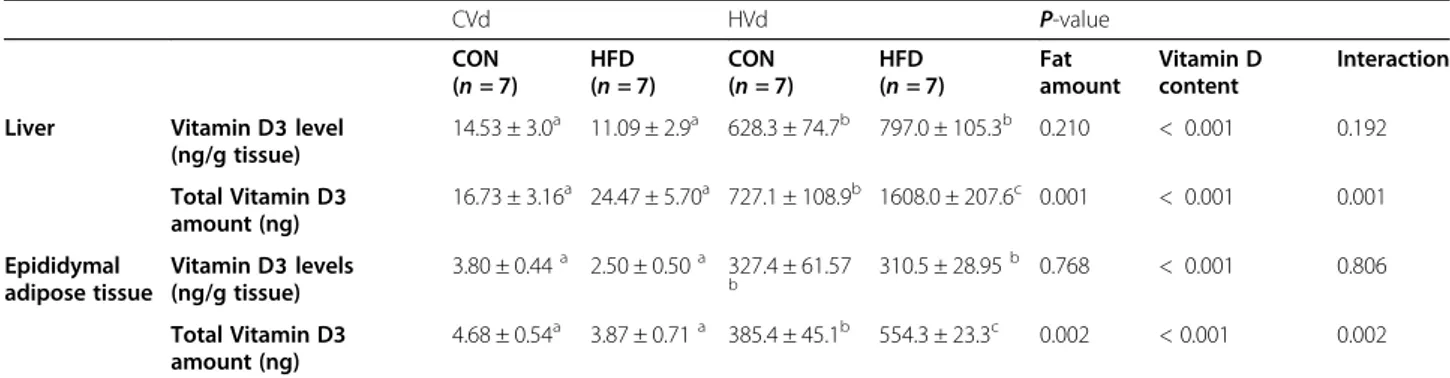
Concentration and total amount of vitamin D3in liver and epididymal adipose tissue
VD3concentration (ng/g tissue) and total amount (ng) in liver and epididymal adipose tissue are reported in Table2. In the liver and adipose tissue, VD3levels were under the LOQ in the LVd groups but were 43 and 85 times higher, respectively, in the CON-HVd group compared with the CON-CVd group and 72 and 124 times higher, respect-ively, in the HFD-HVd group compared to the HFD-CVd group. The dietary fat amount did not have a significant effect on VD3level per weight in liver and adipose tissue, but its effect on the total amount in the tissue was different depending on the dietary VD content.
Fig. 2 The mRNA levels of genes involved in (A) vitamin D absorption in jejunum and (B) vitamin D transport in epididymal adipose tissue and liver. Data are presented as means ± SEMs, n = 6 ~ 8 for each group. Two-way ANOVA was used to determine the significant effects of dietary fat amount and vitamin D content, and an interaction.abDifferent superscripts indicate significant difference (P < 0.05) by Fisher’s LSD multiple comparison test. CON: 10% kcal fat diet; HFD: 45% kcal fat diet; LVd: Low vitamin D; CVd:Control vitamin D; HVd: High vitamin D, Cd36, cluster of differentiation 36; Sr-b1, Scavenger receptor class B type1; Npc1l1, Niemann-Pick C1-Like 1; Abca1, ATP-binding cassette transporter A1; Mttp, Microsomal triglyceride transfer protein; Lpl, lipoprotein lipase; Lrp1, Low density lipoprotein receptor-related protein 1; Dbp, vitamin D binding protein
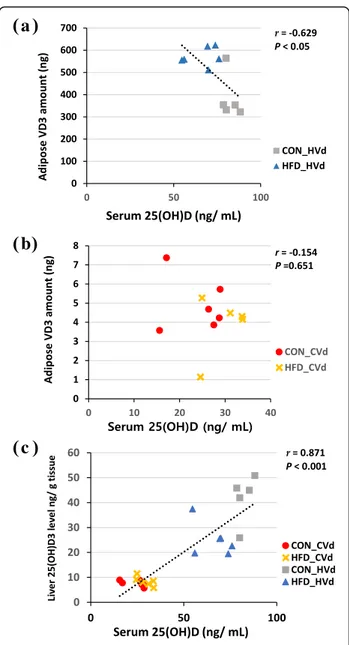
For the total VD3amount in liver and adipose tissue, there was a significant interaction between the dietary fat amount and VD content (P < 0.01). In the HVd groups, the total amount of VD3in the liver and adipose tissue were significantly higher in the HFD-HVd group (121 and 44%, respectively) compared with the CON-HVd group. The total amount of VD3(g) in adipose tissue in HVd groups showed negative correlation with serum 25(OH)D levels (ng/ mL) (r = − 0.629, P < 0.05) (Fig.3a). However, when mice were fed the control level of VD (the CVd groups), dietary fat content did not affect the VD3 amount in liver and adipose tissue. In CVd groups, no significant correlation between the total adipose tissue VD3 amount (g) and serum 25(OH)D (ng/mL) was observed (Fig.3b).
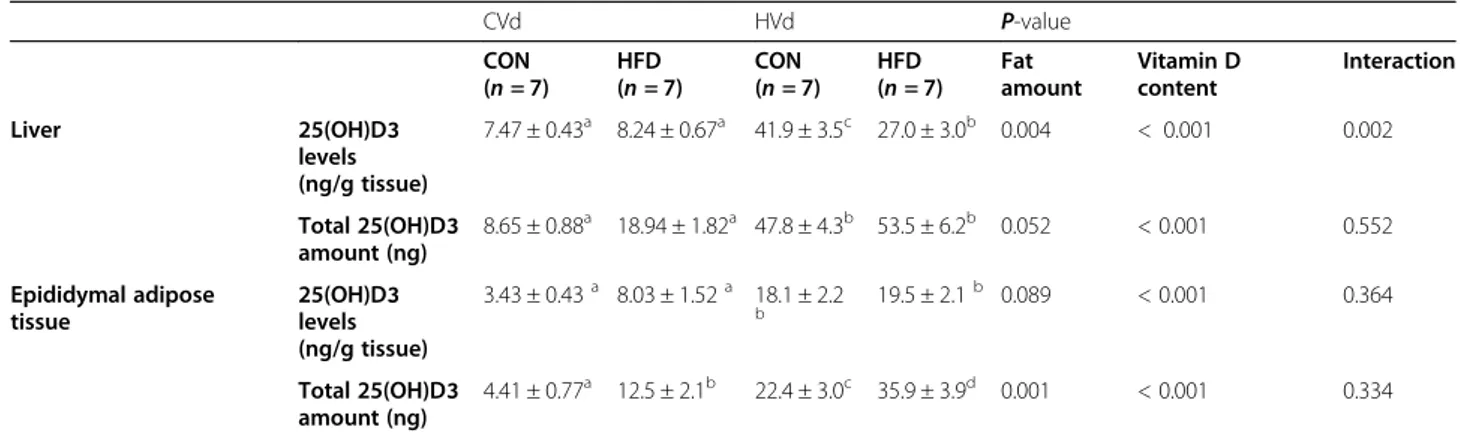
Concentration and total amount of 25(OH)D3in liver and epididymal adipose tissue
The 25(OH)D3 concentration (ng/g tissue) and total amount (ng) in liver and adipose tissue are summarized in Table3. Liver and adipose tissue 25(OH)D3 concen-trations in the LVd groups were < 1 ng/g tissue but were 5.6 times higher in the liver in the CON-HVd group compared to the CON-CVd group (P < 0.05), and 3.3 times higher in HVd group than in HFD-CVd group. There was an interaction between the dietary fat amount and VD content regarding liver 25(OH)D3 levels: the level was significantly lower in the HFD-HVd group compared with the CON-HVd group, which was not observed in the CVd groups. Liver 25(OH)D3 levels (ng/g tissue) correlated posi-tively with serum 25(OH)D levels (ng/mL) (r = 0.871, P < 0.001) (Fig. 3c). In epididymal adipose tissue, 25(OH)D3concentration was higher in the HVd groups compared with the CVd groups (P < 0.05). The dietary fat amount had no significant influence on adipose tissue 25(OH)D3concentration.
The mRNA levels of 25-hydroxylases in liver and epididymal adipose tissue
Neither dietary fat amount nor dietary VD content had a significant impact on liver mRNA levels of Cyp2r1 and Cyp27a1 (Fig. 4). On the other hand, the mRNA levels of epididymal fat Cyp2r1 was higher (P = 0.026) and epididymal fat Cyp27a1 was lower (P = 0.003) in the HFD groups compared with the CON groups.
Discussion
This study showed that obesity differentially affected serum 25(OH)D levels and the total VD amount in the liver and adipose tissue depending on the levels of VD in the diet. When VD intake was at a supplementary level, high-fat diet-induced obesity resulted in a greater amount of VD3 storage in liver and epididymal adipose tissue compared with the non-obese control, and this could contribute to low serum 25(OH)D levels. How-ever, when VD intake was at a physiological level, there was no significant difference in the serum 25(OH)D levels between the obese and the control mice.
Serum 25(OH)D has a half-life of approximately 15 days and is the best indicator for the nutritional status of VD, and our results confirm a dose-response rela-tionship of serum 25(OH)D and dietary VD levels [23,
24]. When VD content was at 50 IU VD/kg diet (the LVd group), the serum 25(OH)D level was 59% lower than that in the CVd group (1000 IU VD/kg diet; the National Research Council’s nutrient requirement). With a supplementary level of VD (25,000 IU VD/kg diet; the HVd group), the serum 25(OH)D level was 180% higher compared with the CVd group. These re-sults are consistent with many previous studies which have reported a positive correlation between dietary VD intake and circulating 25(OH)D levels in humans [24,25] and rodents [26,27].
The VD levels in liver and adipose tissue correlated positively with dietary VD content. Some previous
Table 2 Vitamin D3levels and total amount in liver and epididymal adipose tissue1,2
CVd HVd P-value CON (n = 7) HFD (n = 7) CON (n = 7) HFD (n = 7) Fat amount Vitamin D content Interaction Liver Vitamin D3 level
(ng/g tissue) 14.53 ± 3.0a 11.09 ± 2.9a 628.3 ± 74.7b 797.0 ± 105.3b 0.210 < 0.001 0.192 Total Vitamin D3 amount (ng) 16.73 ± 3.16a 24.47 ± 5.70a 727.1 ± 108.9b 1608.0 ± 207.6c 0.001 < 0.001 0.001 Epididymal adipose tissue Vitamin D3 levels (ng/g tissue) 3.80 ± 0.44a 2.50 ± 0.50a 327.4 ± 61.57 b 310.5 ± 28.95 b 0.768 < 0.001 0.806 Total Vitamin D3 amount (ng) 4.68 ± 0.54a 3.87 ± 0.71a 385.4 ± 45.1b 554.3 ± 23.3c 0.002 < 0.001 0.002 1
Two-way ANOVA was used to determine the significant effects of fat amount and vitamin D content, and an interaction.ab
Different superscripts indicate significant difference (P < 0.05) by Fisher’s LSD multiple comparison test. Data are presented as means ± SEMs
2
studies have also shown that dietary VD increases tissue VD and 25(OH)D levels in a dose-dependent manner [12, 28]. VD3 levels (ng/g tissue) in the adipose tissue from the CON-HVd and HFD-HVd groups were 85 and 124 times higher than those from the CON-CVd and HFD-CVd groups, while adipose tissue 25(OH)D3 levels (ng/g tissue) were 5.3 and 2.4 times higher, respectively, in CON-HVd and HFD-HVd groups compared with the CON-CVd and HFD-CVd groups. These results indi-cated that supplementary VD is mostly reflected in tissue VD3 levels rather than 25(OH)D levels in serum or tissue. Lipkie et al. [12] reported that VD3 levels in rat liver and adipose tissue were 3.9 and 7.6 ng/g tissue, respectively, and 25(OH)D levels in liver and adipose tis-sue were less than 1 ng/g tistis-sue when rats were fed 740 IU VD3/ kg diet for 8 wk. The VD3 concentrations in pigs fed 2000 IU VD3/day were 2.7 ng/g tissue in liver tissue and 7 ng/g tissue in adipose tissue [29]. VD and 25(OH)D levels from previous studies were similar to the levels observed in the CVd group in this study.
Depending on the dietary VD levels, the fat amount in the diet had differential effects on serum 25(OH)D levels. When dietary VD content was low (LVd groups) or at a control level, dietary fat intake did not affect serum 25(OH)D levels. However, in the HVd group, HFD-HVd group had significantly lower 25(OH)D level compared with CON-HVd group and serum 25(OH)D showed negative correlations with body weight and white adipose tissue weight. Since liver 25-hydroxylase mRNA levels were not different among the groups, the differences in serum 25(OH)D levels could be due to dif-ferences in the amount of absorbed VD, which serves as a substrate for 25(OH)D synthesis in liver. The effects of HFD-induced obesity on serum 25(OH)D levels and liver 25-hydroxylases are not well characterized and still re-main contradictory. When mice were fed HFD with a control level of vitamin D, several studies reported no significant decrease of serum 25(OH)D [30–32] which is consistent with the results from this study, but decreased level of blood 25(OH)D followed by low liver Cyp2r1 mRNA level in female obese mice was also reported [33]. Not only the expression level but also activity and genetic variants of liver Cyp2r1 are important factors in vitamin D metabolism [34,35], therefore, further studies focused on the role of 25-hydroxyases in obesity are needed.
In spite of 16% higher VD intake (IU/g) in HFD-HVd group compared with CON-HVd group, the serum 25(OH)D level was significantly lower (19% lower) in the HFD-HVd group. HFD-HVd group’s total VD3 amount in the liver and epididymal adipose tissue were 121 and 44% higher, respectively, compared with the CON-HVd group. Since epididymal adipose tissue accounts for less than 20% of total body adipose tissue, total body fat
mass was estimated using a DEXA scan data. Average total body fat mass of the HFD-HVd group was 11.6 g and that of the CON-HVd group was 5.2 g [See add-itional file1: Table S6]. By using the epididymal fat VD3
level (ng/g tissue) and total body fat mass, the estimated total adipose tissue VD3 amount was calculated and it was 192% higher in the HFD-HVd group than that in the CON-HVd group (8187 vs. 2799 ng, respectively). These results suggested that obesity could lead to a lar-ger amount of VD stored in the liver and adipose tissue, which could contribute to a low serum 25(OH)D level when VD intake was at a supplementary level. However, only two animals per group were scanned with DEXA,
a
b
c
Fig. 3 Correlations between serum 25(OH)D levels (ng/mL) and adipose tissue vitamin D3 amount in HVd groups (a) and CVd groups (b) and liver 25(OH)D3 levels (ng/g tissue)(c) n = 11 ~ 28, Pearson correlation coefficient, r, and P value are indicated
therefore total adipose tissue VD amount based on DEXA is a rough estimation. The limitation of this study is that subcutaneous fat VD content was not measured. There are mixed results regarding the VD content in the subcutaneous and visceral fat. Carrelli et al. [13] re-ported that VD concentration was higher in omental fat compared with subcutaneous fat in human subjects, while Lawson et al. [36] found that VD in perirenal fat (visceral fat) was lower than in axillary fat (subcutaneous fat). Therefore, further studies are needed for the accur-ate estimation of total adipose tissue VD amount. Never-theless, results from this study shows that more VD is stored in the liver and epididymal adipose tissue due to fatness.
Wortsman et al. [10] also reported that the serum 25(OH)D level was lower in obese persons than non-obese persons after a supplementary high dose of VD (50,000 IU); they assumed that this could be due to VD sequestration in the adipose tissue, however, VD in the tissue was not measured in their study. In this study, by quantifying VD from liver and adipose tissue, it was con-firmed that increased tissue VD amount in obesity could contribute to a lower the serum 25(OH)D level when VD was at a supplementary level. However, contrary to the HVd groups, there was no significant difference in the liver and adipose tissue VD amount between the CON-CVd and HFD-CVd groups. According to Heaney et al. [37], dietary VD is slowly converted to circulating
Table 3 25(OH)D3levels and total amount in liver and epididymal adipose tissue1,2
CVd HVd P-value CON (n = 7) HFD (n = 7) CON (n = 7) HFD (n = 7) Fat amount Vitamin D content Interaction Liver 25(OH)D3 levels (ng/g tissue) 7.47 ± 0.43a 8.24 ± 0.67a 41.9 ± 3.5c 27.0 ± 3.0b 0.004 < 0.001 0.002 Total 25(OH)D3 amount (ng) 8.65 ± 0.88a 18.94 ± 1.82a 47.8 ± 4.3b 53.5 ± 6.2b 0.052 < 0.001 0.552 Epididymal adipose tissue 25(OH)D3 levels (ng/g tissue) 3.43 ± 0.43a 8.03 ± 1.52a 18.1 ± 2.2 b 19.5 ± 2.1 b 0.089 < 0.001 0.364 Total 25(OH)D3 amount (ng) 4.41 ± 0.77a 12.5 ± 2.1b 22.4 ± 3.0c 35.9 ± 3.9d 0.001 < 0.001 0.334 1
Two-way ANOVA was used to determine the significant effects of fat amount and vitamin D content, and an interaction.ab
Different superscripts indicate significant difference (P < 0.05) by Fisher’s LSD multiple comparison test. Data are presented as means ± SEMs.2CON 10% kcal fat diet, HFD 45% kcal fat diet, CVd Control vitamin D, HVd High vitamin D
Fig. 4 The mRNA levels of 25-hydroxylases in liver and epididymal fat tissue. Data are presented as means ± SEMs, n = 6 for each group. Two-way ANOVA was used to determine the significant effects of dietary fat amount and vitamin D content, and an interaction.abDifferent superscripts
indicate significant difference (P < 0.05) by Fisher’s LSD multiple comparison test. CON: 10% kcal fat diet; HFD: 45% kcal fat diet; LVd: Low vitamin D group; CVd: Control vitamin D group; HVd: High vitamin D group. Cyp2r1, cytochrome P450 2R1; Cyp27a1, cytochrome P450 27A1
25(OH)D and VD seemed to be stored in adipose tissue when VD input is high whereas there is rapid conversion of VD to 25(OH)D when VD input is at a physiologic level (a daily input of 2000 IU). Therefore, the results from this study and others suggest that serum 25(OH)D could be lower in the obese due to VD distribution into a larger mass of adipose tissue rather than sequestration, and the rate at which VD is distributed to the blood and adipose tissue could be dependent on dietary VD content.
Contrary to the VD-supplemented groups, animals fed the deficient level of VD (50 IU/kg diet) with HFD tended to have a higher serum 25(OH)D level compared with the CON-LVd group (P = 0.054). The tissue VD levels of the VD-deficient groups could not be deter-mined because of the low levels of VD (under LOQ < 1 ng/g tissue) present in the tissue. Another limitation of this study is that the association between serum 25(OH)D and tissue VD levels could not be determined when dietary VD was at a deficient level. VD is preferen-tially stored in the blood and rapidly converted to 25(OH)D with low VD intake rather than being stored in the body fat [37]. A previous study has also reported that tissue VD or 25(OH)D levels in rats fed 49 IU ergo-calciferol (VD2) for 8 weeks were lower than 2 or 0.5 ng/g tissue, respectively [12]. Therefore, it is possible that most of the absorbed dietary VD was converted to serum 25(OH)D in mice fed a 50 IU VD/kg diet.
Serum 25(OH)D level of HFD-LVd group was 78.2% higher than that of CON-LVd group, although the amount of daily VD intake was 17% higher in the HFD-LVd group compared to the CON-HFD-LVd group. Therefore, tendency of higher serum 25(OH)D level in HFD-LVd group than CON-LVd group could be ascribed to various factors such as adiposity or the fat content of a meal as well as the amount of dietary VD intake. There are two possible mechanisms which could have contributed to this higher VD absorption in HFD-LVd group. First, high fat content in the diet could have increased the absorption of VD. Dietary fat has been reported to stimulate bile acid se-cretion and consequently enhance VD absorption [38]. Higher serum 25(OH)D levels was observed when people took VD with a high-fat meal [18] and it was reported that more VD was absorbed when taken with fat-containing meal than fat-free meal [39]. However, more studies are needed to determine the influence of dietary fat on VD ab-sorption because the effect of fat on VD abab-sorption was not identified in some study [40] and correlation between dietary fat amount and VD absorption was not found [19]. Second, the jejunal mRNA levels of the genes involved in VD absorption and chylomicron formation in small intes-tine were higher in the HFD groups compared with the CON groups. MTP is essential for chylomicron formation and it increases fat absorption at small intestine [15, 41],
and mRNA level of Mttp was significantly higher in HFD group than in CON group, especially HFD-LVd group showed 32% higher levels of Mttp compared with the CON-LVd group. This result is consistent with previous study in which increased Mttp mRNA and protein levels in jejunum of HFD-induced obese animal were observed [42–45], therefore it is suggested that HFD-induced obes-ity could have contributed to the increase in VD absorp-tion by increasing fat absorpabsorp-tion. In addiabsorp-tion, it has been recently reported that VD is absorbed into the intestine not only by passive diffusion but also by cholesterol trans-porter proteins [20, 21]. In this study, mRNA levels of Abca1 were higher, Cd36 tended to be higher, and Sr-b1 were lower in HFD groups compared with CON groups. There is a possibility that obesity could have affected VD absorption through cholesterol transporters. Higher Cd36 mRNA levels been reported in obese mice [45]. It is hard to figure out the effect of changes in Sr-b1 on VD absorp-tion, because SR-B1 has been reported to be involved in both influx and efflux of VD at the intestinal apical mem-brane [20]. Therefore, further studies including protein expression are needed to elucidate the role of each cholesterol transporter in VD transport.
Conclusion
At supplementary level of VD intake, high fat diet-induced obesity resulted in lower serum 25(OH)D levels than the lean control. A significant amount of dietary VD is stored in the liver and adipose tissues when VD is at a supplementary level; thus excess body adiposity could contribute to lower serum 25(OH)D level. Whereas, when VD in the diet is at a control (NRC requirement, 1000 IU/ kg diet) level, there was no significant effect of obesity on tissue VD amount and serum 25(OH)D levels. These finding have expanded our knowledge that dietary VD distribution into the blood and adipose shows differential response to dietary vitamin D intake depending on the adiposity. In addition, there is a possibility that obese sub-jects will have to increase their VD intake when supple-menting VD, if they expect the same effect as non-obese subjects.
Supplementary information
Supplementary information accompanies this paper athttps://doi.org/10. 1186/s12986-020-00463-x.
Additional file 1.
Abbreviations
25(OH)D:25-hydroxyvitamin D; 25(OH)D3: 25-hydroxycholecalciferol; Abca1: ATP-binding cassette transporter; AcN: Acetonitrile; CD36: Cluster of differentiation 36; CON: Control diet; CV: Coefficient of variation; CVd: Control vitamin D; Cyp2r1: Cytochrome P450 2R1; Cyp27a1: Cytochrome P450 27A1; Dbp: Vitamin D binding protein; HFD: High-fat diet; HVd: High vitamin D; LC/ MS: Liquid chromatography/mass spectrometry; LPL: Lipoprotein lipase; LOQ: Limit of quantitation; Lrp1: Low density lipoprotein receptor-related
protein 1; LVd: Low vitamin D; MRM: Multiple reaction monitoring; MTBE: Methyl tert-butyl ether; MTP: Microsomal triglyceride transfer protein; NPC1L1: Niemann-Pick C1-Like 1; QC: Quality control;
RIA: Radioimmunoassay; SR-B1: Scavenger receptor class B type 1; UHPLC: Ultra-high-performance liquid chromatography; UVB: Ultraviolet B; VD: Vitamin D; VD2: Ergocalciferol; VD3: Cholecalciferol
Acknowledgements Not applicable. Authors’ contributions
SNH, CYP and J-HK designed and conceptualized the study; CYP, YSJ, and ZS performed animal experiments and data collection. CYP and YS measured tis-sue vitamin D concentration by LC/MS/MS. CYP and SNH analyzed the data and wrote the paper. The author (s) read and approved the final manuscript. Funding
This research was funded by the grant from National Research Foundation (NRF) of Korea (NRF-2018R1D1A1B070491) and Seoul National University Research Grant by Research Affairs at Seoul National University (350– 20160050).
Availability of data and materials
The datasets during and/or analyzed during the current study available from the corresponding author on reasonable request.
Ethics approval and consent to participate
All animal procedures were approved by the Institutional Animal Care and Use Committee of Seoul National University (approval number SNU-141020-4).
Consent for publication Not applicable. Competing interests
The authors declare that they have no competing interests. Author details
1Department of Food and Nutrition, College of Human Ecology, Seoul
National University, 1 Gwanak-ro, Gwanak-gu, Seoul, South Korea.
2Department of Agricultural Biotechnology, College of Agriculture and Life
Science, Seoul National University, Seoul, South Korea.3Research Institute of
Human Ecology, Seoul National University, Seoul, South Korea.
Received: 27 January 2020 Accepted: 29 May 2020
References
1. Yoshimura N, Muraki S, Oka H, Morita M, Yamada H, Tanaka S, Kawaguchi H, Nakamura K, Akune T. Profiles of vitamin D insufficiency and deficiency in Japanese men and women: association with biological, environmental, and nutritional factors and coexisting disorders: the ROAD study. Osteoporos Int. 2013;24(11):2775–87.
2. Holick MF. Vitamin D status: measurement, interpretation, and clinical application. Ann Epidemiol. 2009;19(2):73–8.
3. Kim SH, Oh MK, Namgung R, Park MJ. Prevalence of 25-hydroxyvitamin D deficiency in Korean adolescents: association with age, season and parental vitamin D status. Public Health Nutr. 2014;17(1):122–30.
4. Gonzalez-Molero I, Rojo-Martinez G, Morcillo S, Gutierrez C, Rubio E, Perez-Valero V, Esteva I, Ruiz de Adana MS, Almaraz MC, Colomo N, et al. Hypovitaminosis D and incidence of obesity: a prospective study. Eur J Clin Nutr. 2013;67(6):680–2.
5. Mai XM, Chen Y, Camargo CA Jr, Langhammer A. Cross-sectional and prospective cohort study of serum 25-hydroxyvitamin D level and obesity in adults: the HUNT study. Am J Epidemiol. 2012;175(10):1029–36.
6. Drincic AT, Armas LA, Van Diest EE, Heaney RP. Volumetric dilution, rather than sequestration best explains the low vitamin D status of obesity. Obesity (Silver Spring, Md). 2012;20(7):1444–8.
7. Pereira-Santos M, Costa PR, Assis AM, Santos CA, Santos DB. Obesity and vitamin D deficiency: a systematic review and meta-analysis. Obes Rev. 2015;16(4):341–9.
8. Holman CA, Mawer EB, Smith DJ. Tissue distribution of cholecalciferol (vitamin D(3)) in the rat. Biochem J. 1970;120(4):29p–30p.
9. Mawer EB, Backhouse J, Holman CA, Lumb GA, Stanbury SW. The distribution and storage of vitamin D and its metabolites in human tissues. Clin Sci. 1972;43(3):413–31.
10. Wortsman J, Matsuoka LY, Chen TC, Lu Z, Holick MF. Decreased bioavailability of vitamin D in obesity. Am J Clin Nutr. 2000;72(3):690–3. 11. Blum M, Dolnikowski G, Seyoum E, Harris SS, Booth SL, Peterson J, Saltzman
E, Dawson-Hughes B. Vitamin D(3) in fat tissue. Endocrine. 2008;33(1):90–4. 12. Lipkie TE, Janasch A, Cooper BR, Hohman EE, Weaver CM, Ferruzzi MG.
Quantification of vitamin D and 25-hydroxyvitamin D in soft tissues by liquid chromatography-tandem mass spectrometry. J Chromatogr B Anal Technol Biomed Life Sci. 2013;932:6–11.
13. Carrelli A, Bucovsky M, Horst R, Cremers S, Zhang C, Bessler M, Schrope B, Evanko J, Blanco J, Silverberg SJ, et al. Vitamin D storage in adipose tissue of obese and Normal weight women. J Bone Miner Res. 2017;32(2):237–42. 14. Del Valle HB, Yaktine AL, Taylor CL, Ross AC. Dietary reference intakes for
calcium and vitamin D: National Academies Press; 2011.
15. Hussain MM, Nijstad N, Franceschini L. Regulation of microsomal triglyceride transfer protein. Clin Lipidol. 2011;6(3):293–303.
16. Compston JE, Merrett AL, Hammett FG, Magill P. Comparison of the appearance of radiolabelled vitamin D3 and 25-hydroxy-vitamin D3 in the chylomicron fraction of plasma after oral administration in man. Clin Sci (Lond). 1981;60(2):241–3.
17. Avioli LV. Absorption and metabolism of vitamin D3 in man. Am J Clin Nutr. 1969;22(4):437–46.
18. Raimundo FV, Faulhaber GA, Menegatti PK, Marques Lda S, Furlanetto TW. Effect of high- versus low-fat meal on serum 25-Hydroxyvitamin D levels after a single Oral dose of vitamin D: a single-blind, parallel, Randomized Trial. Int J Endocrinol. 2011;2011:809069.
19. Dawson-Hughes B, Harris SS, Palermo NJ, Ceglia L, Rasmussen H. Meal conditions affect the absorption of supplemental vitamin D3 but not the plasma 25-hydroxyvitamin D response to supplementation. J Bone Miner Res. 2013;28(8):1778–83.
20. Reboul E, Goncalves A, Comera C, Bott R, Nowicki M, Landrier JF, Jourdheuil-Rahmani D, Dufour C, Collet X, Borel P. Vitamin D intestinal absorption is not a simple passive diffusion: evidences for involvement of cholesterol transporters. Mol Nutr Food Res. 2011;55(5):691–702. 21. Reboul E. Intestinal absorption of vitamin D: from the meal to the
enterocyte. Food Funct. 2015;6(2):356–62.
22. Folch J, Lees M, Sloane Stanley GH. A simple method for the isolation and purification of total lipides from animal tissues. J Biol Chem. 1957;226(1): 497–509.
23. Alshahrani F, Aljohani N. Vitamin D: deficiency, sufficiency and toxicity. Nutrients. 2013;5(9):3605–16.
24. Barger-Lux MJ, Heaney RP, Dowell S, Chen TC, Holick MF. Vitamin D and its major metabolites: serum levels after graded oral dosing in healthy men. Osteoporos Int. 1998;8(3):222–30.
25. Heaney RP, Davies KM, Chen TC, Holick MF, Barger-Lux MJ. Human serum 25-hydroxycholecalciferol response to extended oral dosing with cholecalciferol. Am J Clin Nutr. 2003;77(1):204–10.
26. Fleet JC, Gliniak C, Zhang Z, Xue Y, Smith KB, McCreedy R, Adedokun SA. Serum metabolite profiles and target tissue gene expression define the effect of cholecalciferol intake on calcium metabolism in rats and mice. J Nutr. 2008;138(6):1114–20.
27. Anderson PH, Sawyer RK, May BK, O'Loughlin PD, Morris HA. 25-Hydroxyvitamin D requirement for maintaining skeletal health utilising a Sprague-Dawley rat model. J Steroid Biochem Mol Biol.
2007;103(3–5):592–5.
28. Burild A, Lauridsen C, Faqir N, Sommer HM, Jakobsen J. Vitamin D3 and 25-hydroxyvitamin D3 in pork and their relationship to vitamin D status in pigs. J Nutr Sci. 2016;5:e3.
29. Jakobsen J, Maribo H, Bysted A, Sommer HM, Hels O. 25-hydroxyvitamin D3 affects vitamin D status similar to vitamin D3 in pigs--but the meat produced has a lower content of vitamin D. Br J Nutr. 2007;98(5):908–13. 30. Park JM, Park CY, Han SN. High fat diet-induced obesity alters
vitamin D metabolizing enzyme expression in mice. Biofactors. 2015; 41(3):175–82.
31. Jung YS, Wu D, Smith D, Meydani SN, Han SN. Dysregulated 1,25-dihydroxyvitamin D levels in high-fat diet-induced obesity can be restored by changing to a lower-fat diet in mice. Nutr Res. 2018;53:51–60.
32. Seldeen KL, Pang M, Rodriguez-Gonzalez M, Hernandez M, Sheridan Z, Yu P, Troen BR. A mouse model of vitamin D insufficiency: is there a relationship between 25(OH) vitamin D levels and obesity? Nutr Metab. 2017;14:26. 33. Roizen JD, Long C, Casella A, O'Lear L, Caplan I, Lai M, Sasson I, Singh R,
Makowski AJ, Simmons R, et al. Obesity decreases hepatic 25-hydroxylase activity causing low serum 25-Hydroxyvitamin D. J Bone Miner Res. 2019; 34(6):1068–73.
34. Duan L, Xue Z, Ji H, Zhang D, Wang Y. Effects of CYP2R1 gene variants on vitamin D levels and status: a systematic review and meta-analysis. Gene. 2018;678:361–9.
35. Barry EL, Rees JR, Peacock JL, Mott LA, Amos CI, Bostick RM, Figueiredo JC, Ahnen DJ, Bresalier RS, Burke CA, et al. Genetic variants in CYP2R1, CYP24A1, and VDR modify the efficacy of vitamin D3 supplementation for increasing serum 25-hydroxyvitamin D levels in a randomized controlled trial. J Clin Endocrinol Metab. 2014;99(10):E2133–7.
36. Lawson DE, Douglas J, Lean M, Sedrani S. Estimation of vitamin D3 and 25-hydroxyvitamin D3 in muscle and adipose tissue of rats and man. Clin Chim Acta. 1986;157(2):175–81.
37. Heaney RP, Armas LA, Shary JR, Bell NH, Binkley N, Hollis BW.
25-hydroxylation of vitamin D3: relation to circulating vitamin D3 under various input conditions. Am J Clin Nutr. 2008;87(6):1738–42.
38. Hollander D, Muralidhara KS, Zimmerman A. Vitamin D-3 intestinal absorption in vivo: influence of fatty acids, bile salts, and perfusate pH on absorption. Gut. 1978;19(4):267–72.
39. Dawson-Hughes B, Harris SS, Lichtenstein AH, Dolnikowski G, Palermo NJ, Rasmussen H. Dietary fat increases vitamin D-3 absorption. J Acad Nutr Diet. 2015;115(2):225–30.
40. Tangpricha V, Koutkia P, Rieke SM, Chen TC, Perez AA, Holick MF. Fortification of orange juice with vitamin D: a novel approach for enhancing vitamin D nutritional health. Am J Clin Nutr. 2003;77(6):1478–83. 41. Abumrad NA, Davidson NO. Role of the gut in lipid homeostasis. Physiol
Rev. 2012;92(3):1061–85.
42. Zhu S, Park S, Lim Y, Shin S, Han SN. Korean pine nut oil replacement decreases intestinal lipid uptake while improves hepatic lipid metabolism in mice. Nutr Res Pract. 2016;10(5):477–86.
43. Hernandez Vallejo SJ, Alqub M, Luquet S, Cruciani-Guglielmacci C, Delerive P, Lobaccaro JM, Kalopissis AD, Chambaz J, Rousset M, Lacorte JM. Short-term adaptation of postprandial lipoprotein secretion and intestinal gene expression to a high-fat diet. Am J Physiol Gastrointest Liver Physiol. 2009; 296(4):G782–92.
44. de Wit NJ, Bosch-Vermeulen H, de Groot PJ, Hooiveld GJ, Bromhaar MM, Jansen J, Muller M, van der Meer R. The role of the small intestine in the development of dietary fat-induced obesity and insulin resistance in C57BL/ 6J mice. BMC Med Genet. 2008;1:14.
45. Torelli Hijo AH, Coutinho CP, Alba-Loureiro TC, Moreira Leite JS, Bargi-Souza P, Goulart-Silva F. High fat diet modulates the protein content of nutrient transporters in the small intestine of mice: possible involvement of PKA and PKC activity. Heliyon. 2019;5(10):e02611.
Publisher’s Note
Springer Nature remains neutral with regard to jurisdictional claims in published maps and institutional affiliations.