R E S E A R C H A R T I C L E
Open Access
Genetic diversity and population structure
analysis to construct a core collection from
a large
Capsicum germplasm
Hea-Young Lee
1, Na-Young Ro
2, Hee-Jin Jeong
1, Jin-Kyung Kwon
1, Jinkwan Jo
1, Yeaseong Ha
1, Ayoung Jung
1,
Ji-Woong Han
1, Jelli Venkatesh
1and Byoung-Cheorl Kang
1*Abstract
Background: Conservation of genetic diversity is an essential prerequisite for developing new cultivars with desirable agronomic traits. Although a large number of germplasm collections have been established worldwide, many of them face major difficulties due to large size and a lack of adequate information about population structure and genetic diversity. Core collection with a minimum number of accessions and maximum genetic diversity of pepper species and its wild relatives will facilitate easy access to genetic material as well as the use of hidden genetic diversity in Capsicum.
Results: To explore genetic diversity and population structure, we investigated patterns of molecular diversity using a transcriptome-based 48 single nucleotide polymorphisms (SNPs) in a large germplasm collection comprising 3,821 accessions. Among the 11 species examined, Capsicum annuum showed the highest genetic diversity (HE= 0.44,
I = 0.69), whereas the wild species C. galapagoense showed the lowest genetic diversity (HE= 0.06, I = 0.07). The
Capsicum germplasm collection was divided into 10 clusters (cluster 1 to 10) based on population structure analysis, and five groups (group A to E) based on phylogenetic analysis. Capsicum accessions from the five distinct groups in an unrooted phylogenetic tree showed taxonomic distinctness and reflected their geographic origins. Most of the accessions from European countries are distributed in the A and B groups, whereas the accessions from Asian countries are mainly distributed in C and D groups. Five different sampling strategies with diverse genetic clustering methods were used to select the optimal method for constructing the core collection. Using a number of allelic variations based on 48 SNP markers and 32 different phenotypic/morphological traits, a core collection ‘CC240’ with a total of 240 accessions (5.2 %) was selected from within the entire Capsicum germplasm. Compared to the other core collections, CC240 displayed higher genetic diversity (I = 0.95) and genetic evenness (J’ = 0.80), and represented a wider range of phenotypic variation (MD = 9.45 %, CR = 98.40 %).
Conclusions: A total of 240 accessions were selected from 3,821 Capsicum accessions based on transcriptome-based 48 SNP markers with genome-wide distribution and 32 traits using a systematic approach. This core collection will be a primary resource for pepper breeders and researchers for further genetic association and functional analyses.
Keywords: Capsicum spp., Core collection, Genetic diversity, Germplasm, Population structure
* Correspondence:[email protected]
1Department of Plant Science and Vegetable Breeding Research Center,
Seoul National University, Seoul 151-921, Korea
Full list of author information is available at the end of the article
© The Author(s). 2016 Open Access This article is distributed under the terms of the Creative Commons Attribution 4.0 International License (http://creativecommons.org/licenses/by/4.0/), which permits unrestricted use, distribution, and reproduction in any medium, provided you give appropriate credit to the original author(s) and the source, provide a link to the Creative Commons license, and indicate if changes were made. The Creative Commons Public Domain Dedication waiver (http://creativecommons.org/publicdomain/zero/1.0/) applies to the data made available in this article, unless otherwise stated.
Background
Pepper (Capsicum spp.) is one of the major vegetable and spice crops grown worldwide, and is rich in bio-active compounds, such as capsaicinoids and caroten-oids, which contribute to the improvement of human health [1, 2]. Because of its economic and nutritional im-portance, breeders have improved agronomic traits of pepper, such as pungency, fruit shape, abiotic stress tol-erance, and disease resistance. Meanwhile, genetic diver-sity of breeding lines has become smaller and some useful genes in the landraces are lost due to the breeding activities [3, 4]. Therefore, conservation and sustainable utilization of genetic resources are keys to continuous improvement of peppers [5].
During the last several decades, there has been re-markable progress in germplasm collection and conser-vation of various plants. Although a large number of germplasms have been collected, their management has become more and more complicated due to their huge sizes. Furthermore, little is known about the genetic di-versity and structure of such collections at the interspe-cific and intraspeinterspe-cific levels [6]. To make efficient use of large germplasm collections, the concept of core collec-tions has been proposed. A core collection is a subset of a germplasm collection of a species that represents the genetic diversity of the entire collection [7]. A good core collection is one that has no redundant accessions, is small enough to be easily managed, and represents the total genetic diversity [8].
Various types of data including passport data, geo-graphic origin [9, 10], agronomic traits [11–13], and molecular markers [14] can be used for selecting a core set. Although the major reason for establishing a core set is to reduce the number of representative ac-cessions up to 10 % while maintaining the diversity of the entire collection, there are a number of possible methods for selection of a core set depending on the research goals. In the early 2000s, most researchers performed random sampling using various assignment methods [9, 11]. Later, the M (maximization) strategy was proposed as a more effective method to select a core set representing the maximum genetic diversity without redundancy [12, 15].
Several research institutions have collected and con-served thousands of Capsicum accessions, ranging from 1,000 in the Centre for Genetic Resources (CGN), the Netherlands [16] to almost 8,000 in the Asian Vegetable Research and Development Center (AVRDC), Taiwan [17]. Researchers and institutions have attempted to construct core collections of Capscicum spp. for various purposes. Fan et al. [13], Nicolai et al. [14], and Zewdie et al. [12] established core collections to reveal pheno-typic and genetic variation. Thies and Fery [9], and Quenouille et al. [10] constructed a core collection for
disease resistance against northern root-knot nematode and Potato virus Y (PVY), respectively. Hanson et al. [11] developed a core collection to analyze antioxidant activities. However, most studies involved a relatively small number of accessions, using fewer than 1,000 ac-cessions with limited numbers of morphological traits and molecular markers [11, 12, 14]. The limited number of morphological traits and markers allow us to survey only a small portion of the genetic diversity of the entire germplasm, and the resulting data cannot be used for genome-wide variation studies.
In this study, we performed population structure ana-lysis in a large Capsicum germplasm collection consist-ing of 3,821 accessions by applyconsist-ing 48 genome-wide SNPs, and selected a core set using the SNP data to-gether with data for 32 morphological traits. This allowed us to 1) examine the level of genetic diversity and the population structure within the worldwide Cap-sicum germplasm collection; 2) optimize selection methods by comparing different core sets, which were selected using a stepwise selection strategy based on various combinations of data and clustering methods; and 3) ultimately construct a Capsicum core collection that represents the entire germplasm collection without redundancy. Finally, we validated the core collection by evaluating the diversity of a range of traits and genotyp-ing additional molecular markers. This core collection will be a valuable data set for both pepper breeding and genome-wide association studies.
Methods
Plant materials
A total of 4,652 Capsicum accessions used in this study originated from 97 countries and included 11 species: C. annuum, C. baccatum, C. cardenasii, C. chacoense, C. chinense, C. eximium, C. frutescens, C. galapagoense, C. praetermissum, C. pubescens, and C. tovarii. The geo-graphic origin and passport data of the germplasm ac-cessions were obtained from the Rural Development Administration (RDA, Jeonju, Korea) and Seoul National University (SNU, Seoul, Korea). Among the germplasm accessions, 3,599 were obtained from the RDA, and 1,053 were obtained from SNU. Most of the accessions were C. annuum, accounting for 4,163 accessions. Four other domesticated species, C. baccatum, C. chinense, C. frutescens, and C. pubescens accounted for 163, 122, 152, and 11 accessions, respectively. Among the wild Capsi-cumspecies, C. cardenasii, C. chacoense, C. eximium, C. galapagoense, C. praetermissum and C. tovarii accounted for 1, 28, 4, 2, 5, and 1 accessions, respectively.
DNA extraction and SNP genotyping
Two young leaves from each accession were used for DNA extraction. DNA was extracted using the cetyl
trimethylammonium bromide (CTAB) method as de-scribed previously [18]. The concentration and purity of DNA samples were determined with a NanoDrop 1000 spectrophotometer (NanoDrop Technologies, Wilmington, DE, USA). DNA samples showing absorbance ratios above 1.8 at 260/280 nm were used for marker analysis.
A set of 48 SNP markers evenly distributed in 12 pepper chromosomes were used in this study [19] (Additional file 1: Table S1). In a preliminary study a total of 282 accessions were randomly selected from entire germplasm collection for genetic diversity study with 412 SNP markers developed by Kang et al. [19]. Based on this analysis, highly polymorphic SNP markers (PIC > 0.45) were selected. Genotyping was performed using the BioMark™ HD system (Fluidigm, San Francisco, CA, USA), EP1™ system (Fluidigm, San Francisco, CA, USA), and 48 × 48 Dynamic Array IFCs (Fluidigm, San Francisco, CA, USA) according to the manufacturer’s protocol [20]. Specific target amplifica-tion (STA) was performed prior to SNP genotyping analysis. PCR was performed in a 5-μL reaction con-taining 60 ng of the DNA sample according to the manufacturer’s protocol. Thermal cycling conditions were 15 min at 95 °C, followed by 14 cycles of a 2-step amplification profile of 15 s at 95 °C and 2 min at 60 °C. For genotyping, SNPtype assays were performed using STA products following manufacturer’s protocol. Thermal cycling was carried out at 95 °C for 15 s, 64 °C for 45 s and 72 °C for 15 s with a touchdown of−1 °C per cycle from 64 to 61 °C, followed by 34 cycles of 95 °C for 15 s, 60 °C for 45 s and 72 °C for 15 s. For the species verifica-tion and/or identificaverifica-tion of pepper accessions with miss-ing species information, SNP markers C2_At5g04590, C2_At1g50020, and C2_At2g19560 were used based on high resolution melting (HRM) analysis [21]. Genotyping analysis was performed using a Rotor Gene 6000 (Qiagen, Valencia, CA, USA).
Population structure analysis
To analyze the population structure of the entire germ-plasm collection used in this study, we used a model based genetic clustering algorithm [22] as implemented in the STRUCTURE program ver. 2.3.4 [23]. The num-ber of sub-populations (ΔK) was determined using the ad-hoc statistical method, based on the rate change in the log probability of data between successive K values [24]. Fifty independent runs for K values ranging from 1 to 20 were performed with a burn-in length of 50,000 followed by 1,000,000 iterations.
Phylogenetic and principal coordinate analyses
Phylogenetic trees were produced using genotyping data with 48 SNP markers using both the unweighted neighbor-joining method and the hierarchical clustering
method based on the dissimilarity matrix calculated with Manhattan index, as implemented in the DARwin soft-ware (version 6.0.9). Principal coordinate analyses were also performed with DARwin 6.0.9 [25].
Statistical analysis of genetic diversity
Different indices were used for analysis and comparison of diversity among the Capsicum collections. These in-clude levels of observed heterozygosity (HO), expected
heterozygosity (HE), polymorphic information content
(PIC), genetic differentiation (FST), Shannon’s
informa-tion index of diversity (I), and genetic evenness (J’). Indices Ho, HE, PIC, and FST were calculated using
Power Marker 3.25 [26]. For analysis of genetic diversity of core collections, I and J’ were calculated following Hennink and Zeven [27] and Pielou [28], respectively. Analysis of molecular variance (AMOVA) was con-ducted to detect the genetic variance within and among population using GenAlEx ver 6.502 [29].
Establishment of the core collection
To establish a core collection, five different methods were used. Specifically, core sets were selected based on 1) genotype analysis of the entire collection, 2) genotype analysis of each cluster after grouping based on genotype dissimilarity, 3) phenotype analysis of the entire collec-tion, 4) a combination of genotype and phenotype ana-lysis of entire collection, and 5) a combination of phenotype and genotype analysis of each cluster after grouping based on genotype dissimilarity.
Representative accessions were selected based on the advanced M strategy using a modified heuristic algo-rithm implemented in PowerCore software [30]. Cat-egorical variables, such as genotype and qualitative phenotype were applied in several classes (3 to 12 clas-ses) based on distinct characters. Continuous variables (quantitative phenotypes, 7 to 12 classes) were automat-ically classified into different categories in the software based on Sturges’ rule [31]. Therefore, a total of 264 phenotypic alleles were used to select the core entries (Additional file 1: Table S2).
Evaluation of the core collections
To evaluate each core collection, diverse statistical indi-cators were calculated for two types of variables, con-tinuous and categorical variables. For continuous variables, the percentage of significant difference be-tween core collections and the entire germplasm collec-tion was calculated based on the mean difference (MD) percentage, the coincidence rate (CR) of range, the vari-ance difference (VD) percentage, and variable rate (VR) of coefficient of variation. Among the candidate core sets selected from each different data set, a core set with MD less than 20 % and CR more than 80 % was
considered as a representative collection. In addition, a lower value in VD and higher value in VR was consid-ered to indicate a more effective core collection [32]. For categorical variables, the I and J’ values were calculated and compared between the five core collections and the entire germplasm collection. The maximum value of I (I max) is calculated based on the log of the number of classes used in the entire collection; the value for a core collection should be comparable to that of the entire collection [8].
Three additional markers having multiple alleles, COS643, COS111, and L4RP-3 F, which were selected from the Sol Genomics Network [33] and Yang et al. [34], were used for validation of the core set. Melting curve patterns were identified by HRM analysis using a Rotor Gene 6000 (Qiagen, Valencia, CA, USA). Thermal cycling conditions were 10 min at 95 °C, 50 cycles of 3-step amplification profile of 20 s at 94 °C, 20 s at 55 °C, and 40 s at 72 °C, followed by final extension 60 s at 95 °C and 60 s at 40 °C. HRM analysis was performed increasing 0.1 °C for every two seconds from 70 to 90 °C.
Finally, the core collection (CC240) with the highest genetic diversity and evenness was planted in 2014 in a research farm (Suwon, Korea) to monitor the variation of the diverse traits. Morphological data were obtained for the same accessions that were genotyped. Thirty-two different traits related to plant habit (9), leaf (4), flower (6), fruit (10), and seed (3) were analyzed. Phenotype data were presented as the mean ± SE. The differences between the mean values of individual clusters were assessed using one-way ANOVA and Duncan’s multiple range tests. P < 0.05 was considered to indicate a statisti-cally significant difference. The IBM SPSS Statistics v23 software (IBM Corp., Armonk, NY, USA) was used for analysis.
Results
Genetic diversity of theCapsicum germplasm
In our preliminary studies, a total of 4,652 non-redundant accessions from 11 species were screened using SNP markers to reveal the genetic diversity (Additional file 1: Table S3). Based on the HOvalues, 673 accessions mostly
from C. annuum with Ho value more than 0.3 were con-sidered as F1 hybrids (Additional file 2) and excluded from analysis. In addition, 158 accessions with more than seven missing genotype data points were also excluded. Ultimately, a total of 3,821 accessions were used for fur-ther experiments (Table 1).
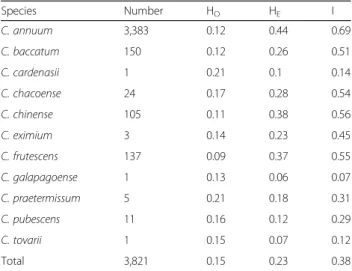
Using the SNP genotyping results, the HE, HO, and I
were calculated for 3,821 pepper accessions (Table 1). The HE values ranged from 0.10 to 0.44, and I values
ranged from 0.07 to a maximum of 0.69. The highest di-versity values in C. annuum accessions (HE= 0.44, I =
0.69) suggests that there is extensive genetic variation
within this species. With the exceptions of C. baccatum and C. pubescens, the other domesticated species showed relatively high HE values, above 0.37. The HO
value of C. annuum was 0.12, whereas those of the other species varied from 0.09 to 0.21. Four domesticated spe-cies C. annuum, C. baccatum, C. chinense, and C. frutes-cens and two wild species C. chacoense, and C. eximium had lower values for HO compared to HE, (Table 1)
whereas C. cardenasii, C. galapagoense, C. pratermissum, C. pubescens, and C. tovarii had relatively higher values of HO compared to HE. This pattern suggests that the
first six species have experienced inbreeding for a long time which could be attributed to the interplay of many factors such as artificial selection, non-random mating between individuals, population structure and size, and Wahlund effect (mixing of individuals from different genetic sources) [35, 36]. By contrast, accessions of the latter five species were collected in different isolated lo-cations where each accession had evolved independently.
Population structure of the germplasm collection
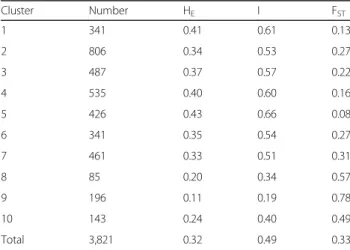
The SNP genotyping results were used to perform popu-lation structure analysis for the 3,821 accessions under an admixed model using the STRUCTURE program [23]. Estimated likelihood (LnP (D)) was found to be greatest when K = 10, suggesting that the population used in this study can be divided into ten clusters (Fig. 1). The clusters 3, 8, 9, and 10 were rather well separated from others whereas the cluster 1, 2, 4, 5, 6, and 7 were admixtures. Each of the 10 clusters included different numbers of accessions, ranging from 85 to 806 (Table 2). The average distance (HE) between individuals in each
cluster was 0.32. The highest HE value of 0.43 was
ob-served in cluster 5, indicating greater genetic diversity within this cluster, whereas cluster 9 showed the lowest
Table 1 Genetic diversity analysis of the 3,821 pepper accessions
Species Number HO HE I C. annuum 3,383 0.12 0.44 0.69 C. baccatum 150 0.12 0.26 0.51 C. cardenasii 1 0.21 0.1 0.14 C. chacoense 24 0.17 0.28 0.54 C. chinense 105 0.11 0.38 0.56 C. eximium 3 0.14 0.23 0.45 C. frutescens 137 0.09 0.37 0.55 C. galapagoense 1 0.13 0.06 0.07 C. praetermissum 5 0.21 0.18 0.31 C. pubescens 11 0.16 0.12 0.29 C. tovarii 1 0.15 0.07 0.12 Total 3,821 0.15 0.23 0.38
Ho observed heterozygosity, HEexpected heterozygosity,I Shannon’s information index of diversity
HEvalue of 0.11. Genetic differentiation (FST) values
var-ied from 0.08 to 0.78 with an average of 0.33. The smal-lest FSTvalue (0.08) was observed in cluster 5, whereas
cluster 9 had the highest FSTvalue (0.78), indicating that
accessions in this cluster have several different genotype patterns.
Most of the C. annuum accessions were found in clus-ters 1 to 7. C. chinense was mostly distributed in clusclus-ters 8 and 9, whereas C. frutescens was mostly found in clus-ters 4, 9, and 10. By contrast, C. baccatum was distrib-uted in clusters 8, 9, and 10. C. pubescens was placed in cluster 10. Wild species C. chacoense, C. cardenasii, C. eximium, C. praetermissum, and C. tovarii were
distributed in cluster 10 along with C. baccatum acces-sions (Additional file 1: Table S4). Although not fully distinct, the ten clusters were roughly separated accord-ing to geographic distribution. Clusters 1 to 3 were com-posed of an admixture of accessions from East Europe countries (Additional file 3). Cluster 4 to 7 were mostly composed of collections from East Asia. Interestingly, the Korean landraces belonged to clusters 6 and 7. The accessions of clusters 8 to 10 were mostly from South America.
Molecular phylogenetic analysis of the germplasm collection
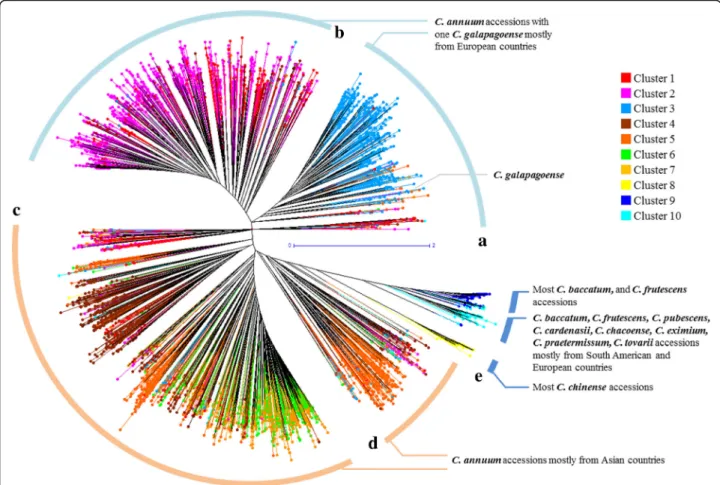
Using the genotyping data, an unrooted phylogenetic tree of the 3,821 pepper accessions was generated using the unweighted neighbor joining method based on gen-etic dissimilarity calculated with the Manhattan index. The tree showed five large clades (A-E) in which acces-sions of C. annuum were grouped separately from the other species (Fig. 2). The C. annuum accessions were found in four large clades. C. annuum accessions col-lected (or originated) in European countries were dis-tributed among upper branches including the clades A and B. C. annuum accessions from Asian countries were distributed among lower branches (clades C and D). The accessions belonging to other species were clustered to-gether in clade E. Within clade E, most of C. chinense accessions were clearly distinguished from those of other species and were placed next to clade D. When the unrooted phylogenetic tree was compared with the clus-ters obtained from the STRUCTURE analysis, the phylo-genic tree matched well with the cluster separation in the STRUCTURE analysis. Accessions in cluster 3
Fig. 1 Population structure of the Capsicum germplasm collection. aΔK reached its maximum value when K = 10 following the ad-hoc method. b Ten subpopulation clusters inferred by STRUCTURE are represented by different colors
Table 2 Diversity-related summary statistics for all clusters inferred by STRUCTURE analysis
Cluster Number HE I FST 1 341 0.41 0.61 0.13 2 806 0.34 0.53 0.27 3 487 0.37 0.57 0.22 4 535 0.40 0.60 0.16 5 426 0.43 0.66 0.08 6 341 0.35 0.54 0.27 7 461 0.33 0.51 0.31 8 85 0.20 0.34 0.57 9 196 0.11 0.19 0.78 10 143 0.24 0.40 0.49 Total 3,821 0.32 0.49 0.33
HEexpected heterozygosity,I Shannon’s information index of diversity, FST genetic differentiation
belonged to clade A, accessions in clusters 1 and 2 to clade B, and accessions in clusters 4 to 7 to clade C; some of the accessions in cluster 5 and admixtures belonged to clade D and the accessions in clusters 8 to 10 were in clade E (Figs. 1 and 2). The unrooted phylo-genetic tree more clearly differentiated groups according to their geographic origin.
Optimization of core set selection methods and construction of the core collection
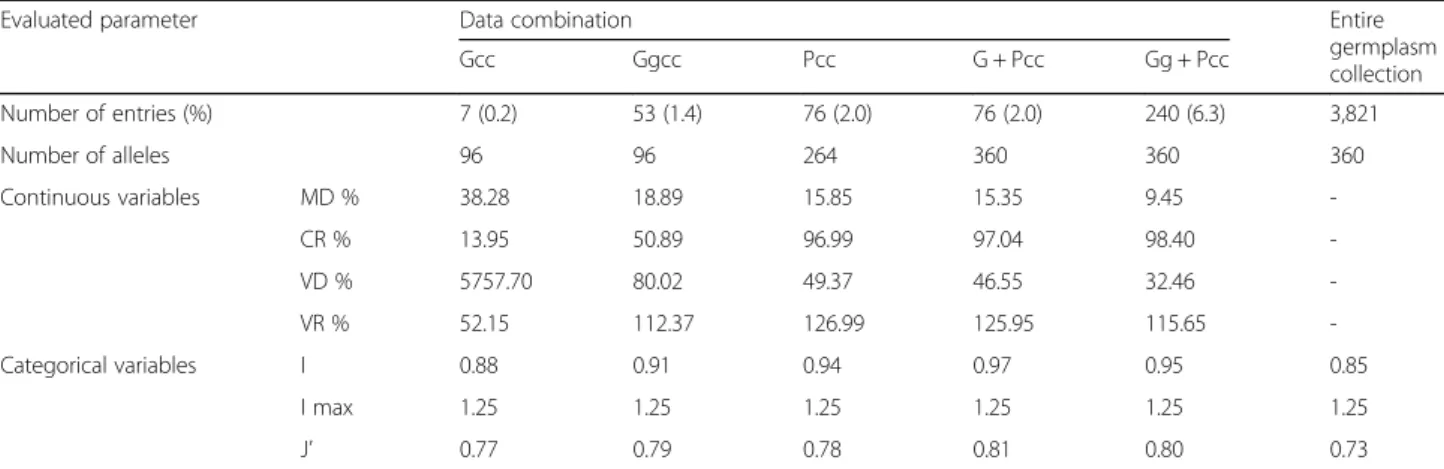
To determine the best possible method for selection of a core collection, five different sampling strategies were tested (Table 3). The first three methods were carried out using the entire collection without considering clus-tering analysis. These methods included selection of core entries based on SNP genotype data only (Gcc), pheno-type data only (Pcc), or the combination of genopheno-type and phenotype data (G + Pcc). In the other two methods, core entries were selected from each cluster of the unrooted phylogenetic tree. In these methods, after
analysis of the entire collection, core entries in each cluster were selected based on genotype data only (Ggcc), or the combination of genotype and phenotype data (Gg + Pcc).
When only genotype data were used, 7 and 53 core entries were selected for Gcc and Ggcc, respectively. Ggcc showed a MD of less than 20 %, which is close to the mean value of the entire collection, whereas Gcc showed a MD of more than 20 %, poorly representing the entire collection. Both of them showed a CR of less than 80 %, demonstrating insufficient coverage of the phenotype variation of the entire collection. However, Ggcc exhibited a smaller percentage of VD and larger percentage of VR, which indicated that selection of a core set after clustering analysis (Ggcc) better repre-sented the entire collection. Furthermore, the compari-son of categorical variables including 48 SNPs markers and 15 qualitative traits produced a higher value in I for Ggcc (0.91) than for Gcc (0.88), but a similar value in J’ for Ggcc (0.79) and Gcc (0.77). Therefore, selecting the core entries after clustering analysis is more effective to
Fig. 2 Unrooted phylogenetic tree of the Capsicum germplasm. The dendrogram was produced using the unweighted neighbor-joining method based on genetic dissimilarity among the 3,821 germplasm accessions. The colors of branches indicate accessions corresponding to the clusters (cluster 1 to 10) from population structure analysis as in Fig. 1. Five clades (a-e) were distinguished by distance between branches; a and b included C. annuum species mostly from Europe; c and d included C. annuum species mostly from Asia; e comprised other Capsicum species except C. annuum. a to e were used for a clustering range to select entries to construct the core collection
represent the entire collection in terms of both pheno-type and genopheno-type data even using same number of alleles.
Since the core sets selected using only genotype data could not represent the diversity of the entire collection presumably due to limitations of number of SNP markers used, the available phenotype data for 32 traits were included for selection of core sets. Each trait in-cluded 3 to 12 phenotype classes providing at least 264 variations (Additional file 1: Table S2). A total of 76 en-tries were selected based on only phenotype data (Pcc) and produced 15.85 % in MD, 96.99 % in CR, 0.94 in I and 0.78 in J’, which reflects slightly better representation of the entire collection than that of Gcc. When both genotype and phenotype data were used (G + Pcc), the same number of entries (76), but slightly better repre-sentation of the entire collection was achieved compared to that with Pcc. As we found that selection of a core set after clustering analysis more effectively represented the entire collection, the final core collection was built using a combination of genotype and phenotype data after cluster analysis (Gg + Pcc). A total of 240 accessions representing six species, C. annuum (176), C. baccatum (21), C. chinense (22), C. eximium (2), C. frutescens (18), and C. praetermissum (1) were ultimately selected as a core collection (CC240) (Additional file 1: Table S5). Compared with the entire germplasm collection, CC240 showed 9.45 % in MD and 98.40 % in CR, which pro-vided good coverage of most of the range of continuous phenotypes in the entire collection. Furthermore, CC240 showed the lowest MD and the highest CR of all tested core collections. In addition, the values of I and J’ were 0.95 and 0.80, respectively, which represents increased
genetic diversity compared to the entire germplasm collection.
To validate and confirm the distribution of core en-tries, core collections selected from five methods PCA was performed. The distribution of the entire germplasm collection and core collection entries on the basis of genotyping was explained by the first two principal com-ponents, where the first and second axes explained 8.13 and 6.19 % of the total variation among the accessions, respectively, and showed a clear separation of C. annuumfrom other species. PCA analysis based on phe-notyping included 589 accessions with no more than 10 % of missing data points, whereas 2,006 accessions were plotted in the genotype plus phenotype background with no more than 20 % missing data to reach the least condition of unit pairing. In contrast to the phenotype (21.87 %, 11.44 %), the genotype (8.13 %, 6.19 %) and genotype plus phenotype (6.44 %, 4.91 %) revealed lower variation in each axis (Fig. 3). Overall, regardless of the selection method, PCA analysis showed that core entries were distributed evenly without obvious grouping, cover-ing the variation of the entire germplasm collection.
Evaluation of the core set using markers with multiple alleles
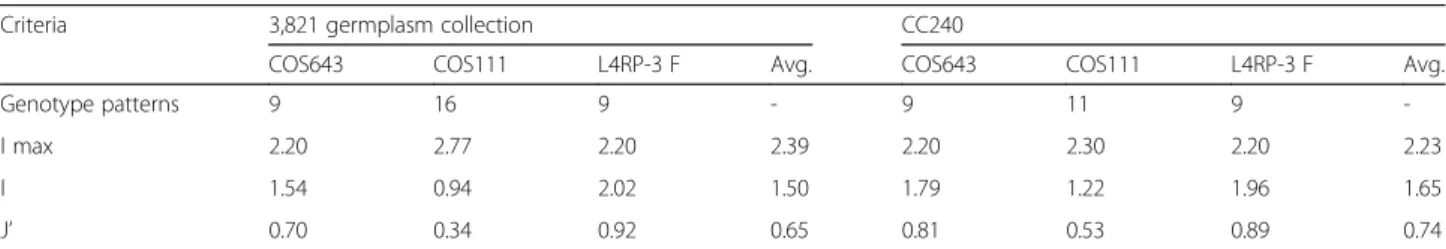
Evaluation of the quality of core collections should be based on data that were not used in the selection of the core set [37]. Accordingly, three additional multiple allelic markers, COS643, COS111, and L4RP-3 F, were used to evaluate the core set (Additional file 1: Table S6); the markers had 9, 16, and 9 alleles, respectively, in the entire germplasm collection (Table 4). The numbers of alleles in CC240 were the same as those in entire collection except
Table 3 Comparisons of distribution frequency and representativeness among five different core collections constructed based on diverse sampling strategies
Evaluated parameter Data combination Entire
germplasm collection Gcc Ggcc Pcc G + Pcc Gg + Pcc Number of entries (%) 7 (0.2) 53 (1.4) 76 (2.0) 76 (2.0) 240 (6.3) 3,821 Number of alleles 96 96 264 360 360 360 Continuous variables MD % 38.28 18.89 15.85 15.35 9.45 -CR % 13.95 50.89 96.99 97.04 98.40 -VD % 5757.70 80.02 49.37 46.55 32.46 -VR % 52.15 112.37 126.99 125.95 115.65 -Categorical variables I 0.88 0.91 0.94 0.97 0.95 0.85 I max 1.25 1.25 1.25 1.25 1.25 1.25 J’ 0.77 0.79 0.78 0.81 0.80 0.73
Gcc: core collection constructed based on genotype with nongroup based strategy, Ggcc: core collection constructed from entries in each cluster grouped by genotype, Pcc: core collection constructed based on phenotype, G + Pcc: core collection constructed based on combination of genotype and phenotype, Gg + Pcc: core collection constructed based on genotype and phenotype combination from each cluster grouped by genotype. Distributional aspects to validate a representativeness of core collection; MD%: the mean difference percentage, CR%: the coincidence rate, VD%: the variance difference percentage, VR%: variable rate. Genetic diversity indices to validate categorical variables; I: Shannon’s information index of diversity, I max: logarithmic number of classes in entire collection, J’: genetics evenness
for COS111 (11 instead of 16). The genetic diversity of CC240 revealed by these markers was compared with that of the entire collection. The average value for I in CC240 was higher (1.65) than that of the en-tire collection (1.50). Furthermore, the average gen-etic evenness was more stable in CC240 (0.74) compared to the entire collection (0.65). However, L4RP-3 F did not show a difference in genetic diver-sity or evenness because the I value of the entire col-lection (2.02) for that marker was already close to maximum value (I max = 2.20). In summary, the high genetic diversity and evenness of CC240 evaluated by three additional markers demonstrated that the core accessions in CC240 well represent the entire collection.
Morphological variations of CC240
Accessions of CC240 were planted in an experimental farm and grown for 1 year to evaluate various traits. Four accessions, namely Javitott bogyiszloi (C. annuum), 9146 (C. annuum), Tabasco (C. frutescens), and 9148 (C. frutescens) were excluded from the phenotype analysis due to poor growth. Thus, pheno-type evaluation was performed for 236 accessions for 32 different traits (Additional file 1: Table S2). Over-all, CC240 showed a similar range of diversity in morphological traits as that of entire collection. For plant architecture, about one half of the accessions (105) showed the half-spreading phenotype. Plant height was varied between 40 cm to 200 cm, and plant width ranged between 25 cm to 130 cm. Leaf
Fig. 3 Principal coordinate analysis of distributions of diverse core entries selected from different sampling strategies. PCA was performed with DARwin 6.0.9 software based on distance matrices. a distribution of pepper accessions based on genotype included 3,821 accessions from entire germplasm collection, and 7, 53, 76, 76, and 240 accessions from Gcc, Ggcc, Pcc, G + Pcc, and Gg + Pcc sampling strategies, respectively; b distribution of pepper accessions based on phenotype included 589 accessions from entire germplasm collection, and 1,9, 42, 43, and 115 accessions from Gcc, Ggcc, Pcc, G + Pcc, and Gg + Pcc sampling strategies, respectively; c distribution of pepper accessions based on genotype and phenotype combination included 2,006 accessions from entire germplasm collection, and 3, 27, 76, 76, and 235 accessions from Gcc, Ggcc, Pcc, G + Pcc, and Gg + Pcc sampling strategies, respectively. Matrices surrounded with blue boxes indicate distributions of the pepper accessions from entire collection
Table 4 Comparison of genetic diversity between the 3,821 accession collection and different core collections using an additional set of multiplex markers
Criteria 3,821 germplasm collection CC240
COS643 COS111 L4RP-3 F Avg. COS643 COS111 L4RP-3 F Avg.
Genotype patterns 9 16 9 - 9 11 9
-I max 2.20 2.77 2.20 2.39 2.20 2.30 2.20 2.23
I 1.54 0.94 2.02 1.50 1.79 1.22 1.96 1.65
J’ 0.70 0.34 0.92 0.65 0.81 0.53 0.89 0.74
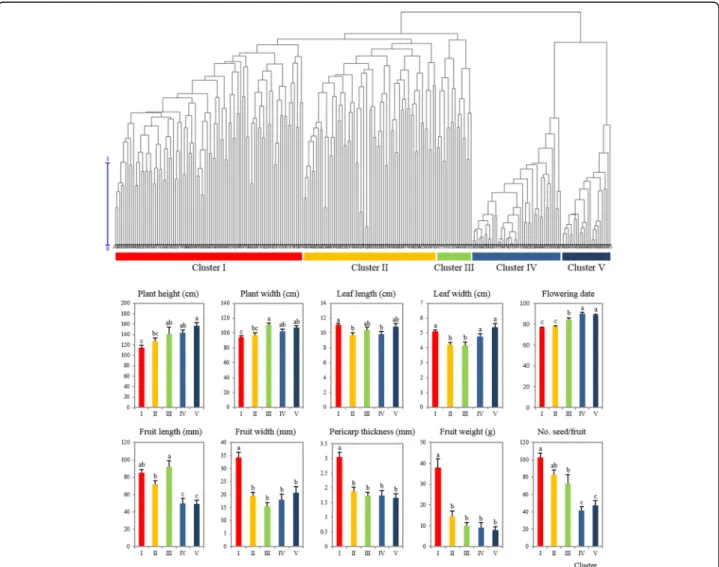
color varied from light green to dark green except for one accession having purple leaves; leaf length was 4.83 cm to 15.43 cm, and leaf width was 2.13 cm to 8.77 cm. Flower color of most accessions (188) was white, whereas 23 had light green flowers, and 21 had white flowers with yellow spots. Among all accessions, the earli-est flowering date was 63 days from planting in C. annuum ‘Swedish’ and ‘A9E0211’, whereas the latest date was 103 days in C. baccatum ‘C01543’ and C. annuum ‘ACC160’. Length of fruit was distributed between 4.8 mm and 249 mm with an average of 72.66 mm, fruit width var-ied between 4.8 mm and 84.12 mm with an average of 24.82 mm, and thickness of pericarp was 0.2 mm to 7.2 mm. Fruit weight was distributed between 0.06 g and 177.32 g. There were five to 256 seeds in each fruit (Fig. 4).
Using genotype, accessions of CC240 were divided into five clusters (I-V) by hierarchical clustering (UPGMA) based on genetic dissimilarity of 48 SNP markers. Clus-ters I, II, and III included C. annuum species whereas clusters IV and V included other species, such as C. bac-catum, C. chinense, C. eximium, C. frutescens, and C. praetermissum. Among the 32 morphological traits, 10 different quantitative traits including plant height, plant width, leaf length, leaf width, flowering date, fruit length, fruit width, fruit weight, number of seeds per fruit, and fruit pericarp thickness were significantly different be-tween the clusters (Fig. 4). Cluster I was characterized by large-fruited peppers with thick pericarp. Leaves were large, plant height and width are slightly shorter, and flowering date was relatively earlier than that of C. annuumaccessions in cluster III. Accessions in cluster II
Fig. 4 Comparison of phenotypic measurements among five clusters in CC240. Dendrogram was generated by hierarchical clustering (UPGMA) based on genetic dissimilarity. Average values of 10 different phenotypic characters (plant height, plant width, leaf length, leaf width, flowering date, fruit length, fruit width, fruit pericarp thickness, fruit weight, and number of seeds per fruit) were recorded to compare among the five clusters. Data are presented as the mean ± SE. P < 0.05 was considered to indicate a statistically significant difference, indicated by different lowercase letters
were characterized by small and short-fruited peppers. The pericarp of accessions in cluster II was thinner than that of those in cluster I, whereas plant height and width were slightly larger than those of cluster I. The flowering date of cluster II was similar to that of accessions of cluster I and much earlier than that of cluster III. Acces-sions in cluster III were characterized by elongated fruits. Plant height and width were larger and flowering date was later when compared with those of accessions in clusters I and II. The species included in clusters IV and V also exhibited differences in fruit shape, where slightly smaller fruit and thicker pericarp were observed for cluster IV. Plant height and width of cluster IV were smaller than those of accessions of cluster V. Slightly wider fruits with thinner pericarp were observed for cluster V. Leaf size was much larger, and the flowering date was slightly later than those of accessions of cluster IV. Overall, accessions in clusters IV and V exhibited small fruits with slightly higher plant height and late flowering.
Discussion
Despite numerous Capsicum germplasm accessions hav-ing been documented worldwide, little is known about their population structure or genetic diversity in contrast to other crops. Previously, Capsicum germplasm collec-tions have been examined for genetic diversity using ac-cessions from Mesoamerica (Central Mexico to northwestern Costa Rica) to survey geographic origin and understand the domestication process [6, 38]. Re-cently, STRUCTURE analysis was performed in a Capsi-cum germplasm collection with 1,352 accessions, which was grouped into six distinct clusters based on genetic analysis with six SSR markers [14]. In the present study, a Capsicum germplasm collection consisting of 3,821 ac-cessions was divided into ten clusters by STRUCTURE analysis and five distinct groups by phylogenetic analysis (Figs. 1 and 2). The AMOVA analysis revealed that the genetic variance among and within the populations was significant (p≤ 0.01). Variance among populations and within a population of five phylogenetic groups were seven and 93 %, respectively and the variance among and within populations of ten STRUCTURE clusters were 31 and 69 %, respectively (Additional file 1: Table S7).
Both STRUCTURE and phylogenetic analyses showed that C. annuum accessions were separated from other species and sub-clustered into two large groups, one from European countries and the other from Asian countries. In comparison to the STRUCTURE analysis, the unrooted phylogenetic tree showed rather clear sep-aration according to geographic origin and species clas-sification. Accessions collected from Korea were spread in two clusters (clusters 6 and 7) as per the population structure analysis, whereas in the unrooted phylogenetic
tree accessions corresponding to those two clusters were placed in a same node. Clade E included species other than C. annuum and showed distinct grouping. C. chi-nense accessions were separated out from other species and closely placed next to C. annuum. In pepper breed-ing, agriculturally useful traits such as disease resistance, fragrance, yield, and pungency have been introgressed from wild species by interspecific hybridizations. Among the domesticated species, C. chinense has better cross-ability with C. annuum and is used as a bridge species between C. annuum and other species [39, 40]. The lo-cation of C. chinense in this tree, between C. annuum and other species, may explain why C. chinense has played a role as an interspecific cross-bridge. Based the topology of the phylogenic tree, C. annuum accessions in clade D (Fig. 2) are candidate to be used as interspe-cific bridges to introgress genes from other species.
In this study, we confirmed that C. galapagoense was located more closely with C. annuum than other species. However, other species such as C. baccatum, C. frutes-cens, C. pubesfrutes-cens, and C. chacoense were not clearly separated from each other (Fig. 2). In previous work [14], classification with SSR markers showed rather clear distinction of species. It may indicate that SSR markers are more prone to be affected by speciation and evolu-tion processes, whereas SNP markers are more appropri-ate for the analysis of genetic variation in various aspects of agronomic and morphological traits [41]. It is also possible that we did not use enough SNP markers to allow clear differentiation among species. In this study, we used 96 alleles to survey genetic diversity. The cost of genotyping of large germplasm collection is rela-tively expensive, therefore based on our preliminary studies with 412 SNPs [19], 48 SNPs with high PIC values were used for diversity study. Even though most of the SNP makers used in this study had high PIC values close to 0.5, SNP markers are less powerful than SSR markers in terms of relative kinship estimation and population structure analysis [42–44] because SSR markers have higher allelic diversity than SNP markers. To compensate for the small number of SNP markers, we also used 32 different traits which account for 264 phenotypic variations to build a core collection. Core collection built by more variations showed higher gen-etic diversity, evenness and representation. These results indicated that even with a small number of SNP markers used combination with diverse phenotypic data can be also effective to construct a core collection with the aim to conserve the phenotypic and genetic variability within species.
Representative core accessions have been selected in diverse crops using various sampling strategies com-bined with different clustering methods [15, 32, 45–47]. Among the strategies, the M strategy was reported to be
a useful method in selecting a core set conserving high genetic diversity with a reasonable size [45]. There are two representative core selection methods implementing the M strategy, namely the MSTRAT algorithm [48] and PowerCore software [30]. Here, we used the advanced M strategy as implemented in PowerCore 1.0 software and successfully established a representative core collection with high genetic diversity. The advanced M strategy is based on the M strategy with heuristic searching that enables retention of all variations of the entire collection in the core collection with a minimum number of acces-sions. This strategy is more effective when using con-tinuous variables in the dataset to capture a maximum of alleles with a minimum redundancy [30, 49].
Use of either genotype or phenotype information only for selection of core collection entries may not be effi-cient for capturing genetic diversity of the entire germ-plasm of a species. Therefore, we used both genotype and phenotype information along with clustering to se-lect core colse-lection entries. To determine the optimal core set selection methods, we compared five different methods and found that selection of the core set using genotype and phenotype data after clustering analysis (Gg + Pcc) is the best method (Table 3). Moreover, we investigated the relationship between the number of clusters and genetic diversity among different core sets in clustering analysis. Different combinations of clades A, B, C, D, and E from the unrooted phylogenetic tree (Fig. 2) and the 10 clusters from the population struc-ture analysis (Fig. 1) were considered to select a core set. Core sets selected from the cluster combinations in tree were named CG3, CG4, and CG5, respectively and CST10 were from the 10 clusters in STRUCTURE ana-lysis (Additional file 1: Table S8). From those core col-lections, 174 to 420 entries were selected. Every collection showed higher values of genetic diversity and evenness than the 3,821 germplasm collection; however, the core collections did not show statistically significant difference from each other (P > 0.05). Therefore, the number of clusters in the collection is not a critical fac-tor to select highly diverse core entries.
To reveal the phenotype variation in CC240, core ac-cessions were clustered into five distinct subclusters based on genotype relationship (Fig. 4). Among the five clusters, three of them (I, II, and III) represented C. annuum and other two (IV and V) included other spe-cies, such as C. baccatum, C. chinense, C. eximium, C. frutescens, and C. praetermissum without clear species distinction. In a previous study, Capsicum germplasm was divided into six clusters [14], in which three of them (1, 2, and 3) were composed of C. annuum accessions. Those three clusters were clearly distinguished mainly by fruit shape, such that cluster 1 was characterized by elongated fruited peppers, thin pericarp and late
flowering, whereas cluster 2 exhibited conical fruit and rather thick pericarp, and cluster 3 had large-fruited peppers with thick pericarp and elongated-fruited pep-pers. Consistent with Nicolai’s work [14], three clusters in CC240 found in this study were characterized by large fruit with thick pericarp, large leaves, and early flowering date in cluster I, small, short fruit, small leaves, and early flowering date in cluster II, and elongated fruit with thin pericarp, late flowering date in cluster III. Thus, it ap-pears that C. annuum accessions, which are mainly used as fundamental breeding materials, were clustered by breeding features based on food culture. Though, M strategy is the most powerful option for the selection of accessions with rich allelic diversity and for eliminating redundancies from noninformative alleles, it does not consider species composition while selecting core en-tries, which is a one of the disadvantage of the model based M strategy and therefore, future works should consider other measures of model fit including a rarefac-tion analysis, which corrects for sample sizes and man-ual inclusion of some representative wild species depending on the purpose of the core collection.
Conclusions
Establishing a core collection of Capsicum will enhance the proper utilization of Capsicum genetic resources. In the present study, based on population structure, a core collection (CC240) of Capsicum was constructed using 48 SNP markers and 32 different traits. The core collec-tion ‘CC240’ is composed of six Capsicum species from 44 geographic locations and was found to represent the diversity of the entire germplasm collection. This core collection will serve as a primary source for SNP mining and further genetic association and functional analyses for novel genes in Capsicum.
Additional files
Additional file 1: Table S1. Summary of SNP markers used in the genetic analysis of pepper germplasm collection. Table S2. Description of various traits used in this study. Table S3. Genetic diversity analysis of the 4,652 pepper accessions. Table S4. Distribution of Capsicum species in STRUCTURE clusters within 3,821 germplasm accessions. Table S5. Accession in the‘CC240’ core collection and group position of every accession in‘CC240’ and the 3,821 germplasm collection. Table S6. Multiple allelic markers used to evaluate the core collection in Capsicum. Table S7. Analysis of molecular variance (AMOVA) among various subpopulations based on different clustering methods within 3,821 Capsicum accessions. Table S8. Comparison among different core collections established by diverse genetic clustering methods. CG3-CG5: Core collections based on unrooted phylogenetic tree clusters (A to E) grouped by 3 (A + B, C, D + E), 4 (A + B, C, D, E), and 5 (A, B, C, D, E) in respectively. CST10: Core collection based on 10 clustered population structure as in Fig. 1. Evaluated parameters; MD %: the mean difference percentage, CR %: the coincidence rate, VD %: the variance difference percentage, VR %: variable rate, I: Shannon’s information index of diver-sity, J': Genetics evenness, I max: logarithmic number of classes in entire collection. (XLSX 51 kb)
Additional file 2: Distribution of 4,652 Capsicum germplasm accessions based on HO(observed heterozygosity). Accessions with an HOvalue of
more than 0.3 were considered as F1 hybrids. A total of 673 accessions were excluded from the fundamental germplasm collection to construct a core collection. (TIF 360 kb)
Additional file 3: Distribution of 3,821 germplasm accessions in population structure clusters according to their origin and geographic location. The colors of pie graph correspond to the clusters from STRUCTURE analysis as in Fig. 1. The area of each pie graph indicates the proportion of included accessions. (TIF 1168 kb)
Abbreviations
CR:Coincidence rate of range; CTAB: Cetyl trimethylammonium bromide; FST: Genetic differentiation; G + Pcc: Core entries based on the combination of
genotype and phenotype data; Gcc: Core entries based on SNP genotype data only; Gg + Pcc: Core entries based on the combination of genotype and phenotype data; Ggcc: Core entries in each cluster were selected based on genotype data only; HE: Expected heterozygosity; HO: Observed heterozygosity;
I: Shannon’s information index of diversity; J’: Genetic evenness; M strategy: Maximization strategy; MD: Mean difference percentage; Pcc: Core entries based on phenotype data only; PIC: Polymorphic information content; STA: Specific target amplification; VD: Variance difference percentage; VR: Variable rate of coefficient of variation
Acknowledgments
We are grateful to RDA-Genebank for kindly providing the plant materials with phenotype data and managing plants, and to Hyeon-Seok Jeong and Ho-Hyun Kim for helping with DNA extraction and SNP genotyping, and to Muhammad Irfan Siddique, Young-Shim Park, and Mira Lee for critical review of the manuscript.
Funding
This work was carried out with the support of“Cooperative Research Program for Agriculture Science & Technology Development (PJ01120401)” Rural Development Administration, Republic of Korea and grant (710001–07) from the Vegetable Breeding Research Center through Agriculture, Food and Rural Affairs Research Center Support Program, Ministry of Agriculture, Food and Rural Affairs.
Availability of data and materials
The datasets supporting the conclusions of this article are included within the article and its additional files.
Authors’ contributions
HYL participated in the design of the study, performed the DNA extractions, SNP genotyping, carried out genetic diversity analysis, population structure and phylogenetic analysis, constructed core collections, and drafted the manuscript. NYR participated in phenotyping and managed the phenotype dataset. HJJ participated in the conception of the study, SNP selection, data analysis, and helped in the discussion of results. JKK managed the project and revision of the manuscript. JKJ, YH, and AJ participated in extraction of DNA, genotyping for core collection evaluation, and made part of the figure. JWH participated in phenotyping. JV participated in revision of the manuscript. BCK participated in the conception of the study, discussion and revision of the manuscript. All authors have read and approved the final manuscript.
Competing interests
The authors declare that they have no competing interests. Consent for publication
Not applicable.
Ethics approval and consent to participate Not applicable.
Author details
1
Department of Plant Science and Vegetable Breeding Research Center, Seoul National University, Seoul 151-921, Korea.2National Academy of
Agricultural Science, Rural Development Administration, Jeonju 560-500, Korea.
Received: 23 June 2016 Accepted: 26 October 2016
References
1. Wahyuni Y, Ballester AR, Sudarmonowati E, Bino RJ, Bovy AG. Metabolite biodiversity in pepper (Capsicum) fruits of thirty-two diverse accessions: Variation in health-related compounds and implications for breeding. Phytochemistry. 2011;72:1358–70.
2. McCormack PL. Capsaicin dermal patch: in Non-diabetic peripheral neuropathic pain. Drugs. 2010;70:1831–42.
3. Gross BL, Olsen KM. Genetic perspectives on crop domestication. Trends Plant Sci. 2010;15:529–37.
4. Tang H, Sezen U, Paterson AH. Domestication and plant genomes. Curr Opin Plant Biol. 2010;13:160–6.
5. Rands MRW, Adams WM, Bennun L, Butchart SHM, Clements A, Coomes D, et al. Biodiversity conservation: challenges beyond 2010. Science. 2010;329: 1298–303.
6. Araceli AM, Morrell PL, Roose ML, Kim SC. Genetic diversity and structure in semiwild and domesticated chiles (Capsicum annuum; Solanaceae) from Mexico. Am J Bot. 2009;96:1190–202.
7. Frankel OH. Genetic perspectives of germplasm conservation. In: Arber W, Llimensee K, Peacock WJ, Starlinger P, editors. Genetic manipulation: impact on man and society. Cambridge: Cambridge University Press; 1984. 8. Odong TL, Jansen J, van Eeuwijk FA, van Hintum TJL. Quality of core
collections for effective utilisation of genetic resources review, discussion and interpretation. Theor Appl Genet. 2013;126:289–305.
9. Thies JA, Fery RL. Evaluation of a core of the U.S. Capsicum germplasm collection for reaction to the Northern root-knot nematode. HortScience. 2002;37:805–10.
10. Quenouille J, Saint-Felix L, Moury B, Palloix A. Diversity of genetic backgrounds modulating the durability of a major resistance gene. Analysis of a core collection of pepper landraces resistant to Potato virus Y. Mol Plant Pathol. 2016;17:296–302.
11. Hanson PM, Hanson PM, Yang R, Lin S, Tsou SCS, Lee TC, et al. Variation for antioxidant activity and antioxidants in a subset of AVRDC-the World Vegetable Center Capsicum core collection. Plant Genet Resour. 2004;2:153–66.
12. Zewdie Y, Tong N, Bosland P. Establishing a core collection of Capsicum using a cluster analysis with enlightened selection of accessions. Genet Resour Crop Evol. 2004;51:147–51.
13. Fan M, Chen S, Engle LM. The study on genetic diversity of the core collection for Capsicum using random amplified. J Agric Res China. 2004;53: 165–78.
14. Nicolaï M, Cantet M, Lefebvre V, Sage-Palloix AM, Palloix A. Genotyping a large collection of pepper (Capsicum spp.) with SSR loci brings new evidence for the wild origin of cultivated C. annuum and the structuring of genetic diversity by human selection of cultivar types. Genet Resour Crop Evol. 2013;60:2375–90.
15. Franco J, Crossa J, Taba S, Shands H. A sampling strategy for conserving genetic diversity when forming core subsets. Crop Sci. 2005;45:1035–44. 16. CGN downloadable data for pepper. http://cgn.websites.wur.nl/Website/
downloads/DownloadCnr38.htm. Accessed 15 May 2016.
17. AVGRIS (AVRDC Vegetable Genetic Resources Information System). http:// 203.64.245.173/search.asp. Accessed 15 May 2016.
18. Park SW, An SJ, Yang HB, Kwon JK, Kang BC. Optimization of high resolution melting analysis and discovery of single nucleotide polymorphism in Capsicum. Hortic Environ Biotechnol. 2009;50:31–9.
19. Kang JH, Yang HB, Jeong HS, Cheo P, Kwon JK, Kang BC. Single nucleotide polymorphism marker discovery from transcriptome sequencing for marker-assisted backcrossing in Capsicum. Kor J Hortic Sci Technol. 2014;32:535–43.
20. Wang J, Lin M, Crenshaw A, Hutchinson A, Hicks B, Yeager M, et al. High-throughput single nucleotide polymorphism genotyping using nanofluidic Dynamic Arrays. BMC Genomics. 2009;10:561.
21. Jeong HJ, Jo YD, Park SW, Kang BC. Identification of Capsicum species using SNP markers based on high resolution melting analysis. Genome. 2010;53:1029–40.
22. Hubisz MJ, Falush D, Stephens M, Pritchard JK. Inferring weak population structure with the assistance of sample group information. Mol Ecol Resour. 2009;9:1322–32.
23. Pritchard JK, Wen X, Falush D. Documentation for structure software: Version 2.3. Chicago: University of Chicago; 2010.
24. Evanno G, Regnaut S, Goudet J. Detecting the number of clusters of individuals using the software STRUCTURE: a simulation study. Mol Ecol. 2005;14:2611–20.
25. Perrier X, Jacquemoud-Collet JP. DARwin software. 2006. http://darwin.cirad. fr/darwin.
26. Liu K, Muse SV. PowerMarker: an integrated analysis environment for genetic marker analysis. Bioinformatics. 2005;21:2128–9.
27. Hennink S, Zeven AC. The interpretation of Nei and Shannon-Weaver within population variation indices. Euphytica. 1991;51:235–40.
28. Pielou EC. The measurement of diversity in different types of biological collections. J Theor Biol. 1966;15:177.
29. Peakall R, Smouse PE. GenALEx 6.5: Genetic analysis in Excel. Population genetic software for teaching and research-an update. Bioinformatics. 2012; 28:2537–9.
30. Kim KW, Chung HK, Cho GT, Ma KH, Chandrabalan D, Gwag JG, et al. PowerCore: a program applying the advanced M strategy with a heuristic search for establishing core sets. Bioinformatics. 2007;23:2155–62. 31. Sturges HA. The choice of a class interval. Am Stat Assoc. 1926;21:65–6. 32. Hu J, Zhu J, Xu HM. Methods of constructing core collections by stepwise
clustering with three sampling strategies based on the genotypic values of crops. Theor Appl Genet. 2000;101:264–8.
33. Sol Genomics Network. https://solgenomics.net/search/markers. Accessed 15 May 2016.
34. Yang HB, Liu WY, Kang WH, Jahn M, Kang BC. Development of SNP markers linked to the L locus in Capsicum spp. by a comparative genetic analysis. Mol Breed. 2009;24:433–46.
35. Hernández-Verdugo S, Luna-Reyes R, Oyama K. Genetic structure and differentiation of wild and domesticated populations of Capsicum annuum (Solanaceae) from Mexico. Plant Syst Evol. 2001;226:129–42.
36. Johnson MS, Black R. The Wahlund effect and the geographical scale of variation in the intertidal limpet Siphonaria sp. Mar Biol. 1984;79:295–302. 37. van Hintum TJL, Brown AHD, Spillane C, Hodgkin T. Core collections of
plant genetic resources. IPGRI Technical Bulletin. 2000;3:1–49. 38. González-Jara P, Moreno-Letelier A, Fraile A, Piñero D, García-Arenal F.
Impact of human management on the genetic variation of wild pepper, Capsicum annuum var. glabriusculum. PLoS ONE. 2011;6:e28715. 39. Manzur JP, Fita A, Prohens J, Rodríguez-Burruezo A. Successful wide
hybridization and introgression breeding in a diverse set of common peppers (Capsicum annuum) using different cultivated Ají (C. baccatum) accessions as donor parents. PLoS ONE. 2015;10:e0144142.
40. Martins KC, Nair T, Pereira S, Alessandro S, Souza M, Rodrigues R. Crossability and evaluation of incompatibility barriers in crosses between Capsicum species. Crop Breed Appl Biotechnol. 2015;15:139–45.
41. Keller I, Wagner CE, Greuter L, Mwaiko S, Selz OM, Sivasundar A, et al. Population genomic signatures of divergent adaptation, gene flow and hybrid speciation in the rapid radiation of Lake Victoria cichlid fishes. Mol Ecol. 2013;22:2848–63.
42. Yang X, Xu Y, Shah T, Li H, Han Z, Li J, et al. Comparison of SSRs and SNPs in assessment of genetic relatedness in maize. Genetica. 2011;139:1045–54. 43. Yu J, Zhang Z, Zhu C, Tabanao DA, Pressoir G, Tuinstra MR, et al. Simulation
appraisal of the adequacy of number of background markers for relationship estimation in association mapping. Plant Genome. 2009;2:63. 44. van Inghelandt D, Melchinger AE, Lebreton C, Stich B. Population structure
and genetic diversity in a commercial maize breeding program assessed with SSR and SNP markers. Theor Appl Genet. 2010;120:1289–99. 45. Marita JM, Rodriguez JM, Nienhuis J. Development of an algorithm
identifying maximally diverse core collections. Genet Resour Crop Evol. 2000;47:515–26.
46. Franco J, Crossa J, Warburton ML, Taba S. Sampling strategies for conserving maize diversity when forming core subsets using genetic markers. Crop Sci. 2006;46:854–64.
47. Wang JC, Hu J, Xu HM, Zhang S. A strategy on constructing core collections by least distance stepwise sampling. Theor Appl Genet. 2007;115:1–8. 48. Gouesnard B, Bataillon TM, Decoux G, Rozale C, Schoen DJ, David JL.
MSTRAT: an algorithm for building germ plasm core collections by maximizing allelic or phenotypic richness. J Hered. 2001;92:93–4. 49. Moe KT, Gwag JG, Park YJ. Efficiency of PowerCore in core set development
using amplified fragment length polymorphic markers in mung bean. Plant Breed. 2012;131:110–7.
• We accept pre-submission inquiries
• Our selector tool helps you to find the most relevant journal • We provide round the clock customer support
• Convenient online submission • Thorough peer review
• Inclusion in PubMed and all major indexing services • Maximum visibility for your research
Submit your manuscript at www.biomedcentral.com/submit