www.cdc.go.kr
2943
주간 건강과 질병•제13권 제40호
만성질환 통계
나트륨 섭취 현황, 1998∼2018
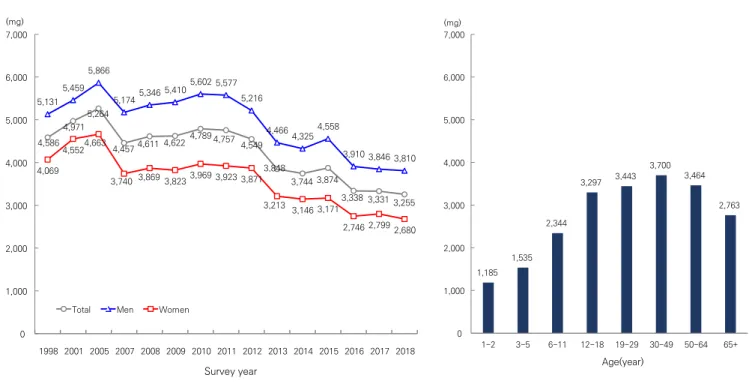
◈ 나트륨 섭취량은 2018년 3,255 mg으로 1998년(4,586 mg)에 비해 20년 간 2/3 수준으로 감소하였으나 여전히 목표섭취량(2,000 mg)의
2배임(그림 1), 나트륨 섭취량은 남자가 여자보다 높았으며 30, 40대에서 가장 높았음(그림 2).
4,586 4,971 5,264 4,457 4,6114,6224,789 4,7574,549 3,848 3,744 3,874 3,338 3,331 3,255 5,131 5,459 5,866 5,1745,346 5,410 5,602 5,577 5,216 4,466 4,3254,558 3,910 3,846 3,810 4,069 4,5524,663 3,740 3,869 3,8233,969 3,923 3,871 3,213 3,146 3,171 2,746 2,799 2,680 0 1,000 2,000 3,000 4,000 5,000 6,000 7,000 1998 2001 2005 2007 2008 2009 2010 2011 2012 2013 2014 2015 2016 2017 2018 전체 남자 여자 (mg) 조사연도그림 1. 나트륨 섭취량 추이, 1998∼2018
1,185 1,535 2,344 3,297 3,443 3,700 3,464 2,763 0 1,000 2,000 3,000 4,000 5,000 6,000 7,000 1~2 3~5 6~11 12~18 19~29 30~49 50~64 65+ (mg) 연령 (세)그림 2. 연령별 나트륨 섭취량, 2018
* 그림1의 연도별섭취량은 2005년 추계인구로 연령표준화
출처 : 2018 국민건강통계, http://knhanes.cdc.go.kr/
작성부서 : 질병관리청 만성질환관리국 건강영양조사분석과
www.cdc.go.kr
2944
주간 건강과 질병•제13권 제40호
만성질환 통계
Trends in intake of sodium, 1998-2018
◈ Sodium intake among Korean population aged 1 year and over was 3,255 mg, decrease to 2/3 of that in 1998 (4,586 mg), but it is still
twice the goal of sodium (2,000 mg) (Figure 1). Sodium intake was higher in men than in women, and the highest in their 30s and 40s
(Figure 2).
4,586 4,971 5,264 4,457 4,611 4,6224,789 4,757 4,549 3,848 3,744 3,874 3,338 3,331 3,255 5,131 5,459 5,866 5,1745,346 5,410 5,602 5,577 5,216 4,466 4,3254,558 3,910 3,846 3,810 4,069 4,5524,663 3,740 3,869 3,8233,969 3,923 3,871 3,213 3,146 3,171 2,746 2,799 2,680 0 1,000 2,000 3,000 4,000 5,000 6,000 7,000 1998 2001 2005 2007 2008 2009 2010 2011 2012 2013 2014 2015 2016 2017 2018 Total Men Women(mg)
Survey year
Figure 1. Trends in intake of sodium, 1998-2018
1,185 1,535 2,344 3,297 3,443 3,700 3,464 2,763 0 1,000 2,000 3,000 4,000 5,000 6,000 7,000 1-2 3-5 6-11 12-18 19-29 30-49 50-64 65+ (mg) Age(year)