저작자표시-비영리-변경금지 2.0 대한민국 이용자는 아래의 조건을 따르는 경우에 한하여 자유롭게 l 이 저작물을 복제, 배포, 전송, 전시, 공연 및 방송할 수 있습니다. 다음과 같은 조건을 따라야 합니다: l 귀하는, 이 저작물의 재이용이나 배포의 경우, 이 저작물에 적용된 이용허락조건 을 명확하게 나타내어야 합니다. l 저작권자로부터 별도의 허가를 받으면 이러한 조건들은 적용되지 않습니다. 저작권법에 따른 이용자의 권리는 위의 내용에 의하여 영향을 받지 않습니다. 이것은 이용허락규약(Legal Code)을 이해하기 쉽게 요약한 것입니다. Disclaimer 저작자표시. 귀하는 원저작자를 표시하여야 합니다. 비영리. 귀하는 이 저작물을 영리 목적으로 이용할 수 없습니다. 변경금지. 귀하는 이 저작물을 개작, 변형 또는 가공할 수 없습니다.
A Thesi
s
Fort
heDe
gr
eeofMast
erofVet
er
i
nar
yMedi
ci
ne
Thef
unct
i
onalr
ol
eandi
t
s
r
egul
at
i
onofgl
ut
amat
e
car
boxypept
i
daseI
Iexpr
essi
onon
ast
r
ocyt
ei
nexper
i
ment
al
aut
oi
mmuneencephal
omyel
i
t
i
s
GRADUATE SCHOOL
J
EJ
U NATI
ONAL UNI
VERSI
TY
Col
l
egeofVet
er
i
nar
yMedi
ci
ne
DanbeeHa
Thef
unct
i
onalr
ol
eandi
t
sr
egul
at
i
onof
gl
ut
amat
ecar
boxype
pt
i
daseI
Iexpr
essi
onon
ast
r
ocyt
ei
nexpe
r
i
ment
alaut
oi
mmune
e
nce
phal
omyel
i
t
i
s
DanbeeHa
(
Super
vi
sedbypr
of
e
ssorYounghe
unJ
ee)
A thesissubmittedinpartialfulfillmentoftherequirementforthedegreeof MasterofVeterinaryMedicine
2012.7.
Thisthesishasbeenexaminedandapprovedby
Thesisdirector,Hong-GuJoo,Prof.ofVeterinaryMedicine
Won-GeunSon,Prof.ofVeterinaryMedicine
YoungheunJee,Prof.ofVeterinaryMedicine
Col
l
e
geofVet
e
r
i
nar
yMedi
ci
ne
GRADUATE SCHOOL
J
EJ
U NATI
ONAL UNI
VERSI
TY
TABLE OF CONTENTS
Table of contents ... 1 List of Tables ... 2 List of Figures ... 3 List of abbreviations ... 4 Abstract ... 5 Introduction ... 6Materials and Methods ... 8
Results ... 15 Discussion ... 23 References ... 28 Tables ... 32 Figures ... 34 Abstract in Korean ... 46 Acknowledgements ... 47
LIST OF TABLES
Table 1. Primers sequences for IFN-γ, TNF-α, IL-17A, IL-4, IL-10, TGF-β and GAPDH
Table 2. Clinical features of experimental autoimmune encephalomyelitis -affected mice
LIST OF FIGURES
Figure 1. GCPII overexpressed in the peak stage of EAE.
Figure 2. GCPII overexpression was observed mainly on astrocytes. Figure 3. Inhibition of GCPII induced the resistance to EAE.
Figure 4. 2-PMPA attenuated GCPII overexpression in CNS while not affecting other glutamate-related enzymes.
Figure 5. 2-PMPA modulated the proliferation of splenic MNCs to MOG35-55
restimulation.
Figure 6. 2-PMPA altered the population of MNCs in periphery. Figure 7. 2-PMPA did not affect the population of regulatory T cells. Figure 8. 2-PMPA decreased the production of IL-17, IFN-γ and TNF-α in periphery.
Figure 9. 2-PMPA limited the infiltration of CD4+ and CD11b+ cells into CNS.
Figure 10. 2-PMPA suppressed mGluR1 expression in both CNS and periphery.
Figure 11. 2-PMPA mitigated gliosis in spinal cords of EAE-affected mice. Figure 12. Inhibition of astrocytic GCPII expression rescued EAE-affected mice from axonal dystrophy.
EAE Experimental autoimmune encephalomyelitis
MS Multiple sclerosis
CNS Central nervous system
GCPII Glutamate carboxypeptidase II
2-PMPA 2-Phosphonomethyl pentanedioic acid
NAAG N-acetylaspartylglutamate
NAA N-acetylaspartate
GDH glutamate dehydrogenase
GS glutamatine sythetase
iGluR Ionotropic glutamate receptor
mGluR Metabotropic glutamate receptor
MOG Myelin oligodendrocyte glycoprotein
GBP Guinea-pig myelin basic protein
PLP Proteolipid protein
Con A concanavalin A
MNC Mononuclear cell
Th cell T helper cell
Treg regulatory T cell
NF-H neurofilament heavy chain
GFAP glial fibrillary acidic protain
Iba-1 ionized calcium binding adaptor protein
CNPase 2’3’-cyclic-nucleotide 3’-phosphodiesterase
FACS Flow cytometry
ELISA Enzyme-linked immunosorbent assay
Real-time PCR Real-time polymerase chain reaction
FITC fluorescein isothiocyanate
PE phosphatidylethanolamine
DAPI 4',6-diamidino-2-phenylindole dihydrochloride
HRP horseradish peroxidase
DAB 3,3’-diaminbenzidine tetrachloride
1. ABSTRACT
Experimental autoimmune encephalomyelitis (EAE) is a demyelinating autoimmune disease murine model which presents clinical similarity to human multiple sclerosis (MS). Although glutamate-induced excitotoxicity has been implicated in the disease progression of MS patient, glutamate carboxipeptidase II (GCPII), an enzyme that produces glutamate and affects the pathogenesis of various neurological disorders, has not received proper attention in MS/EAE. In this study, we show that GCPII is a potent therapeutic target for MS/EAE. First, the expression of GCPII was significantly elevated on astrocytes of EAE mice proportional to the severity of EAE clinical sign. Furthermore, treatment with a specific GCPII inhibitor, 2-phosphonomethylpentanedioicacid (2-PMPA), resulted in significantly ameliorated paralysis with ensuing attenuation of EAE-associated neuropathic features. Upon antigen restimulation, lack of GCPII led to marked reduction in myelin-reactive T cell responses and T effector cell polarization in periphery. Moreover, GCPII inhibition favorably altered the expression of inducible metabotropic glutamate receptor 1 (mGluR1) on CD4+ T cells. These data suggest previously unreported interaction between astrocytic GCPII expression and critical EAE-associated features including neuroinflammation and highlight mGluR1 as one of key modulator of glutamate-induced T cell responses during EAE.
Key words: Glutamate carboxypeptidase II, Glutamate excitotoxicity, Experimental autoimmune encephalomyelitis(EAE)
2. INTRODUCTION
Experimental autoimmune encephalomyelitis (EAE) is an inflammatory disease in the murine central nervous system (CNS) which recapitulates the clinical and pathological features of human multiple sclerosis (MS) (Baxter 2007). Genetically susceptible strains of mice immunized with autoantigens such as myelin oligodendrocyte glycoprotein (MOG), myelin basic protein (MBP) and proteolipid protein (PLP) show pathognomonic neuroinflammation in which autoreactive inflammatory cells infiltrate into CNS followed by demyelination and axonal dystrophy. Although the pathogenesis of EAE is considered largely mediated by myelin-reactive T cells, there is emerging evidence for the involvement of neurotransmitter such as glutamate on the initiation of clinical impairment, axonal damage and oligodendrocytic death (Pitt et al. 2000). Furthermore, recent studies indicate that glutamate may serve as immunomodulator via signaling through G-protein coupled metabotropic glutamate receptors (mGluRs) (Fallarino et al. 2010; Hansen and Caspi 2010).
Glutamate carboxypeptidase II (GCPII) is a member of zinc metallopeptidases (Mesters et al. 2006) which initially described as NAALADase (N-acetylated alpha-linked acidic dipeptidase) for its catalytic ability to degrade the neuropeptide NAAG (N-acetylaspartylglutamate) into NAA (N-acetylaspartate) and glutamate in rat brain (Robinson et al. 1987). GCPII has been implicated in glutamatergic neurotransmission in nervous system, accompanying its association with various neuropathologic disorders including amyotrophic lateral sclerosis, Alzheimer’s disease, schizophrenia and pain (Ghadge et al. 2003; Kim et al. 2010; Zhou et al. 2005). In the adult rat CNS, the GCPII-positive cells coexpressed GFAP, an astrocytic marker, showing that astrocytes are the main cells to express GCPII (Berger
et al. 1999). However, the involvement of GCPII on the upregulated glutamate level in MS and EAE has not been elucidated. Rather, in the MS and EAE, the fundamental source responsible for increasing glutamate level in CNS has been reported to the glutaminase, the glutamate-producing enzyme expressed on activated macrophage/microglial cell lineage (Werner et al. 2001).
In the present study, the expression levels and the cell types expressing GCPII were explored in the CNS of EAE-affected animals presenting different clinical stages. Using pharmacological approach, we found that GCPII is involved in EAE-associated neuropathic features and modulates excessive immune response. Furthermore, 2-(phosphonomethyl)-pentapedioic acid (2-PMPA), a specific GCPII inhibitor, dampened the function of Th1 cell lineage and down-regulated mGluR1 expression in both periphery and CNS, thereby contributing to glutamate-mediated immune regulation. Our observations identify a sequence of events triggering EAE by GCPII overexpression which may offer a novel therapeutic approach to the treatment of MS.
3. MATERIALS AND METHODS
Animals
Female C57BL/6 mice, 6-7 weeks of age, were purchased from Orientbio, Inc. (Sungnam, Korea) and weighed 18-22g when used for experiments. Female Lewis rats were purchased from SLC Japan (Shizuoka, Japan) and used at 8-12 weeks of age. Animals were housed in conventional animal facilities with an NIH-07-approved diet and water ad libitum at a constant temperature (23 ± 1ºC) according to the guidelines for the Care and Use of Laboratory Animals of the Institutional Ethical Committee of Jeju National University.
Induction and clinical evaluation of EAE
Synthetic proteolipid protein (MOG)35-55 peptide (M-E-V-G-W-Y-R-S-
P-F-S-R-V-V-H-L-Y-R-N-G-K) was purchased from Biosynthesis Inc. (Lewisville, TX, USA). Mice were injected subcutaneously with 200 µg of MOG35-55 peptide in complete Freund's adjuvant (CFA) (Difco, Detroit, MI)
containing 500 µg of heat-inactivated Mycobacterium tuberculosis on day 0, supplemented by intravenous injections of 200 ng of pertussis toxin on day 2 (List Biologic, Campbell, CA, USA). EAE was induced in Lewis rats as described previously (Ohmori et al. 1992). Briefly, each rat was subcutaneously injected in both hind footpads with an emulsion containing 100 mg of guinea-pig myelin basic protein (GBP) in CFA (5mg/ml). On the day of immunization, the rats received 2 g of pertussis toxin intraperitoneally. The immunized animals were observed daily for clinical signs of disease up to day 19 post-immunization, and scored on an arbitrary scale of 0 to 5 as follows: 0, no clinical signs; 1, flaccid tail; 2, hind limb weakness or abnormal gait; 3, complete hind limb paralysis; 4, complete hind
limb paralysis with forelimb weakness or paralysis; 5, moribund or deceased (Liu et al. 2005a).
2-PMPA treatment
2-(phosphonomethyl)-pentapedioic acid (2-PMPA) was purchased from Enzo Life Sciences Inc. (Plymouth Meeting, PA, USA). For treatment, 2-PMPA (10 mg/kg) dissolved in phosphate-buffered saline (PBS) was injected into each mouse intraperitoneally twice a week from the day of inoculation with MOG35-55 until the termination of experiments (Kim et al.
2010). Control mice were injected with equal volume of PBS.
Preparation of tissue and histological analysis
Spinal cords were harvested at the end of each experiment, fixed in 10% formalin, and embedded in paraffin. Five-micrometer paraffin sections were stained with hematoxylin and eosin (H&E) for visualization of inflammatory infiltrates. The extent of inflammation was estimated with 3 to 4 areas per tissue section of each mouse (at ⅹ100 magnification), and expressed as mean ± SE. Histological findings were graded into four categories (1, leptomeningeal infiltration; 2, mild perivascular cuffing; 3, extensive perivascular cuffing; 4, extensive perivascular cuffing and severe parenchymal cell infiltration) (Sakuma et al. 2004).
Cell culture and proliferation assay
Spleen mononuclear cells were suspended in culture medium containing RPMI-1640 medium (Gibco, Paisley, UK) supplemented with 10% (v/v) fetal bovine serum (FBS) and 100U/ml antibiotics (both from Gibco). Spleen mononuclear cell suspensions containing 4 × 10⁵ cells in 200 µl culture medium were placed in 96-well round-bottom microtiter plates
(Nunc, Copenhagen, Denmark). MOG35-55 peptide (10 µg/ml), PLP139-151
peptide (10 µg/ml) or concanavalin A (Con A) (5 µg/ml, Sigma, St. Louis, MO, USA) was then added into triplicate wells. After 3 days of incubation, cells were pulsed for 18 hours with 10 μl aliquots containing 1 μCi of 3H-methylthymidine (specific activity 42 Ci/mmol; Amersham, Arlington Heights, IL, USA). Cells were harvested onto glass fiber filters, and the amount of thymidine incorporated into DNA was measured by liquid scintillation spectrometer (Wallac Micro Beta® TriLux, Perkin Elmer, Waltham, MA, USA). The results were expressed as count per minute (CPM) (Jee et al. 2007).
Flow cytometry
Whole blood of was collected in a syringe containing heparin through cardiac puncture and centrifuged at 1,500 rpm twice for collecting mononuclear cells. Single cell suspensions of spleen and blood (both contained 1 × 10⁶ cells) were stained with mAbs directly labeled with one of following fluorescent tags; fluorescein isothiocyanate (FITC), phosphatidylethanolamine(PE); CD3 (145-2c11), CD4 (H129.19), CD8 (53-6.7), CD45 (Ly-5), CD11b (M1/70) (BD Biosciences, San Jose, CA, USA) and CD25 (PC61.5) (eBioscience, San Diego, CA, USA). Appropriate isotype controls (mouse IgG, Sigma) were always included. Twenty thousand viable cells per mouse (as determined by light scatter profiles) were analyzed by using BD FACS CaliburTM flow cytometer (BD Biosciences). The absolute number of a particular cell subset was calculated by counting the mean of total number of mononuclear cells isolated from spleen or blood per mouse (Jee et al. 2007).
Spleen mononuclear cell suspensions containing 4 × 10⁵ cells in 200 µl culture medium were placed in 96-well round-bottom microtiter plates with 5 g/ml of MOG35-55 (Ephrem et al. 2008). Supernatants were collected after
48 hours, and the production of IFN-γ, TNF-α (both from BioSource International, Camarillo, CA, USA) and IL-17 (eBioscience) was measured using mouse cytokine-specific ELISA kits according to the manufacturer's instructions.
Real-time polymerase chain reaction (Real-time PCR)
Total RNA was extracted from spinal cords and spleen with TRIZOL reagent (Invitrogen) according to the manufacturer’s instructions. Two microgram of total RNA was synthesized into 50 ng/μl cDNA with reverse transcription system (Promega, Madison, WI, USA), and 10 ng of cDNA was used for PCR amplification. The expression of the genes encoding IFN-γ, TNF-α, IL-17A, IL-4, IL-10, TGF-β, GAPDH and Grm1 was quantified by real-time PCR with SYBR Green PCR master mix (Applied Biosystems, Warrington, UK) on an ABI StepOnePlus™ (Applied Biosystems). Primer sequences were summarized in Table 1. The pre-designed QuantiTect primers for Grm1 (NM016976) were purchased from Qiagen (Hilden,Germany). All gene expression results were normalized to the expression of housekeeping gene GAPDH by subtracting the cycle threshold (Ct) value of GAPDH from the Ct value of the gene of interest using the REST program (Qiagen). The fold change against control was represented by taking that of the control EAE sample as 1 (Liu et al. 2005b).
Western blot analysis
minced, homogenized with a buffer containing of 40 mM Tris-HCL, pH 7.4 and 120 mM NaCl containing the protease inhibitor (1 mM PMSF, 10 µg/ml leupeptin, 10 µg/ml aprotinin, and 2 mM Na3VO4). Equal amounts of protein (80 µg/well) were loaded in each lane and electrophoresed under denaturing conditions in sodium dodecyl sulfate-polyacrylamide gels (SDS-PAGE). After electrophoresis, the proteins were electrotransferred onto nitrocellulose transfer membranes (Schleicher and Schuell, Keene, NH, USA). After blocking with 2% nonfat milk, the blots were incubated with GCPII (1:500), Glutaminase (1:1000, Proteintech, Chicago, IL, USA), Glutamate dehydrogenase (1:1000, Proteintech), Glutamine synthetase (1:500, Millipore, Billerica, MA, USA), foxp3 (1:1000, ebioscience), mGluR1 (1:1000, cell signaling, Danver, MA, USA) and β-actin (1:1000, Sigma) for 60 min followed by incubation with horseradish peroxidase (HRP)-conjugated anti-mouse, rabbit IgG (1:2000, Invitrogen, Carlsbad, CA, USA) for 45 min. A polyclonal rabbit anti-rat/mouse GCPII was provided by S. AhnJo (Dankook University, Cheonan, South Korea). Visualization was achieved using Westzol detection system (iNtRON Biotechnology, Sungnam, Korea). The results were quantified with Image J software (NIH, Bethesda, MA, USA).
Immunohistochemistry
Paraffin-embedded spinal cord sections were deparaffinized and rehydrated using standard methods, and endogenous peroxidase blocking reaction was performed by exposing sections 30 min in the 3% H2O2 solution. Sections were then washed with PBS and incubated with normal goat serum for 20 min. After blocking unspecific bindings, sections were allowed to react with rabbit anti-rat/mouse GCPII (1:500) or mouse anti-mouse nonphosphorylated neurofilament-H (NF-H) antibody (SMI-32, 1:1000, Convance Inc., Carnegie Center Princeton, NJ, USA) overnight at 4℃. Biotinylated goat anti-rabbit
IgG or rabbit anti-mouse IgG followed by avidin-biotin-peroxidase complexes (Vector Laboratories, Burlingame, CA, USA) were used as secondary antibodies. HRP binding sites were detected with 3,3’-diaminbenzidine tetrachloride (DAB; Vector), and counterstained with hematoxylin. Slides were examined using light microscope (LeicaDM LB2, Leica, Wetzler, Germany).
Immunofluorescent staining
For detection of GCPII immunoreactivity and localizaion in spinal cords of rat and mice, rabbit anti-rat/mouse GCPII (1:500) together with mouse anti-mouse GFAP (1:500, Novus Biologicals, Littleton, CO, USA) followed by appropriate secondary antibodies were used (Noorbakhsh et al. 2006). For detection of T lymphocyte and macrophage immunoreactivity, rabbit anti-mouse CD4 (1:200, Novus Biologicals) and rat anti-mouse CD11b (1:100, Serotec Biotechnology, Oxford, UK) were used. Gliosis were examined using mouse anti-mouse GFAP (1:500, Novus Biologicals), rabbit anti-mouse Iba-1(1:200, Wako, Osaka, Japan) and mouse anti-mouse CNPase (1:1000, Covance, Princeton, NJ, USA) as primary antibodies. For secondary antibodies, biotin-conjugated anti-rabbit IgG (1:100, Abcam, Cambrige, UK) followed by STAV-TRITC (1:200, Zymed Laboratories, Carlton court, CA, USA) and antibodies directly conjugated with FITC at dilution 1:100; anti-mouse IgG (Santa Cruz Biotechnologies), anti-rabbit IgG (Sigma) and anti-rat IgG (Santa Cruz Biotechnologies) were used. To identify mGluR1 localization on various cells and structure of spinal cords, sections were incubated with rabbit anti-mouse mGluR1 (1:500, Cell signaling) followed by rabbit anti-mouse CD4 (1:100, Novus Biologicals), mouse anti-mouse GFAP (1:500, Novus Biologicals) and mouse anti-mouse NH-F (1:1000, Convance Inc). Then, sections were allowed to react with appropriate secondary
antibodies. Finally, sections were counterstained with 4',6-diamidino-2- phenylindoledihydrochloride (DAPI, 1:2000, Sigma) and observed under a fluorescent microscope (LeicaDM LB2, Leica) with appropriate filters. Images were obtained using Olympus DP-72 microscope camera (Olympus, Tokyo, Japan) and assembled using Adobe Photoshop™ software. Semiquantitative analysis of CD4 and CD11b reactivity was performed using Image J software (NIH, USA). Two to three sections per animal were examined under lower magnification microscope (ⅹ100 magnification), and the three lesions showing the most representative expression from sections were analyzed under higher magnification (ⅹ200 magnification) to count positive cells, as previously reported method with a slight modification (Nataf et al. 2000).
Statistical analysis
The results were presented as means ± standard error (SE) for each group with 5-6 animals. Statistical significance between groups was analyzed using one-way analysis of variance (ANOVA) followed by Student’s t-test, and p < 0.05 was considered statistically significant.
4. RESULTS
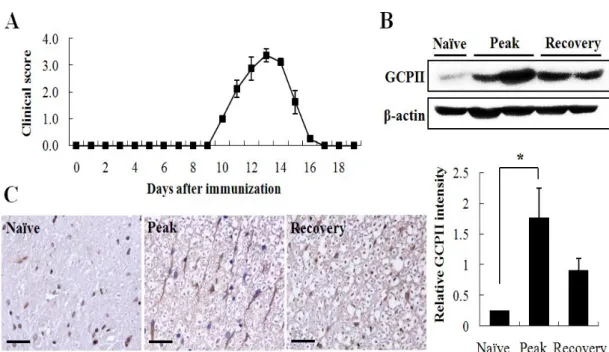
GCPII is overexpressed on astrocytes during the peak stage of EAE
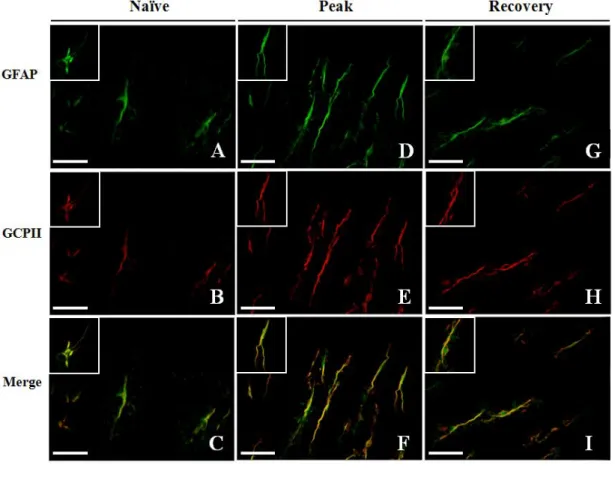
Several preceding studies note that GCPII is expressed exclusively on astrocytes in the adult rat nervous system (Berger et al. 1999; Luthi-Carter et al. 1998). To investigate the change of GCPII expression in the neuroinflammatory process associated with EAE, we performed western blot analysis with the spinal cords of EAE-affected Lewis rats of different clinical stages (Fig. 1A, day 13 and day 19 p.i represent peak and recovery stage, respectively). The results showed significantly higher GCPII expression levels in EAE-affected Lewis rats compared with naïve (unaffected) control rats, especially in the peak stage (Fig. 1B). Immunohistochemical staining showed that GCPII immunoreactivity was markedly enhanced in astrocytes of the spinal cords of peak stage rats compared with naïve control or recovery stage rats (Fig. 1C). Indeed, GCPII immunoreactivity was primarily colocalized with glial fibrillary acidic protein (GFAP), an astrocytic marker, in the gray matter of spinal cords (Fig. 2), in support of previous studies. Further, the expression level of GCPII was greater in peak stage rats (Fig.2 middle panel) compared to either naïve control (Fig.2 left panel) or recovery stage rats (Fig.2 right panel). These observations indicated that astrocytes are the chief cells that express GCPII in the spinal cords of EAE-affected Lewis rats and GCPII is overexpressed on astrocytes during the peak stage of the disease concomitant with gliosis of astrocytes.
2-PMPA, a specific GCPII inhibitor, protects mice against EAE.
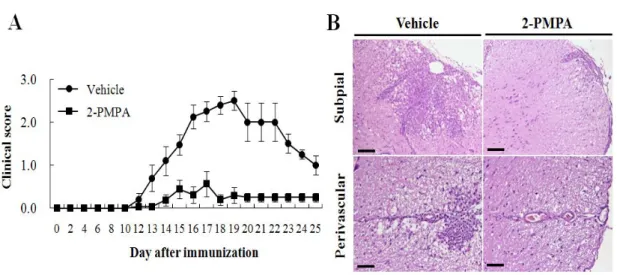
We tested whether inhibition of GCPII by its specific inhibitor 2-PMPA can modulate EAE using C57BL/6 mice immunized with MOG35-55. Results from
four separate experiments of clinical evaluation shown in Fig. 3A and in Table 1 indicate that 2-PMPA effectively reduced the severity of EAE; the maximal clinical score was attenuated to 0.8 ± 0.3 in 2-PMPA-treated EAE mice compared to that of vehicle-treated EAE mice (2.7 ± 0.2). Furthermore, in vehicle-treated mice, EAE developed by day 13 after immunization whereas 2-PMPA-treated mice delayed the onset of clinical symptoms to day 17.
Consistent with these clinical findings, histopathological examination of the spinal cords of vehicle- and 2-PMPA-treated mice revealed significant difference. Vehicle-treated EAE mice had a wide distribution of infiltrating inflammatory cells in areas adjacent to the subpial and perivascular region and within parenchyma (Fig. 3B, left panel). However, infiltration of inflammatory cells into CNS through subpial and perivascular region was merely detected in the spinal cords of 2-PMPA-treated EAE mice (Fig. 3B, right panel). The mean histological scores were 2.6 ± 0.2 in vehicle-treated mice and 1.4 ± 0.2 in 2-PMPA-treated mice (p < 0.005). Hence, these findings indicate that inhibition of GCPII by its inhibitor, 2-PMPA, significantly ameliorated the severity of clinical symptoms of EAE and EAE-associated neuroinflammation.
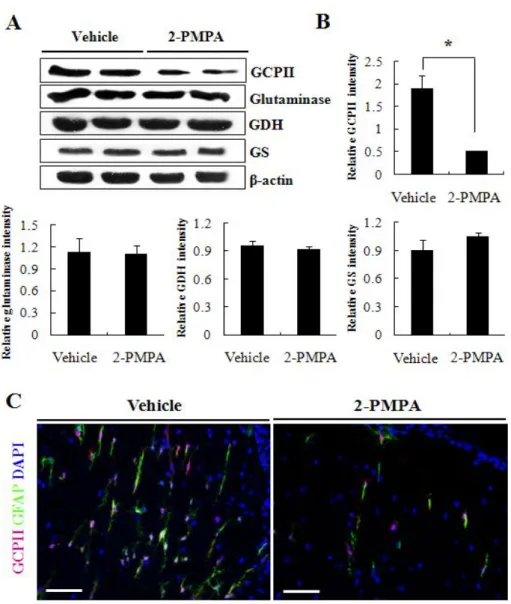
2-PMPA treatment affects astrocytic GCPII expression only
In the CNS of MS patients, the elevated glutamate production on macrophage/microglia was previously attributed to the enhanced expression of glutamate-producing enzyme, glutaminase (Werner et al. 2001). Werner et al. also reported that reduced expression of oligodendrocytic glutamate-metabolizing enzymes, glutamate dehydrogenase (GDH) and glutamatine sythetase (GS), aggravated glutamate excitotoxicity. Given that 2-PMPA treatment contributed to the attenuation in disease severity and
neuroinflammation of EAE-affected mice, we next investigated the expression of various glutamate-related enzymes to validate that the treatment affected GCPII only. As Fig. 4A and B depicts, western blot analysis showed significantly lower GCPII expression levels in the CNS of vehicle-treated mice compared with 2-PMPA-treated mice whereas the expression of glutaminase did not vary between the two groups. In addition, similar expression level of glutamate-metabolizing enzymes, GDH and GS, was observed in vehicle- and 2-PMPA-treated mice. Furthermore, 2-PMPA-treated mice presented markedly reduced immunoreactivity for both GFAP and GCPII compared with vehicle-treated mice (Fig. 4C). These results clearly indicate that 2-PMPA favorably altered the glutamate homeostasis by inhibiting only the GCPII overexpression on astrocytes and limited the extent of EAE together with neuroinflammation.
Inhibition of astrocytic GCPII expression alters the myelin-reactive T cell response in periphery
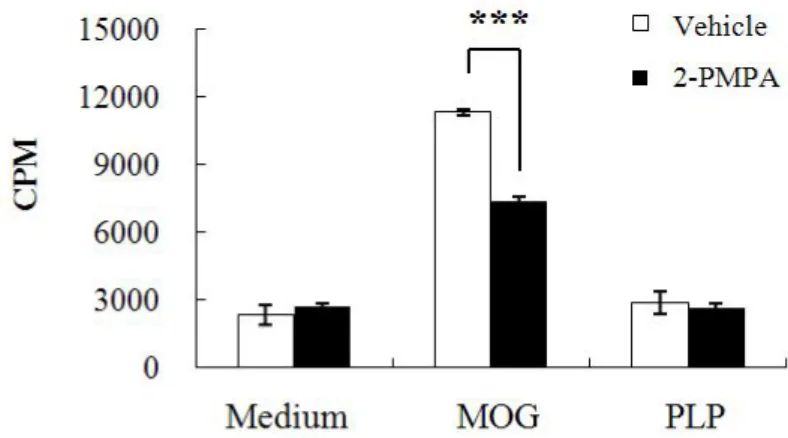
The generation and subsequent infiltration of peripheral myelin-reactive T cells into CNS has been recognized as a chief event in EAE and MS pathogenesis (Stinissen et al. 1998). To investigate the changes in the proliferation and cell population of mononuclear cells (MNCs) in periphery after GCPII inhibition, we first measured the 3H-thymidie incorporation in splenic MNCs and noticed that the proliferation of splenic MNCs in response to MOG35-55 peptide was significantly higher in vehicle-treated mice
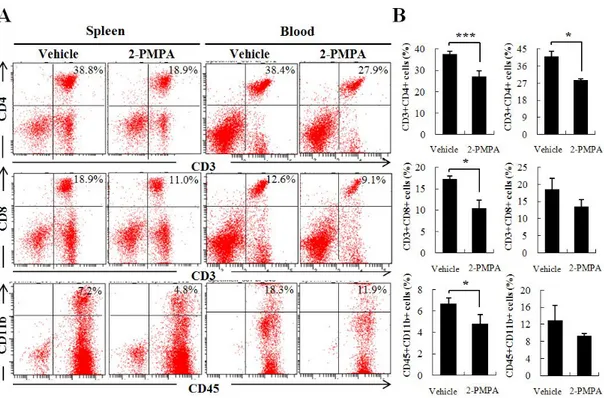
compared with that in 2-PMPA-treated mice (Fig. 5). In contrast, neither MNCs in spleen of vehicle-treated mice nor those of 2-PMPA-treated mice showed difference in cell proliferation when pulsed with PLP, a neuroantigen which shows different genetic susceptibility. Furthermore, the frequency of splenic CD3+CD4+ and CD3+CD8+ T cells and MNCs double-positive for
CD45 and CD11b were decreased significantly in 2-PMPA-treated mice compared to that in vehicle-treated mice (Fig.6A and B, left panel). In line with these results, CD3+CD4+ T cells showed marked decline in peripheral blood of 2-PMPA-treated mice compared with that of vehicle-treated mice. 2-PMPA also mitigated the population of CD3+CD8+ T cells and that of CD45+CD11b+ macrophages among peripheral blood mononuclear cells (PBMCs) but the change was not significant (Fig.6A and B, right panel). These data indicate that GCPII inhibition impeded the proliferation of autoreactive MNCs during Ag restimulation by suppressing the expansion of CD4+ T cells.
To assess the possibility that 2-PMPA might regulate MOG-reactive T cell response via the induction of regulatory T cells (Tregs), we quantified the number of Tregs in spleen of both groups. As Fig. 7A illustrates, comparison of vehicle-treated and 2-PMPA-treated mice showed no difference in the frequency of CD4+CD25+ and CD8+CD25+ Tregs. Additionally, the expression of foxp3, the transcriptional factor considered to determine the differentiation and regulatory phenotype of Tregs (Miyara et al. 2009), was not different in response to 2-PMPA treatment in spinal cord of EAE-affected mice (Fig. 7B). These results display that GCPII inhibition sustained peripheral tolerance against excessive Ag stimulation without altering Treg activity.
Reduced astrocytic GCPII expression is involved in T effector cell polarization
To evaluate the effect of GCPII inhibition in functional change of splenic MNCs, we performed real-time PCR for various cytokines. As depicted in Fig. 8A, the transcriptional level of IL-17, a representative Th17 cytokine, showed almost 50-fold decrease in the spleen of 2-PMPA-treated mice compared with that of vehicle-treated mice. Also, almost 10-fold decrease in
the transcript encoding IFN-γ was observed in the spleen of 2-PMPA-treated mice compared to that of vehicle-treated mice along with 5-fold decrease of TNF-α. However, the transcript level of IL-4 displayed no significant difference between the two groups and those of IL-10 and TGF-β, cytokines functioning suppressive effects, were not detected in either of groups.
Consistent with these results, supernatants obtained from splenic MNCs of both groups cultured in the presence of MOG35-55 showed significantly decreased production of IL-17 in 2-PMPA-treated mice compared with that in vehicle-treated mice (Fig 8B, left panel). The production of IFN-γ and TNF-α was also significantly down-regulated in 2-PMPA-treated mice (Fig 8B, middle and right panel, respectively). Thus, we identified that Th17 and Th1 cells but not Th2 cells were the major subpopulation affected by impaired glutamate production from GCPII inhibition.
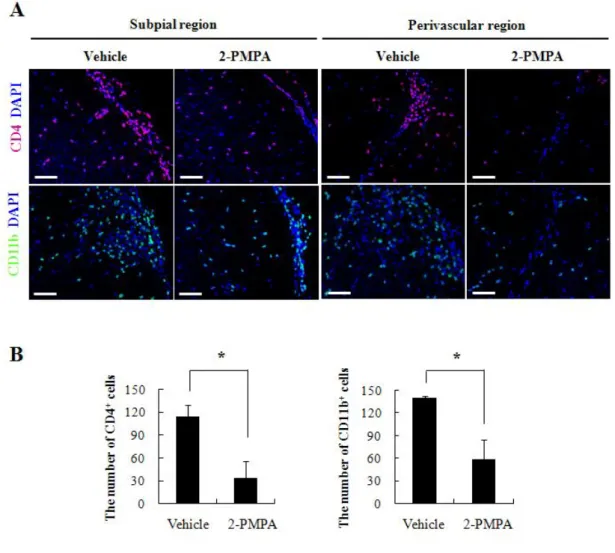
GCPII inhibition alters the number of infiltrated CD4+ T cells and CD11b+ macrophages in CNS
To verify the specific cell population whose infiltration was attenuated by GCPII inhibition, we assessed the immunoreactivity of CD4+ T cells and CD11b+ macrophages in spinal cords of each group. In 2-PMPA-treated mice, the infiltration of CD4+ T cells through both subpial and perivascular regions was significantly diminished compared to that in vehicle-treated mice (Fig. 9A, upper panel). CD11b+ macrophages were also found in both subpial and perivascular regions, with 2-PMPA-treated mice showing markedly lower infiltration of immunopositive cells compared with vehicle-treated mice (Fig. 9A, lower panel). Quantitative analysis confirmed that significantly lower number of CD4+ T cells (114 ± 16 cells/mm2 vs 33.5 ± 22.5 cells/mm2) and CD11b+ macrophages (140 ± 2 cells/mm2 vs 58 ± 27 cells/mm2)
presented in 2-PMPA-treated mice compared to vehicle-treated mice (Fig. 9B). These results indicate that GCPII inhibition likely contributed to subsequent reduction in the infiltration of T cells and macrophages into CNS by impairing cell proliferation and inflammatory phenotype deviation in periphery during EAE.
Altered glutamate production by GCPII inhibition suppresses mGluR1 expression in both CNS and periphery
Several preceeding studies noted that mGluR1 mediates T cell-DC interaction which results in promoted T cell proliferation and proinflammatory cytokine production such as IFN-γ (Pacheco et al. 2006). However, increased expression of mGluR1 in CNS of MS patients has only reported in dystrophic axons and subpopulation of astrocytes (Geurts et al. 2003). Prompted by the results indicating that 2-PMPA inhibited CD4+ T cells in both CNS and periphery of EAE-affected mice, we assessed the change in mGluR1 expression after GCPII inhibition. When the expression of Grm1 was examined by real-time PCR, 2-PMPA-treated mice displayed a significant decrease in Grm1 level of spinal cords compared to that of vehicle-treated mice (Fig. 10A). Expression of Grm1 in spleen of 2-PMPA-treated mice also presented marked reduction relative to that of vehicle-treated mice. Reinforcing these results, western blot analysis of mGluR1 expression in both spinal cords and spleens of each group revealed notably declined mGluR1 expression by 2-PMPA treatment (Fig. 10B).
In keeping with the possibility that GCPII inhibition might affect CD4+ T cell response by regulating mGluR1 expression, we detected mGluR1-positive CD4+ T cells, SMI-32+ nonphosphorylated axons (Trapp et al. 1998), GFAP+ astrocytes in spinal cords of each group. In vehicle-treated mice, mGluR1 immunoreactivity was chiefly detected on infiltrating CD4+ T cells together
with dystrophic axons in gray matter of spinal cords (Fig. 10C). On the other hand, the number of mGluR1-positive CD4+ T cells in CNS of 2-PMPA-treated mice was notably lower than that of vehicle-treated mice. 2-PMPA treatment also resulted in marked down-regulation of mGluR1 expression on dystrophic axons. In support of previous studies, only subpopulation of GFAP+ astrocytes presented mGluR1 immunoreactivity showing no obvious difference between groups. These observations indicate that CD4+ T cells were the chief cells to express mGluR1 in both spleens and spinal cords of EAE-affected mice and mGluR1 worked as one of the key modulator of glutamate-induced T cell responses after GCPII inhibition.
Inhibition of GCPII impacts on gliosis without affecting oligodendrocytic death Macrophage/microglial activation and astrocytosis are two key neuropathologic features in MS and EAE (Bruck 2005). To investigate the change of glial cells in spinal cords of both groups, we examined the immunoreactivity of GFAP, ionized calcium binding adaptor protein (Iba-1) and 2’3’-cyclic-nucleotide 3’-phosphodiesterase (CNPase). In agreement with previous reports, vehicle-treated EAE control mice showed markedly enhanced macrophage/microglial activation and much severer astrocytosis (Fig. 11, left panel) in which glial cells presented profound hyperplasia with a concomitant hypertrophy. In contrast, the number of GFAP+ astrocytes and Iba-1+ microglias showed significant reduction in 2-PMPA-treated EAE mice (Fig. 11, right panel). In addition, both GFAP+ astrocytes and Iba-1+ microglias of 2-PMPA-treated EAE mice showed relatively less activated morphology compared to notable hypertrophy observed in vehicle-treated EAE control. However, the CNPase immunoreactivity on oligodendrocytes remained unchanged by 2-PMPA treatment. These findings indicate that GCPII inhibition ameliorated both macrophage/microglial activation and
astrocytosis in the CNS during MOG-induced EAE but not affected oligodendrocytic death.
Decreased GCPII expression prevents axonal dystrophy at the peak stage of EAE
Myelin loss and subsequent axonal dystrophy is closely associated with the infiltration of peripheral immunocytes and excessive glial activation in the CNS of MS patient (Bruck 2005). Based on the results indicating that 2-PMPA ameliorated both neuroinflammation and gliosis, we assumed GCPII inhibtion might prevent axonal dystrophy in the CNS of EAE-affected mice. In vehicle-treated mice, significant number of axons reacted to SMI-32 antibody (Fig. 12A) whereas it was markedly decreased by 2-PMPA treatment (Fig. 12B). Concomitantly, aggregates of nonphosphorylated axons which often appeared beadlike appearance and were recognized as indicators of axonal dystrophy (Trapp et al. 1998) were barely detected in 2-PMPA-treated mice compared to vehicle-treated mice (Fig. 12C and D). Our results demonstrate that GCPII inhibition protected axons from abnormal dephosphorylation by favorably altering mGluR1 expression in both CNS and periphery, which prevented excessive immune response and by attenuating gliosis during EAE.
5. DISCUSSION
This study highlights a critical link between astrocytic GCPII expression and glutamate excitotoxicity in EAE. We have demonstrated that GCPII is overexpressed in the CNS of EAE-affected animal in which it is chiefly expressed on reactive astrocytes. We further identified that reduced glutamate production by GCPII inhibition ameliorates EAE severity and detrimental axonal dystrophy in response to active Ag immunization by inhibiting excessive T cell response and gliosis. The inhibitory effect of glutamate on T cell immunity reported in this study appeared to be largely the result of direct mediation by mGluR1.
It is widely recognized that myelin-reactive T cells infiltrate into the CNS during MS/EAE demyelination through the release of proinflammatory cytokines together with recruiting and activating macrophages (Bauer et al. 1995). However, other mechanisms have also been proposed such that glutamate excitotoxicity, the neuronal damage induced by altered glutamate metabolism, can initiate clinical impairment, axonal damage and oligodendrocytic death (Pitt et al. 2000). Indeed, several studies have reported the augmented glutamate levels in the cerebrospinal fluid (CSF) and in the brain of MS patients (Centonze et al. 2010) and indicated that enhanced expression of glutaminase on activated macrophage/microglial cells together with decreased detoxification through glutamate-metabolizing enzymes such as GDH and GS that expressed on oligodendrocytes are potent determinants of glutamate excitotoxicity (Werner et al. 2001). However, the involvement of astrocytes on glutamate excitotoxicity has been focused on glutamate transproters such as GLAST and GLT-1 which are down-regulated during the course of MS/EAE (Ohgoh et al. 2002).
pathogenesis of various neuropathologic disorders based on its property to produce glutamate (Ghadge et al. 2003; Zhou et al. 2005). However, the effect of GCPII on MS/EAE pathogenesis in the context of upregulated glutamate level has not been elucidated. In this study, we found that GCPII is overexpressed proportional to EAE severity and GCPII immunoreactivity was exclusively detected on reactive astrocytes in agreement with prior studies (Berger et al. 1999). Furthermore, we also observed drastically reduced EAE clinical symptom and neuroinflammation in 2-PMPA-treated EAE mice as a consequence of impairing GCPII expression on astrocytes without affecting other glutamate-related enzymes. Indeed, these observations could be interpreted two reciprocal mechanisms by which impeded GCPII expression affects the underlying glutamate excitotoxicity in EAE. It is also plausible that intact NAAG peptide, the negative modulator of glutamatergic neurotransmission, contributed indirectly to glutamate excitotoxicity as a weak partial agonist for NMDA (N-methyl D-aspartate) receptors or as an agonist for mGluR3 (Luthi-Carter et al. 1998).
Glutamate stimulates two types of glutamate receptors expressed on various cell types, ionotropic glutamate receptors (iGluRs), the ligand-gated ion channels, and metabotropic glutamate receptors (mGluRs), the G-protein coupled receptors, respectively (Nakanishi 1992). iGluRs contains NMDA and AMPA (α-amino-3-hydroxy-5-isoxazolepropionic acid)/kainite type receptors that are subclassed according to their specific agonists (Bolton and Paul 2006). On the other hand, eight subtypes of mGluRs divided into three groups (Group I; mGluR1 and mGluR5, Group II; mGluR2 and mGluR3, Group III; mGluR4, mGluR6, mGluR7 and mGluR8) based on their sequence homology and G-protein coupling (Fallarino et al. 2010). Pitt et al. (2000) have reported that EAE-sensitized mice treated with NBQX (2,3-dihydroxy-6-nitro-7-sulfamoyl-benzo(f)-quinozaline-2,3-dion), an AMPA /kainite antagonist, showed notable reduction in disease severity and axonal
dystrophy while merely affecting neuroinflammation and proliferative ability of antigen-primed T cells. In contrast, L-2-amino-4-phosphonobutanoate (L-AP-4), a group III mGluR agonist, expedited the recovery rate of EAE in mice (Besong et al. 2002) and a selective enhancer of mGluR4 (N-phenyl-7-(hydroxyimino)cyclopropa[b]chromen-1a-carboxamide, PHCCC) induced resistance against EAE by favoring the emergence of Treg over Th17 cells (Fallarino et al. 2010). In accordance with this emerging concept in which glutamate regulates excessive immune response, we observed reduced glutamate production via inhibition of GCPII led to reduced T cell reactivity and controlled neuroinflammation. However, this favorable function of GCPII inhibition significantly limited Th1 and Th17 polarization and did not skew Th2 cells or Tregs population. Indeed, neither DC population nor mGluR4 expression was altered after GCPII inhibition in this study (data not shown). The reason for these conflicting observations is not clear but may lie in the difference where the effect of glutamate was inhibited (impeded uptake versus reduced production). It might also be reconciled by considering different receptor responses to glutamate levels.
While resting T cells constitutively express mGluR5 in human peripheral blood which function as an inhibitory role against anti-CD3 antibody-induced T cell proliferation via inhibition of IL-6 production, mGluR1 is expressed upon T cell activation and counteracted the mGluR5-mediated T cell inhibition in concert with priming naïve T cell into Th1 cell and promoting secretion of IL-2, IL-6, TNF-α and IFN-γ (Pacheco et al. 2004; Pacheco et al. 2006). In the CNS of MS patients, strong mGluR1 immunoreactivity was observed in axons of actively demyelinating lesion and diffused increase in the expression of mGluR5 was detected in reactive astrocytes while mGluR1 was observed only in a subpopulation of reactive astrocytes in demyelinated areas (Geurts et al. 2003). In this context, it is of interest to note that mGluR1 has been recognized as a potent modulator of glutamate-dependent
T cell response by which glutamate might interplay between immune system and CNS (Pacheco et al. 2007).
However, the change in mGluR1 expression on infiltrated T cells in the CNS of MS/EAE and its potential proinflammatory effects on disease progression have not been elucidated. In our report, we observed elevated mGluR1 expression on infiltrated T cells in CNS of EAE affected mice whereas CD4+ mGluR1+ T cells were markedly downregulated after GCPII inhibition concomitantly with the reduction in mGluR1 expression in both spinal cord and spleen. The reduced mGluR1 immunoreactivity on dystrophic axons by GCPII inhibition might reflect the alleviation of mGluR1 accumulation which occurs in response to axonal dystrophy during EAE (Geurts et al. 2003). Consequently, decrease of inducible proinflammatory mGluR1 on CD4+ T cells by 2-PMPA treatment and subsequent impaired glutamate production through GCPII inhibition highlight the GCPII-mediated glutamate excitotoxicity in MS/EAE neuroinflammation. In particular, we underlined mGluR1 may conduct modulation of glutamate-induced Th1 response during EAE, which might explain unchanged or elevated Th1 population by modulation of mGluR4 in previous study (Fallarino et al. 2010). Furthermore, in concert with reduced T cell reactivity observed in both periphery and CNS, markedly ameliorated microglial activation and astrocytosis were observed after GCPII inhibition, which resulted in the protection of axon against EAE-associated dystrophy.
In this study, we underscored the role of GCPII overexpression in astrocytes on EAE progression and showed that the inactivation of GCPII by its specific inhibitor 2-PMPA protected susceptible mice against EAE. Protection of disease conferred by GCPII inhibition correlated with its ability to suppress myelin-reactive Th1 response through the regulation of inducible mGluR1 expression and to modulate EAE-associated neuropathic features such as gliosis and axonal dystrophy. These findings not only support the
proposed role of astrocytic GCPII expression in EAE progression but also highlight the potential use of GCPII inhibition as a therapeutic strategy with added benefits in a variety of Th1-mediated diseases besides MS.
6. REFERENCES
Bauer J, Huitinga I, Zhao W, Lassmann H, Hickey WF, Dijkstra CD. 1995. The role of macrophages, perivascular cells, and microglial cells in the pathogenesis of experimental autoimmune encephalomyelitis. Glia 15(4):437-46.
Baxter AG. 2007. The origin and application of experimental autoimmune encephalomyelitis. Nat Rev Immunol 7(11):904-12.
Berger UV, Luthi-Carter R, Passani LA, Elkabes S, Black I, Konradi C, Coyle JT. 1999. Glutamate carboxypeptidase II is expressed by astrocytes in the adult rat nervous system. J Comp Neurol 415(1):52-64.
Besong G, Battaglia G, D'Onofrio M, Di Marco R, Ngomba RT, Storto M, Castiglione M, Mangano K, Busceti CL, Nicoletti FR and others. 2002. Activation of group III metabotropic glutamate receptors inhibits the production of RANTES in glial cell cultures. J Neurosci 22(13):5403-11. Bolton C, Paul C. 2006. Glutamate receptors in neuroinflammatory
demyelinating disease. Mediators Inflamm 2006(2):93684.
Bruck W. 2005. Clinical implications of neuropathological findings in multiple sclerosis. J Neurol 252 Suppl 3:iii10-iii14.
Centonze D, Muzio L, Rossi S, Furlan R, Bernardi G, Martino G. 2010. The link between inflammation, synaptic transmission and neurodegeneration in multiple sclerosis. Cell Death Differ 17(7):1083-91.
Ephrem A, Chamat S, Miquel C, Fisson S, Mouthon L, Caligiuri G, Delignat S, Elluru S, Bayry J, Lacroix-Desmazes S and others. 2008. Expansion of CD4+CD25+ regulatory T cells by intravenous immunoglobulin: a critical factor in controlling experimental autoimmune encephalomyelitis. Blood 111(2):715-22.
Battaglia G, Bruno V, Puccetti P and others. 2010. Metabotropic glutamate receptor-4 modulates adaptive immunity and restrains neuroinflammation. Nat Med 16(8):897-902.
Geurts JJ, Wolswijk G, Bo L, van der Valk P, Polman CH, Troost D, Aronica E. 2003. Altered expression patterns of group I and II metabotropic glutamate receptors in multiple sclerosis. Brain 126(Pt 8):1755-66.
Ghadge GD, Slusher BS, Bodner A, Canto MD, Wozniak K, Thomas AG, Rojas C, Tsukamoto T, Majer P, Miller RJ and others. 2003. Glutamate carboxypeptidase II inhibition protects motor neurons from death in familial amyotrophic lateral sclerosis models. Proc Natl Acad Sci U S A 100(16):9554-9.
Hansen AM, Caspi RR. 2010. Glutamate joins the ranks of immunomodulators. Nat Med 16(8):856-8.
Jee Y, Piao WH, Liu R, Bai XF, Rhodes S, Rodebaugh R, Campagnolo DI, Shi FD, Vollmer TL. 2007. CD4(+)CD25(+) regulatory T cells contribute to the therapeutic effects of glatiramer acetate in experimental autoimmune encephalomyelitis. Clin Immunol 125(1):34-42.
Kim MJ, Chae SS, Koh YH, Lee SK, Jo SA. 2010. Glutamate carboxypeptidase II: an amyloid peptide-degrading enzyme with physiological function in the brain. FASEB J 24(11):4491-502.
Liu J, Miwa T, Hilliard B, Chen Y, Lambris JD, Wells AD, Song WC. 2005a. The complement inhibitory protein DAF (CD55) suppresses T cell immunity in vivo. J Exp Med 201(4):567-77.
Liu X, Ciumas C, Huang Y-M, Steffensen KR, Lian H, Link H, Xiao B-G. 2005b. Autoantigen-pulsed dendritic cells constitute a beneficial cytokine and growth factor network in ameliorating experimental allergic encephalomyelitis. Multiple Sclerosis 11(4):381-389.
Luthi-Carter R, Berger UV, Barczak AK, Enna M, Coyle JT. 1998. Isolation and expression of a rat brain cDNA encoding glutamate carboxypeptidase
II. Proc Natl Acad Sci U S A 95(6):3215-20.
Mesters JR, Barinka C, Li W, Tsukamoto T, Majer P, Slusher BS, Konvalinka J, Hilgenfeld R. 2006. Structure of glutamate carboxypeptidase II, a drug target in neuronal damage and prostate cancer. EMBO J 25(6):1375-84. Miyara M, Yoshioka Y, Kitoh A, Shima T, Wing K, Niwa A, Parizot C, Taflin
C, Heike T, Valeyre D and others. 2009. Functional delineation and differentiation dynamics of human CD4+ T cells expressing the FoxP3 transcription factor. Immunity 30(6):899-911.
Nakanishi S. 1992. Molecular diversity of glutamate receptors and implications for brain function. Science 258(5082):597-603.
Nataf S, Carroll SL, Wetsel RA, Szalai AJ, Barnum SR. 2000. Attenuation of experimental autoimmune demyelination in complement-deficient mice. J Immunol 165(10):5867-73.
Noorbakhsh F, Tsutsui S, Vergnolle N, Boven LA, Shariat N, Vodjgani M, Warren KG, Andrade-Gordon P, Hollenberg MD, Power C. 2006. Proteinase-activated receptor 2 modulates neuroinflammation in experimental autoimmune encephalomyelitis and multiple sclerosis. J Exp Med 203(2):425-35.
Ohgoh M, Hanada T, Smith T, Hashimoto T, Ueno M, Yamanishi Y, Watanabe M, Nishizawa Y. 2002. Altered expression of glutamate transporters in experimental autoimmune encephalomyelitis. J Neuroimmunol 125(1-2):170-8.
Ohmori K, Hong Y, Fujiwara M, Matsumoto Y. 1992. In situ demonstration of proliferating cells in the rat central nervous system during experimental autoimmune encephalomyelitis. Evidence suggesting that most infiltrating T cells do not proliferate in the target organ. Lab Invest 66(1):54-62.
Pacheco R, Ciruela F, Casado V, Mallol J, Gallart T, Lluis C, Franco R. 2004. Group I metabotropic glutamate receptors mediate a dual role of glutamate in T cell activation. J Biol Chem 279(32):33352-8.
Pacheco R, Gallart T, Lluis C, Franco R. 2007. Role of glutamate on T-cell mediated immunity. J Neuroimmunol 185(1-2):9-19.
Pacheco R, Oliva H, Martinez-Navio JM, Climent N, Ciruela F, Gatell JM, Gallart T, Mallol J, Lluis C, Franco R. 2006. Glutamate released by dendritic cells as a novel modulator of T cell activation. J Immunol 177(10):6695-704.
Pitt D, Werner P, Raine CS. 2000. Glutamate excitotoxicity in a model of multiple sclerosis. Nat Med 6(1):67-70.
Robinson MB, Blakely RD, Couto R, Coyle JT. 1987. Hydrolysis of the brain dipeptide N-acetyl-L-aspartyl-L-glutamate. Identification and characterization of a novel N-acetylated alpha-linked acidic dipeptidase activity from rat brain. J Biol Chem 262(30):14498-506.
Sakuma H, Kohyama K, Park IK, Miyakoshi A, Tanuma N, Matsumoto Y. 2004. Clinicopathological study of a myelin oligodendrocyte glycoprotein-induced demyelinating disease in LEW.1AV1 rats. Brain 127(Pt 10):2201-13.
Stinissen P, Medaer R, Raus J. 1998. Myelin reactive T cells in the autoimmune pathogenesis of multiple sclerosis. Mult Scler 4(3):203-11. Trapp BD, Peterson J, Ransohoff RM, Rudick R, Mork S, Bo L. 1998. Axonal
transection in the lesions of multiple sclerosis. N Engl J Med 338(5):278-85.
Werner P, Pitt D, Raine CS. 2001. Multiple sclerosis: altered glutamate homeostasis in lesions correlates with oligodendrocyte and axonal damage. Ann Neurol 50(2):169-80.
Zhou J, Neale JH, Pomper MG, Kozikowski AP. 2005. NAAG peptidase inhibitors and their potential for diagnosis and therapy. Nat Rev Drug Discov 4(12):1015-26.
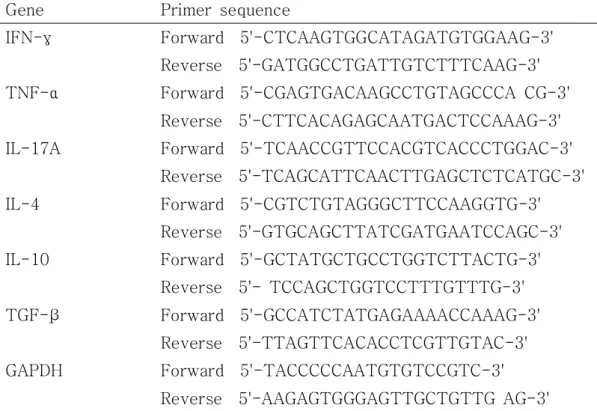
Gene Primer sequence
IFN-γ Forward 5'-CTCAAGTGGCATAGATGTGGAAG-3'
Reverse 5'-GATGGCCTGATTGTCTTTCAAG-3'
TNF-α Forward 5'-CGAGTGACAAGCCTGTAGCCCA CG-3'
Reverse 5'-CTTCACAGAGCAATGACTCCAAAG-3'
IL-17A Forward 5'-TCAACCGTTCCACGTCACCCTGGAC-3'
Reverse 5'-TCAGCATTCAACTTGAGCTCTCATGC-3'
IL-4 Forward 5'-CGTCTGTAGGGCTTCCAAGGTG-3'
Reverse 5'-GTGCAGCTTATCGATGAATCCAGC-3'
IL-10 Forward 5'-GCTATGCTGCCTGGTCTTACTG-3'
Reverse 5'- TCCAGCTGGTCCTTTGTTTG-3'
TGF-β Forward 5'-GCCATCTATGAGAAAACCAAAG-3'
Reverse 5'-TTAGTTCACACCTCGTTGTAC-3'
GAPDH Forward 5'-TACCCCCAATGTGTCCGTC-3'
Reverse 5'-AAGAGTGGGAGTTGCTGTTG AG-3'
Table 1. Primers sequences for IFN-γ, TNF-α, IL-17A, IL-4, IL-10, TGF-β and GAPDH
Clinical status Histological Finding Treatment Incidence (%) Days of onseta Mean of maximal score Mean histological score Vehicle 100 (10/10) 13.5 ± 0.3 2.7 ± 0.2 2.59 ± 0.2 2-PMPA 53.8 (7/13) 17.0 ± 0.9 0.8 ± 0.3 1.38 ± 0.2 Table 2. Clinical features of experimental autoimmune encephalomyelitis -affected mice
C57BL/6 mice were immunized with MOG35-55 and treated intraperitoneally
with either PBS (Vehicle) or 2-PMPA (10mg/kg) twice a week from the day of induction. The mean histological scores depicted here show mean value of 3 to 4 areas per tissue sections of each group ± SE.
***p < 0.005 compared with vehicle-treated control (Student’s t-test).
a
Onset of paralysis
***
Figure 1. GCPII overexpressed in the peak stage of EAE. (A) Lewis rats were immunized with GBP in CFA and the development of EAE was monitored. (B) GCPII expression in spinal cord of Lewis rats was estimated in the peak (day 13 p.i.) and recovery (day 19 p.i) stages of EAE. GCPII was normalized against β-actin and the ratio was plotted in the graph (arbitrary units). (C) Immunoreactivity of GCPII was visualized in spinal cords of Lewis rats. Bars = 30 µm. *p < 0.05, significantly different from naïve (unimmunized) control by Student’s t-test.
Figure 2. GCPII overexpression was observed mainly on astrocytes. Fluorescence staining visualized GFAP+ astrocytes (green) and GCPII+ cells (red) in spinal cords of Lewis rats and images were merged to compare naïve control (A – C), peak (D - F) and recovery stage animals (G – I). Bars = 60 µm.
Figure 3. Inhibition of GCPII induced the resistance to EAE. (A) C57BL/6 mice had been immunized with MOG35-55 peptides in CFA and injected either PBS (vehicle) or GCPII inhibitor (2-PMPA) twice a week until the termination of experiments after which the development of EAE was monitored. (B) Infiltration of inflammatory cells into CNS was depicted in the subpial (upper panel) and perivascular regions (lower panel) of the lumbar spinal cords of vehicle- or 2-PMPA-treated EAE mice. Data shown represent the mean clinical scores of disease for 2 to 3 mice per group of four independent experiments. Bars = 120 µm (subpial) and 60 µm (perivascular).
Figure 4. 2-PMPA attenuated GCPII overexpression in CNS while not affecting other glutamate-related enzymes. (A) Western blot analyses for glutamate producing enzymes, GCPII and glutaminase, and for glutamate metabolizing enzymes, glutamate dehydrogenase (GDH) and glutamine synthetase (GS), were performed with spinal cords of vehicle- or 2-PMPA-treated EAE mice. (B) The expression of each protein normalized against β-actin was plotted in the graph (arbitrary units). (C) Fluorescence images depict GCPII expression (magenta) in relation to the expression of GFAP (green) in spinal cords of vehicle- or 2-PMPA-treated EAE mice. DAPI (blue); nuclei, Bars = 60 µm. *p < 0.05, significantly different from vehicle-treated EAE mice by Student’s t-test.
Figure 5. 2-PMPA modulated the proliferation of splenic MNCs to MOG35-55
restimulation. Mononuclear cells were isolated from spleens of mice immunized with MOG35-55 at day 19 p.i. and cultured in medium alone or in
the presence of MOG35-55 or PLP138-151. Background proliferation was 387 ±
41 cpm and ConA-induced proliferation was 12628 ± 909 cpm. Data are means ± S.E. of cpm and are representative of three independent experiments. Statistical evaluation was performed to compare the experimental groups and corresponding control groups, respectively. ***p < 0.005
Figure 6. 2-PMPA altered the population of MNCs in periphery. (A) Splenic MNCs and PBMCs were isolated on day 19 p.i. from mice treated with either vehicle or 2-PMPA and analyzed by flow cytometry for CD3+CD4+ T cells, CD3+CD8+ T cells and CD45+CD11b+ macrophages. The dot plots shown
represent one of three separate experiments with similar observation. (B) The mean numbers of each cell population from splenic MNCs (left panel) and PBMCs (right panel) were plotted in graph (7 to 8 mice / group). *p < 0.05 and ***p < 0.005, significantly different from vehicle-treated EAE mice by Student’s t-test.
Figure 7. 2-PMPA did not affect the population of regulatory T cells. (A) Splenic MNCs were analyzed by flow cytometry for CD4+CD25+ and CD8+CD25+ T cells on day 19 p.i. of mice treated with either vehicle of 2-PMPA. The dot plots depicted here represent one of three independent experiments with similar observation and the mean population of each cell was plotted in graph (7 to 8 mice / group). (B) Western blot for foxp3 expression was performed with spinal cords of vehicle- or 2-PMPA-treated EAE mice. The expression of foxp3 was normalized against β-actin and the quantitative graphical representation of band density was shown (arbitrary units).
Figure 8. 2-PMPA decreased the production of IL-17, IFN-γ and TNF-α in periphery. (A) Real-time PCR for indicated genes was performed in duplicate on cDNA extracted from spleen of 3 to 4 mice per group (day 19 p.i.). Normalization to the expression of GAPDH was undertaken using the REST program (Qiagen) and the fold change against control was calculated. ND; not detectable. (B) Single cell suspension of spleen was prepared from mice treated with either vehicle or 2-PMPA on day 19 p.i.. The cell suspension was cultured in the presence of MOG35-55 (5 g/ml) for 48 hours and the production of cytokines was measured by ELISA. Representative results from at least three experiments are shown. *p < 0.05, significantly different from vehicle-treated EAE mice.
Figure 9. 2-PMPA limited the infiltration of CD4+ and CD11b+ cells into CNS. (A) Fluorescene images depicted CD4+ (magenta) and CD11b+ (green) cells in subpial and perivascular regions of lumbar spinal cords of vehicle- or 2-PMPA-treated EAE mice. DAPI staining was performed to illustrate nuclei. (B) Quantification of infiltrated cells was performed using three lesions showing the most representative expression from each mouse (5 to 6 mice per group). Bars = 60 µm. *p < 0.05, significantly different from vehicle-treated EAE mice by Student’s t-test.
Figure 10. 2-PMPA suppressed mGluR1 expression in both CNS and periphery. (A) Real-time PCR on cDNA isolated from spinal cords and spleen of vehicle- or 2-PMPA-treated EAE mice (3 to 4 mice / group) was performed with Grm1 primers. Expression data were normalized relative to GAPDH and fold change was compared to vehicle-treated mice. (B) Western blot analysis for mGluR1 was performed with spinal cords and spleen of each group. The expression of mGluR1 was normalized against β-actin and the ratio was plotted in the graph (arbitrary units). (C) Fluorescene images depicted mGluR1-positive CD4+ T cells, dystrophic axons and astrocytes in gray matter of spinal cords of vehicle- or 2-PMPA-treated mice. CD4, GFAP and nonphosphorylated neurofilament heavy chain (NF-H); green, mGluR1; magenta, nuclei; blue. Data are representative of three independent experiments. Bars = 30 µm. *p < 0.05, significantly different from vehicle-treated EAE mice.
Figure 11. 2-PMPA mitigated gliosis in spinal cords of EAE-affected mice. Paraffin-embedded spinal cords sections from vehicle- or 2-PMPA-treated EAE mice were stained for GFAP (astrocytes), Iba-1 (microglia) and CNPase (oligodendrocyte). DAPI staining was used for indicating nuclei. Bars = 60 µm.
Figure 12. Inhibition of astrocytic GCPII expression rescued EAE-affected mice from axonal dystrophy. Immunohistochemistry was performed with SMI-32 antibody against nonphosphorylated NF-H in the spinal cords of mice treated with either vehicle or 2-PMPA. Note that beadlike appearance indicated aggregates of dystrophic axon (arrow heads). Bars = 60 µm (A – B) and 30 µm (C-D).
자가면역성 뇌척수염 모델에서 성상세포 유래 글루타메이트 생성 효소의
기능 및 조절에 대한 연구
지도교수 : 지영흔 하단비 제주대학교 대학원 수의학과 실험적 자가 면역성 뇌척수염 (EAE)은 사람의 다발성 경화증 (MS)의 동물 모델로 서 중추신경계내로 침윤된 T 세포 매개의 탈수초성 질병으로 알려져 있으나, 최근 에는 흥분성 신경전달물질인 글루타메이트가 MS의 유발에 미치는 영향 또한 보고 되고 있다. Glutamate carboxypeptidase II (GCPII)는 이러한 글루타메이트를 생성 하는 효소로써 다른 중추신경계 질병의 유발에 미치는 영향이 널리 알려져 있으나, MS 및 EAE에서는 GCPII의 기능 및 그 조절에 의한 영향이 밝혀지지 않은 실정이 다. 따라서 본 연구에서는 EAE 모델에서 GCPII의 발현이 질병의 진행에 미치는 영 향을 평가하고 이와 더불어 GCPII의 저해가 EAE의 특징인 중추신경계 염증 및 탈 수초에 의한 axon의 손상에 미치는 영향을 평가하고자 하였다. 그 결과 우선 GCPII 의 발현이 EAE 임상증상의 심화 정도에 비례하여 증가하는 것을 확인할 수 있었으 며, 이러한 GCPII의 발현이 기존의 보고와 일치하여 성상세포에서 주로 일어남을 확인할 수 있었다. 또한 EAE가 유발된 마우스에 GCPII 저해제인 2-PMPA를 처리 하였을 시, 임상 증상과 특징적인 뇌병변 (중추신경계 염증, 과도한 아교세포의 활 성화 및 axon의 손상)을 유의적인 감소를 확인할 수 있었다. 이와 더불어 말초의 자가항원 반응성 T 세포의 수적, 기능적 변화를 살펴본 결과, Th1 세포의 분화 및 IFN-γ의 생성을 촉진하는 metabotropic glutamate receptor 1 (mGluR1)의 발현이 중추신경계 및 말초 면역기관에서 모두 저하되며, 특히 CD4+ T 세포에서 mGluR1이 유의적으로 감소함을 확인하였다. 결론적으로 성상세포 유래 글루타메이 트 생성 효소인 GCPII는 자가 면역성 뇌척수염의 심화에 영향을 미치며, 이러한 GCPII의 저해로 인해 감소된 글루타메이트의 생성이 mGluR1의 발현을 조절하여 CD4+ T 세포의 수 및 기능을 조절함에 따라 중추신경계 염증이 억제되어 최종적으 로 axon의 손상을 막는 것으로 사료된다.
주요어: 실험적 자가면역성 뇌척수염 (EAE); Glutamate carboxypeptidase II (GCPII); 성상세포; CD4+ T 세포; metabotropic glutamate receptor 1 (mGluR1)