Characteristics of a Wire Level Sensor in the Measurement of a Free Surface Fluctuation
Ho-Yun Nam, Byoung-Hae Choi, and Jong-Man Kim b
Korea Atomic Researcher Institute E-mail: hynam@kaeri.re.kr
1. Introduction
In the liquid metal reactor using sodium as a coolant, there exists a free surface in the upper plenum of the reactor vessel where the hot coolant contacts with a cold cover gas. The fluctuation of the free surface causes two important phenomena in the reactor. One is to induce a thermal stress to the reactor vessel due to the free surface fluctuation of sodium. Another is the cover gas entrainment at the free surface. If a significant amount of gas is entrained by the fluctuation of sodium, the entrained gas causes a change in the reactivity and also reduces the heat removal capability of the coolant in the core. Therefore it is an important parameter in the design of a liquid metal reactor.
An experimental study will be carried out for measuring the fluctuating frequency and amplitude of the free surface in a cylindrical annular vessel where the inner vessel is simulated as a UIS of a reactor. Since the hydraulic property of sodium is similar to that of water, water is used as a working fluid instead of sodium. Because the range of the estimated frequency is about 0.5~5 Hz in this experiment, a conductivity type wire sensor is used as a level meter in order to get an accurate enough response. But the characteristic of this type level sensor have not been reported in the literature so far. Owing to this reason, an experiment is carried out to find the characteristics of the level sensor before the surface fluctuation measuring experiment. In the present paper the characteristics of the level sensor are described through an experiment.
2. Experiment
Figure 1 shows the test rig for measuring the characteristics of the wire level sensor. The wire sensor is moved vertically by the piston motion of a disk which is rotated by a DC motor. Though the free surface of the water is fluctuated in the free surface experiment, the wire sensor is moved in order to obtain a well defined frequency in this experiment. The moving length is 71.58mm, and the rotating frequency of the motor is controlled by an inverter. The wire sensor is immersed in the water which is in a small plastic vessel. The experimental range of the motor frequency in the experiment is 0.1~10Hz in order to cover the range of the free surface fluctuation in the planned free surface
experiment. An AC power with a 1 kHz frequency is supplied to the wire sensor by the power supply developed in this work. The wire diameter is changed by 0.02mm, 0.05mm, and 0.1mm for the purpose of the effect of a sensor diameter.
Figure 1. The test rig for measuring the characteristics of a wire sensor
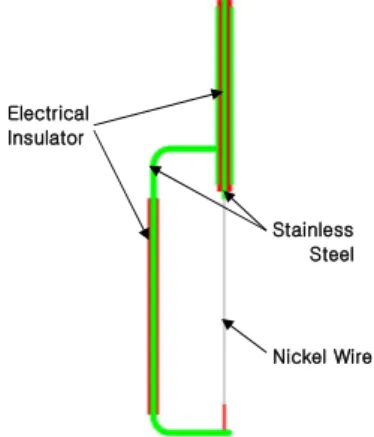
Figure 2 shows a wire sensor used in this experiment. This type of level sensor is detected by the electrical conductivity of water according to a variation of the water level. Nickel wire is used as a level sensor, and its length is about 200mm. Because the sensor is strongly affected by an environmental condition, it has to be calibrated in a practical system.
Figure 2. The shape of a wire level sensor
Wire sensor AC Power supply Motor Stainless Steel Nickel Wire Electrical Insulator
Transactions of the Korean Nuclear Society Autumn Meeting Busan, Korea, October 27-28, 2005
The experimental data is collected using the HP1413C data acquisition system and 200 data are obtained per one second during 180 seconds. The calibrations of the wire sensor are performed before and after changing the sensor. Figure 3 shows one of them.
0 1 2 3 4 5 6 7 -10 0 10 20 30 40 50 60 70 80 A -20.41069 0.52214 B1 40.00157 1.00351 B2 -8.38795 0.57291 B3 0.96366 0.12228 B4 -0.04391 0.00866 L e v e l Volt wire dia. 0.02mm Polynominal fitting curve
Figure 3. Calibration curve of the wire level sensor with 0.02mm in diameter as the level versus output voltage
3. Result and Discussion
The experiment is carried out by varying the oscillating frequency for 6 cases with 3 different kinds of the wire diameter. Fig. 4 shows a typical comparison of the experimental response and the ideal response of the wire sensor according to the oscillating frequency for the cases of 0.1 Hz and 1.0 Hz with a 0.05mm diameter of the sensor. Because the ideal amplitude must be equal to the diameter of the disk, it is 71.58mm. The ideal variations of the level are displayed by dotted lines in each case of the oscillating frequency in the figure.
100 102 104 106 108 110 -60 -40 -20 0 20 40 60 L e v e l (m m ) Time (sec) 0.1 Hz Exp. 0.1 Hz Ideal 1.0 Hz Exp. 1.0 Hz Ideal wire dia. 0.05 mm
Figure 4. Comparison of the experimental response and the ideal response of the wire sensor according to the oscillating
frequency
Although the oscillating frequency is varied, the experimental frequency follows the ideal frequency. But
the amplitude of the experimental level decreased with an increase in the oscillating frequency. Also the figure shows that the error of the sensor which is deeply immersed into the water is higher than the error of a sensor which is slightly immersed. This phenomenon appeared in all of the oscillating frequency regions. Because it is considered as a geometrical effect of the wire sensor, it is necessary to be carefully investigated it through an experiment with several types of sensors. Although the reason of a lower response when the sensor is deeply immersed in the water can be expressed literally as an increase of the electrical capacitance of water, a detailed cause needs to be studied.
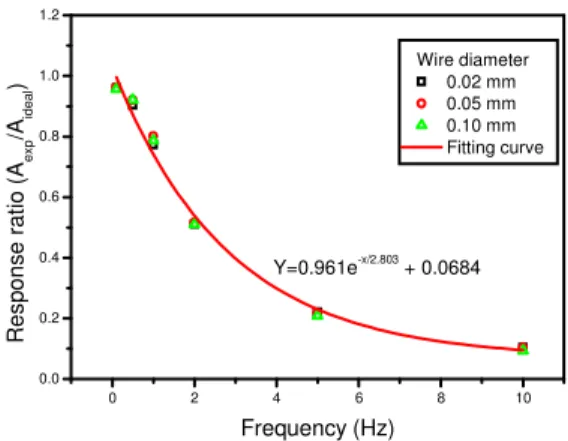
Figure 5 shows the ratio of the experimental amplitude and the ideal amplitude versus the oscillating frequency according to the wire diameters. The ratio is exponentially decreased when the oscillating frequency is increased as shown in this figure. This figure also shows the amplitude ratio is same in a fixed oscillating frequency without the effect of a wire diameter. The responsibility of a wire sensor can be calculated by the ratio of the amplitude.
0 2 4 6 8 10 0.0 0.2 0.4 0.6 0.8 1.0 1.2 R e s p o n s e r a ti o ( Ae x p /A id e a l ) Frequency (Hz) Wire diameter 0.02 mm 0.05 mm 0.10 mm Fitting curve Y=0.961e-x/2.803 + 0.0684
Figure 5. Amplitude ratio of the experimental and ideal amplitude versus the oscillating frequency according to the wire diameters
4. Conclusion
From the wire response experiment we found that the ratio between the experimental amplitude and the real amplitude is decreased with an increase in the oscillating frequency. But the frequency follows well that of a real situation. The response of a wire level sensor is not affected by the wire diameter.
Ackowledgement
This study has been supported by the Nuclear Research and Development Program of the Ministry of Science and Technology of Korea