r
The Journal이Medicineand Ufe Science Vol. 6. No. 5,2009I
A Comparison between Liquid-Crystal Display Monitors and Cathode-Ray Tube Monitors: A Combined Assessment Study of Observer Performances by Using Storage
Phosphor and Flat-Panel-Detector Radiography in Detecting Experimental1y Induced Pulmonary Edema in Pigs
8un Young Jeong'
,
Myung .lin Chung',
Gukmyung Choi’,
Bong 800 Kim',
8eung Hyung Kim',
and .li Kang Park'IOepartment이RadiolOQι Jeju NationalUniversitySCh。이 이 Medicine,Jeju,Korea and tDepartmentof Radiology,8amsung Medical Center,
SungkyunkwanUniversltySCh
∞
1이Medicine‘se。미KoreaAbstract
To compare lhe observer performance 01 liquid crystal display (LCO) and cathode ray tube (CRn monilors in detecting experimentally induced pulmonary edema in αgs by using solt-copy images이amorphous selenium-based Ilal-panel-delector radiography (OR) and storage phosphor computed radiography (CR). Oleic acid was injecled inlra-atrially into lhree pigs (weight,
2Q-25kg) al doses 이0.04. 0.05,and 0.06 ml/kg 10 induce pulmonary edema. Each sel 01 CR,DR. and Ihin
→
ection CT scans were obtained every 20-30 minutes from three pigs over 4-6hours. Thus,37 똥Is (10 sels lrom pig-l ,11sels Irom pig~2,and 16 sels lrom pig-3) 이radiographs were oblained. Images were masked for idenlity. randomly sorted,and displayed on both live mega pixel (2048 x 2560 x 8 bils) LCD and CRT monilors. Eighl radiologisls raled each image lor Ihe presence 01 iIi defined difluse opacities and reticular-Iinear opacilies in both lungs by using continuous rating scale 01 0-100. A total of 4736 (37 sets 2 deteclor system 2 fields 2 lesion types 8 observers 2 monitor systems) observations were analyzed in lerms of receiver operating characteristics. Äverage observer pe서。rmance in detecting ill de’
ined dif’
use opacilies,LCO and CRT monitors were not different signilicanlly in both OR and CR images. Average performance in detecting reticular-linear opacitles was signilicanlly belter wilh LCD than CRT. These differences were significant in evaluating DR images (AUC=.852::t.038 on LCD; AUC=.785:t.070 on CR끼bul nol signilicanlin evalualing CR images (AUC=.795:t.060 on LCD; AUC=.745:t.070 on CRTI System on both LCO and CRT monilors (p=.042 on LCO; p=.044 on CRTI. Moreover. wilh OR system. observer performance was better with LCO monilor than with CRT monitor (p=.013),whereas with CR system,observer performance was not different significantly on both monitors (p=.11 8). Overall the five-mega pixel LCO monilor was equal or superior to CRT lJ1onilor이Ihe same pixel size in detecting experimentally induced pulmonary edema. Moreover,the LCD monitor appears,to be more。
ptimized for detecting pulmonary reticular-1inear opacily,when interfaced wilh OR system rather than 에Ih CR syslem. (J Med u’
e Sci 2009;6:351-358)Key Words ; LCD . CRT . DR . CR . Pulmonary edema
Introduction
。
ver the past deeade‘picture archiving and∞
mmunication system (PACS)". have prevailed in many hospitals forits advantages,such as rapid accessibilily ,simultaneous image display at remote sites,reduced fI1m or processing costs.Address 1α correspondence : Myung씨n Chung,MD
Departmenl01 Radiology8amsung Medical Cenler,Sungkyunkwan Universily SCh∞|이Medlcine 50,Ilwon-Dong,Kangnam-Ku,8eoul 135-710‘Korea
E-mall :[email protected]
and easier archiving and networking of images1-S) πlIS system requires the complete digitalization of conventional screen-fiIm projection radiography and the monitors in substitute for light boxes.
In this regard,some comparativestudies between digital radiographic (DR) and computed radiographic (CR) images as the means of image acquisition have been often reported out5-7). Several comparative studies between liquid crystal dispiay (LCD) ond cothode roy tube (CRT) monitors os methods of image display also have been conductedB-10) However,it has not been confinned yet the op디mi7.ation of
Sun YoungJeong,MyungJin Chung. GukmyungChoi. Bong 800 Kim.8eung HyungKim,and Ji Kang Park
Seleclion 01 Experimenlal animal
Animal Experimenlation monitors
The aim of this study was to compare observer performance in detecting experimentally induced pulmonarγ edema in pigs via LCD and CRT monitors interfaced to DR (amorphous selenium-based f1at-pane1) and CR (storage phosphor) systems
The pig was used as an animal mode1 to simulate pa1ients with pulmonary opacities ,because the pig has well
developed interlobular septa and anatomic structures that are similar to hwnan lungs and because pigs are relatively easy to handle5•11l,Three York.shire pigs (age ,11-13 weeks; weight,20-25kg) were used after approval was obtained from the hospital research review board
Computed Radiography and Digital Radiography
Thin-section CT scans were obtained with a scanner (Somatom Plus 4; Siemens,Erlangen,Germany) with a field of view of 20-22 cm,a 512 x 512 maσix,an exposure of 140 kVp and 170 mA,and a O.75-second scanning time Thin-Section CT Scanning
radiography ,selenium-based digi떼 radiography,or thin section CT was randomly selected to avαd bias. In tot.al,
each set of computed radio밍'ap버c,selenium-based digita1 radiographic,and thin-sec1ion CT scans were obtained in 10 minutes.Subsequently , a set of computed radiographic , se1enium-based digital radiographic. 외1d thin-section CT
scans were obtained everγ 20-30 minutes over 4-6 hmσs. A total of 37 sets of images were obtained in three pigs (10,
11,16 sets of images per pig). Each set of îmages included one computed radiographic image,one digita1 radiographic unage,와1d Olle thin-section CT sc~n obtained dwing each
sesslon
Posteroanterior chest radiographs were obtained with computed radiographic and se1enium-based digita1 racliographic systems that were located in the same room Two Bucky st.ands were set up at the opposite sides of the same room for each detector system. Computed radiographic images were obtained with an imaging lU뼈FCR-9000‘F이"
Tokyo,Japan). A 35 x 43-cm imaging plate (ST-V; F이i) with a maσix of 1,760 x 2,140 x 10 bit and a pixel size of 0.2 mm was used. The seleniwn-based digital radiographic images were ob떠.ined by using a unit (Dσec없ay; Direct Radiography,Newark ,Del) with a 35 x 43-cm solid-state detector with a matrix of 2,560 x 3,072 x 12 bit and a pixe1 size of 0.139 mm. Radiography was performed În each pig with the selenium-based digital radiographic system and then immediately after with the computed radiographic system (or vice versa)
The radiographs were produced by using the same tube and generator and at the same exposure settings,
、
iVhich were 80 kVp and 250 mA,with an exposure time of 50 msec and a 180-cm focus-detector distance. Both imaging systems included a moving 10:1. antiscatter grid 003 1ines per inch). The x-ray beam was collimated onto the pig‘s chest. Immediatelψ after the radiographs were obtained,a thin~section CT scan of the chest was obtained,or vice versa. The same techniqueand setting that were used to。
btain the baseline thin-section CT scan were used to obtain the radiographsMalerials and Melhods
Anesthesia was induced wi디1 intramuscular i대ection of a rnixture of 7mg per kilogram of body weight of ketaInine hydrochloride (Ketara; Yuhan Yanghang,Seoul,South Korea) and 2.3 mg/kg of :xylazine hydrochloride (Rompun; Bayer Korea,Seoul ,South Korea) and was maintained with the intravenous înjection of 1.3 mg/kg of zolazepam hydrochloride (Zoletil; Vîrbac. Carros. France). Pigs were not intubated. A 5-Fr catheter was întroduced through the right external jugular vein for the intra-artrial injection of oleîc acid to induce permeabilîty pulmonary edema. Prior to the injection of the oleic acid,baselîne computed radiographic,
selenîum-based digita1 radiographic ,and thin-section computed tomographic (CT) scans were obtained
Permeability edema was induced 、‘rith the intra-atrial iniection of commercially availab1e oleic acid (C18H3402; Si밍na,Steinheim ,Germany) through the external jugular
catheter ( at doses of 0.04,0.05 ,and 0.06 mL/kg as a bo1us or as subdivided injections). Immediately after the l이ection of oleic acid. computed radiographic. selenium
based digital radiographic ,and thin-section computed tomographic (CT) scans were obtained 만113imaging studies were peJformed rapid1y to minimize 띠me delays 맨113interva1 between computed radiography and selenium-based digit.al radiography was as short as 1minute because the tw
。
radiographic units were in the same room. Jmmediately after computed radiography and selenium-based digital racliography,the pigs were rapidly moved into the nearby CT room for CT scanning. The study sequence of computedA Comparison야tweenLiquid-CrystalDiS])layMoniωrsand Cathode-Ray’Iùbe Moniωπ
a consensus
Mean AUC values are given in Table 1 10 illustrate the
。
bseπer perfonnance for the detection of experimental1yinduced pulmonary edema in .pigs‘The 95% Cls for lhe
differences between the monitor systems and the detector systems are also.prcvided (Table 2. 3)
This is a total combination comparative study including accustomed to a PACS viewer because they used it in daily practice. They evaluated the images independently. The images were masked for identity and assigned randomly ω
prevent selection bias. Obserγers divided the lesion 앙pes
into 뼈。groups (ill de미led diffuse opacities and
reticular-linear opacities) and a continuous rating scale of 1 - 99 was used to represent each observer' s confidence level regarding the presence or absence of difTuse hazy opacity
and reticular-Iinear opacity. H외f of the observers had their
rating session with the CRT monitor f1rst,the other half
with the LCD monitor first. Each reading session was separated by at least 1 week to diminish learning efTect
A1137 thin-section CT scans of the chest were evaluated
by two board-certified chest radiologists. and decisions
about the presence of pu1monaryedema were reached with
Statistical Analysis
A tolal of 4736 observations (37 sets x 2 deteetor system
CR and DR x 2 fields: ri앙lt and left lung field x 2 lesion
types: iII defined diffuse opacities and reticular-!inear
。
pacities x 8 observers x 2 monitor systems: LCDand CRT)were evaluated. Observer performance in detecting
experimentally induced pulmonary edema in pigs by
observing LCD and CRT monitors interfaced to DR and CR
systems was tested by using receiver operating
characteristic (ROC) analysis of individual reader data. A11 statistical analyses were performed by using SPSS for
Window v12.0 (SPSS induslry. Chicago. 11). Deteclion
accuracy was measured according 10 the area under the
ROC curve,or AUCvalue. Differences between the monitor
systems combined with the digital detector systems and lesion types were compared using the paired t test. The statistical significance of the results was reported as 95% CIs for mean differences in AUC values for observel
performanceI2). Mean differences were regarded as
statistically significant at the 5% level when the
corresponding CI did not encompass zero12)
Results
仁=
Image Interpretation
Digital data were saved as a Digilal Imaging and Communications in Medicine (DlCOM) format and then disbibuted to display workstations. The size of each D1COM fI1eof the computed radiographic and selenium-based digital
radi。암'aphic images was 7.18 and 15.0 Mbytes,respectively
Images were downloaded onto the local hard disk drive of
the display workstation and displayed
‘
.vith DICOMviewer(Pi View: Infinitt 1'echnology‘Seoul. Korea). Both 21-inch
CRT and LCD monitors were calibrated to similar
specifications: the CRT moniωr (SMM21200P. Siemens AG‘
Germany). with 2.048 x 2.560 x 8-bil pαels. operated at
71Hz refreshing rate in an Înterlaced mode and at a
brighlness level of 450 ed/m
’.
and LCD monitor (ME511/C:Totoku. UEDA.Nagano‘Japan). with 2.048 x 2.560 x 10-bil
pixels. operated at 60Hz refreshing rate and at a bri힘1tness
level of 450 cd/m' π1e images interpreted in a darkened
room. About 10% of the display area was al10cated for the
title and menu bars,and the remaining display area (2.048 x
2,300 pixels) was large for the computed radiographic data
and slight1y small for" the selenium-based digital
radiographic data. Therefore. selenium-based digital
radiographic images were displayed as its original resolution and computed radiographic images were enlarged by 50% by using pixel rep1ication10 fit the remaining monitor display area. The soft-copy images were displayed without unsharp masking. Only the window widths and the image levels were
optimized automatically with a customized program‘which
produced the same density for the computed radiographic and selenium-based digital radiographic images. No other image postprocessing was perfonned.Observers were allowed
to adjust the bri양1mess and conÌTastof the images. For this
study. pig identillcation was obscured on 외I images and
replaced by a sequence number. Computed radiographic and
selenium-based digital radio앙aphic images were displayed
in a random manner
Eight radiologists seπ"ed as obseπeπ for the study; four
of them were board-certified radiologist,and the others
were residents in deparbnent of radiology. All they were Image Acquisition and Display
I걱gs were scanned in the prone position from the thoracic
inlel to the level of the diaphragm with a 10-mm inteπal and a l-mm section thickness. After scanning. the images
were reconstrucied by using a high-spatial-frequency
Sun YoungJeong,MyungJîn Chung,GukmyungChoi,Bong Soo Kim,Seung Hyung Kim,and Ji Kang Park
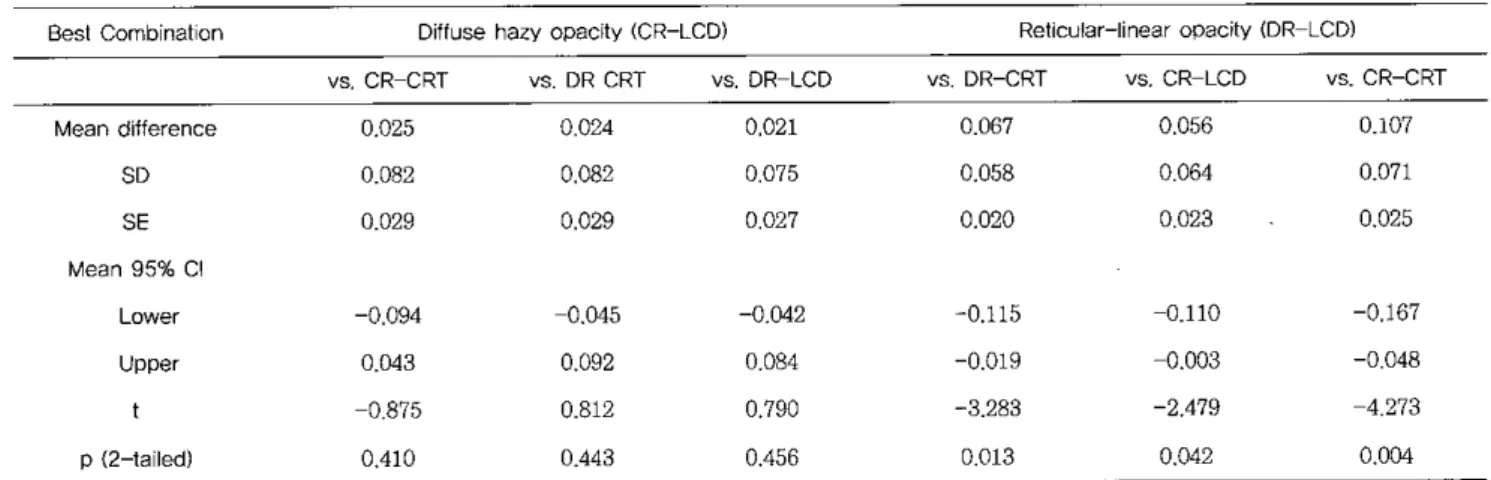
perfonned the best w얘)statîstical1y significant difference compared to the rest 야rree combinations (Table 4)
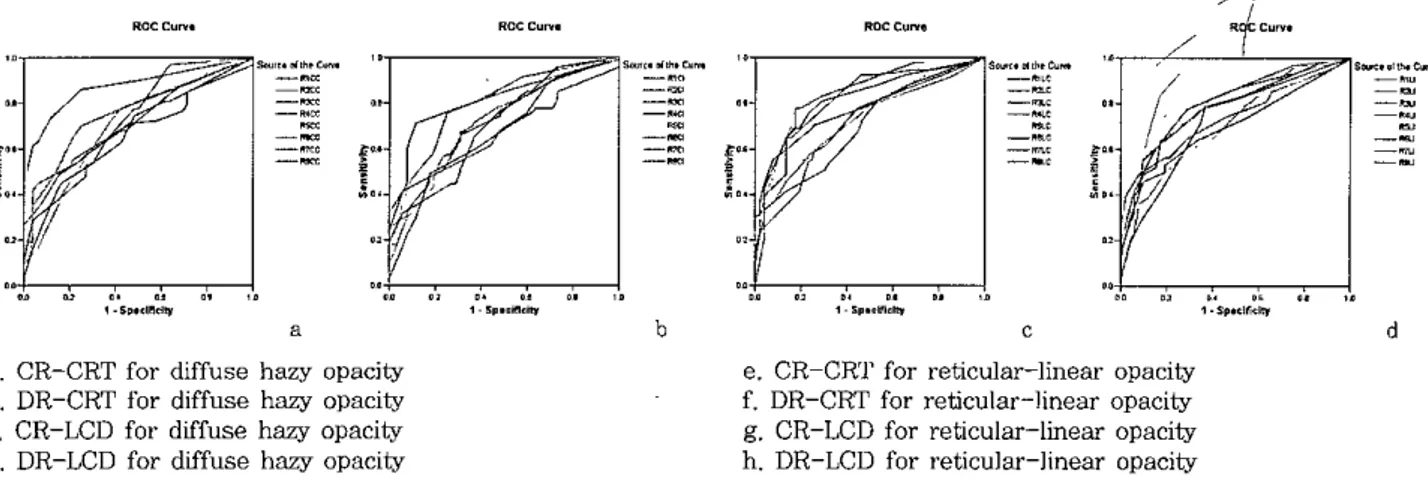
ROC curves from the different combination of monitors and lesîon types for each eight radiolo밍st are sh
。、
Nn mFigure 1
Many investigators have reported equîvalent or superior penonnance with the use of DR syst.em compared to CR syst.em în det.ecting pulmonary lesions5,6),Thus flat-p 밍1.el
digital radiographic syst.em has already been widely used in daily radiology practice of many institutes as well as storage-phosphor computed radîographic system ,The
cUITent study confirmed significantly better perfonnance with the use of DR system than that of CR system in detecting reticular and linear opacities ,although the DR and CR system’s pen
。
πnance remained constant in detecting 여ffuse hazy opacities,These result.s are atσibut.ed to the superioritycomparion of DR vs CR syst.ems,LCD vs CRT monitors ,and lesion types (alveolar consolidation vs int.erstitial density)
First,we looked at the comparison studies of LCD and CRT performance ,In all the four combination (diffuse hazy
opacityon CR,reticular-linear opacity on CR,diffuse hazy opacityon DR,and reticular←linear opacity on DR),LCD
performed better than CRT,However,only in the combination
。
f DR and detecting reticular-linear opacity showed a statistically si밍퍼cant difference (p=.013) (Table 2)Comparing CR and DR,there is no significant difference between CR and DR in eva1uating diffuse hazy opacity,but DR was be야er significantly than CR în evalua디ng reticul81 linear opacity with both CRT and LCD monitor combinations (p=.044 on CRT,p=.042 on LCD) (Table 3)
Comparing lesion types,CR and LCD combination showed the highest AUC average score in evaluating diffuse hazy opacity,but there is no sigr파icant- difference in comparing the rest three combinations. In evalua디ng reticular-lînear
。
pacîty,it was proved that DR and LCD combinationDiscussi
。
nTable 1. Mean values of area under curγe (AUC) in receiver operating characteristic analysis in detecting experimental1y induced pulmonary edema in pigs: comparison of four combinations in LCD and CRT monitors interlaced to DR and CR syst.ems
Diffusehazy opacity Reticular-linearopacîty
CR-CRT DR-CRT CR-LCD OR-LCO CR-CRT OR-CRT CR-LCO DR-LCD
Mean 0.753 0.755 0,779 0.758 0745 0.785 0.795 0.852
N 8 8 8 8 8 8 8 8
SO 0.052 0.091 0.054 0.082 0.070 0.070 0.060 0.038
SE 0.019 0.032 0.019 0.029 0.025 0.025 0.021 0013
Abbreviations. CRT; cathode ray tube,LCD; liquid crγ"staldisplay,CR; computed radiography ,DR; digital radiography ,SD‘
standard deviation,SE; st.andard error
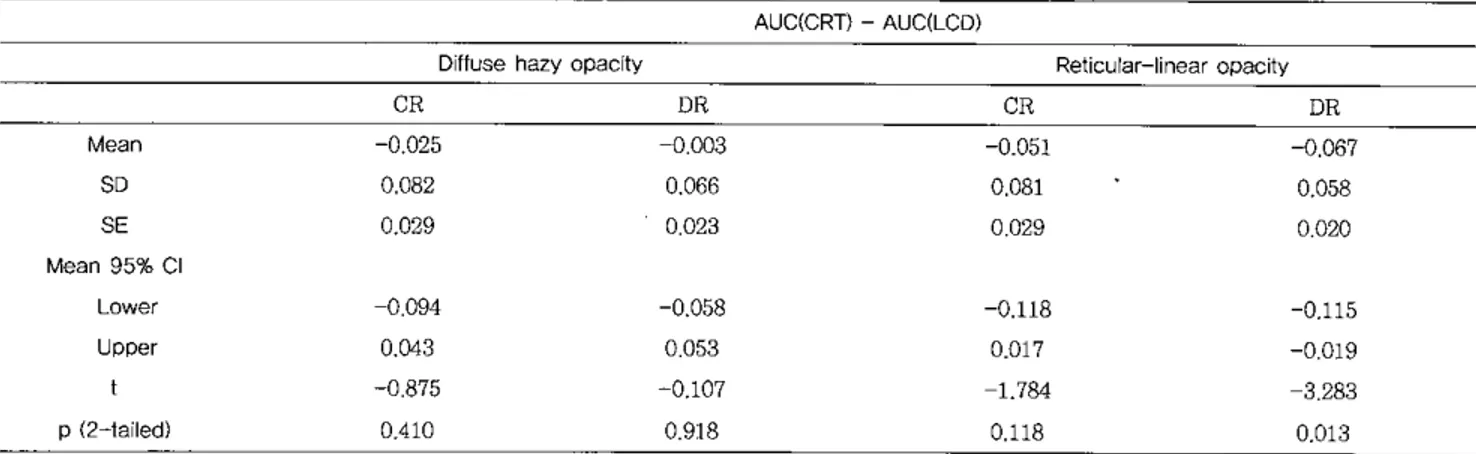
Table 2. Comparison between 1CD and CRT monitors by the differences of AUC values for detecting two lesion types AUC(CR끼 AUC(LCO)
Dìffusehazy opacity Retic미ar-linear opacity
CR DR CR DR Mean 0.025 -0.003 -0.051 -0.067 SD 0.082 0.066 0.081 0.058 SE 0.029 0.023 0.029 0.02C Mean 95% CI Lo
、
Ner -0.094 -0.058 -0.118 -0.115 Upper 0.043 0.053 0.017 -0.019 -0.875 ←0.107 1.784 3283 p (2→-taile(이 0.410 0.918 0.118 0.013Abbreviations. - CRT: cathode ray tube,LCD; liquid crγstaldisplay ,CR: computed radiography ,DR; digital radiography. 3D‘
st.andard deviation. SE: standard error‘CI; confidence interγal
A Comparisonbetween Lìquid-CrystalDisplayMonitorsand Ca야lOde-RayTube Monitors
。
f digital radiography compared to the computedradiography in terms of spatial resolution
매1eoretically,digital radiography ,which has a matrix of 2,560 x 3,072 pix아s (139 x 139 ~ per pixel),can depict
more fine details than can computed radiography with a matrix of 1,760 x 2,140 pixels (200 x 200 vmper pixeI). Pi.x:el size is an important parameter in digital radiography because it directly inf]uences the spatial resolution of images,particularly in the depiction of fme detail5. 13)
Another explanation for the better penonnance of digital radiography is related to the absence of light scattering within the detector. Even if other factors such as the matrix and pixel sizes were equal , sharper images could be
obtained with digital radiography than 、、rith screen-film radiography or computed radiography,The conversion of x
ray phowns to electrical charges and electrical data is direct by means of arrays of semiconductor elements without the interγening light stage,such as in an intensifying screen or a photostimulable phosphor imaging plate,The latter are
used in the screen-fùm system and computed radiography , respectively ,ln the screen-film system and computed
radiography , light scattering of intermediate 1ight f1uorescence results in iIJ!.ageblurring5,6,14}
Another factor r‘elated to the detection of pulmonary
abnonnalities on chest radiographs is the image gray scale The munber of gray levels in a digi없1 system determines
Table 3,Comparison between CR and DR systems by the differences of AUC values fordetecting two lesion types
AUC(CRi- AUC(D에
Diffusehazy opacitv Reticular-linearopacily
CRT LCD CRT LCD Mean -0.002 0,021 -0,040 -0,056 SD 0,069 0,075 0,046 0,064 SE 0,025 0,027 0,016 0,023 Mean 95% CI Lower 0,060 -0,042 -0,079 -0,110 Upper 0,056 0,084 -0,002 -0,003 0,076 0,790 2.456 2.479 p (2
→
ailedl 0.942 0.456 0.044 0.042Abbreviations. - CRT; cathode ray tube,LCD; liquid CIγstal display,CR; computed radiography ,DR; digital radiography ,SD
standard deviation,SE; standard error,CI; eonf띠ence interval
Note,-CIs‘tv 외ues,and p values were ealeulated by paired sample T-test
Table 4. Statistical analysis of the differences of best eombination from others aceOI며.llg to the lesion types
Besl Combinalion Diff니se hazy opacily (CR-LCD) Relicular-linearopacily (DR-LCDl
VS,CR-CRT vs. DR CRT
、
s,DR-LCD vs. DR-CRT vs. CR-LCD vs. CR-CRT Mean difference 0,025 0,024 0,021 0,067 0,056 0.107 SD 0,082 0,082 0,075 0,058 0064 0,071 SE 0,029 0,029 0,027 0,020 0023 0,025 Mean 95% CI Lower -0,094 0,045 -0,042 →0,115 -0110 -0.167 Upper 0,043 0,092 0084 -0,019 -0,003 -0,048 0875 0.812 0,790 3283 -2.479 4273 p {2-1aìle에 0.410 0443 0.456 0013 0,042 0,004Abbreviations → CRT‘cathode ray tube,LCD; liquid cηstal display,CR; eomputed radiography ‘DR: digital radiography ,SD
standard devîation. SE; standard -error,CI: cdnfidence interval
Sun YoungJeong,MyungJin Chung,GukmyungChoi,Bong800 Kim.Seung HyungKim.and Ji KangPark
how well it reproduces subtle contrast differences Seleniwn-based di밍ω1 radi。밍에)hic images are digitized in 12-bit gray scale (4,096 shades) ,whereas most of the currently used computed radiographic systems provide lC←
bit images 0,024 shades}. Some computed radiographic systems that can create 12-bit images are now also commercîally available. Therefore, selenium-based dîgital radiography can,theoreticaliy,more accurately depict the subtle vanations in attenuation1Sl. According to a study by Floyd et aI16),measurement of inherent contr
‘
ast sensitivity showed little difference between the f1at-panel-detector and storage phosphor systems. However,because the inherent contrast of the Þivo detectors was comparable and because the noise power spectrum of the f1at-panel-detector system was far superior to that of the storage-phosphor system,one may conclude that contrast-to-noise ratio of the fonner should also be superior to that of the latterl61
lt is established that CRT monitor can replace
conventiona1 radiographs successfully4,17). Many authors
reported that LCD and CRT monitors are comparable8-10l In our study,LCD pe:rfonned better than CRT io all the f(
。
αr combinations (diffuse hazy opacity on CR,re디C비ar-linear。
pacity 00 CR,diffuse hazy opacity on DR,and reticular linear opa디이 on DR}a!though the statistically significant difference was only seen with the combination of detecting reticular-linear opacity ({:j=.013) (Table 2) (Figure 1). We guess that Reticular-linear opacitîes are better delineated by sharper edges; therefore the lesion may be conspicuous in îmage of hîgher spatial resolution and 1ess pixel bluning We als。
밍ess that ill defmed diffuse opacities are betterdelineated by higher contrast differences therefore the lesion may be conspîcuous in image of higher gray scale. The pixel pointed on CRT monitor shows larger spot size and blurred edge than its original data because of electron beam divergence; this phenomenon is more severe at higher luminance. On the other hand,spatial characteηstics of LCD
Figure 1. Receiver operating characteristic (ROC) curves according to the combination of monitor,detector and lesîon양pe for eight observers
._,“‘“’
←…
←@ ←@ )’” /"['""'
ROC CurY' ,,~’ ROC Cu,••"꺼
ROC Cu,••’“
…
a ’‘p""‘h b ” ’‘ ....'h ’".‘
•.•
c " ’‘’‘“
’‘ lfie이 da. CR-CRT for diffuse hazy opacîty b. DR-CRT for diffuse hazy opacity c,CR-LCD for diffuse hazy opacity
d. DR-LCD for diffuse hazy opacity
e. CR-CRT for reticular-linear opacity f. DR-CRT for reticu!ar-linear opacity g. CR-LCD for reticular-linear opacity h. DR-LCD for reticular-linear opacity
Figure 2. RMagnified photograph of four imaging system - monitor combinations. (a) Storage phosphor computed radiograph (CR) dîsplayed on cathode ray tube (CRT) monitor. (b) Selenîum-based flat panel digîtal radiograph (DR) displayed on CRT,(c) CR displayed on liquîd crγstal display (LCD) monitor ,and (d) DR displayed on LCD,SubtIe reticular opacities are demonstrated better on (d) than others. Tilted stripes seen on (c) and (d) are moire artifact because of the interference between the arτay of CCD in digital camera and the pixel lines of LCD panel
A Comparisonbetw-eenLìquid-Crγstal비splay Monitorsand Cathode-RayTube Monitors
(statistical1y significant) for detecting reticular-linear dens벼es when intenaced with DR system rather than with CR system
1) Razavi M,Sayre JW,Taîra RK,et a1. Receiver operatipg-characteristic study of chest radiographs în children: dîgital hard-copy film vs 2K x 2K soft→copy
images. AJR Am J Roentgenol 1992; 158:443-448 2) Hayrapetian A,Aberle DR,Huang HK,et 외 Comparison
of 2048-line digital display formats and conventional radicigraphs: an ROC study. AJR Am J Roentgenol 1989; 152:1113-1118
3) Slasky BS,Gur D,Go때 WF,et al. Receiver operating characterîstic analysis of chest îmage interpretation with conventional ,laser-prînted ,and high-resolution workstation images. Radiology 1990; 174:775-780 4) Ishigaki T,Eudo T,IkEκ1a M,et al. Subtle pulmonary
disease: detection with computed radiography versus conventional chest radiography. Radiology 1996:
201:51-60
5) Kim TS,1m JG,Goo JM,et al. Detection of pulmonarγ edema in pigs: storage phosphor versus amorphous selenium-based flat-panel-detector radiography Radiol。양 2002: 223:695-701
6) Goo JM,1m JG,Lee HJ,et a1. Detection of simulated chest lesions by using soft-copy reacling: comparison of an amorphous silicon f1at-panel-detector system and a storage-phosphor system. Radiology 2002: 224:242-246 7) Garmer M,Hennigs SP,Jager HJ,et a1. Digital
radiography versus conventional radiography in chest imaging: dia밍lOStiC penormance of a large-area silicon
f1at-panel detector in a clinical CT→controlled study. .AJR
Am J Roentgenol 2000: 174:75-80
8) Kotter E,Bley TA,8aueressig U,et a1. Comparison of the detectability of high- and low-contrast details on a TFT screen and a CRT screen designed for radiologic diagnosis,Invest Radiol 2003: 38:719-724
9) Hwaug SA,Seo JB,Choi BK,et al. Liquid αγstal display monitors and ca난1ode-ray tube monitors: a comp없lson
of observer penormance in the detection of small soli떠ry pulmonarγ nodules,Korean J RadioI 2003: 4:153-156
10)Partan G,Mayrhofer R,Urban M,Wassipau\ M,Pichler 1,Hruby W. Diagnostic penormance of liquid crysta\ and cathode-ray-tube monitors în brain computed tomogra야1Y,Eur Radiol 2003: 13:2397-2401
ll)Murata K,Herman PG,Khan A,Todo G,Pipman Y,
is close to idea\ response up to the Nyquist frequency associated with the display pixel size1에 Thus the pixel
sharpness of LCD monitor is much better 야lan 삼lose of CRT
CRT monitors suffer from several drawbacks. First,they are heavγ andbulky,and a pair of CRT monitors needs a lot of space în the reading room. Second,CRT monitors are not completely flicker free. Third,at very high resolutions , CRTpixels often suffer a certaîn degree of fuzziness. Fourth, CRT monitors have a limited life span ,because their maximum brightness decreases over 미ne and pα:els may be bumed into the phosphor coating of the CRT. Fifth,CRT monitors usually present some degree of geometric dîstortion. Last1y,CRT monitors emits consîderable - amormt
。
f heat and electromagnetic waves. In contrast , high resolution LCD monitors are clean,sωn,energy effective,and cost effective. Dîsplay quality of 1CD monitor is consistent through its whole life cycle
As mentioned earlier,over the past years there have been many studîes regardîng the penonnance comparison on DR vs. CR,외ld LCD vs. CRT,and the findîngs are relatively
consistent and stable. However,previous studîes were' not e~nsive enough to include combinations of both variables (monitor and detector system) to explore which detectOl system by which monitor: could deliver the best image quality. The present study confmned that spatial resolution of target image can be displayed best with the combination of 1CD monitor and DR system. Thîs study is meaningful in a sense that it confmns the existing research fmclings on DR vs. CR and LCD vs. CRT,but also explores the most optimized reading environment via various combination assessmenl;s
The major limitation of our study is that the study was based on the pig’s lung by injecting oleic-acid experimentally,not an actual patient s lung. Therefore,the result of this study cannot exactly represent a human patient' s lesion. However,pig has relatively well-developed interlobular septa and pig' s anatomic structure is sirnilar to that of human lung5. 11)짜us pig' s lung can simulate many disease conditions of human lung. Another \irnitation of thìs study can be that observers were not accustomed to chest radiograpby of pig. Regarcling thîs concem,we had several practice sessions with some îmage pictures to leam pig s chest anatomy before we actually start maÎ1lstudy
In conclusion,overall five-mega pixel LCD monitor was equal or superior to CRT monitor of the same pixel size in detecting experimentally induced pulmonary edema
’,
Sun YoungJeong. MyungJin Chung,GukmyungChoi. Bong 800 Kim.8eung Hyung Kim,and Ji Kang Park
Luber JM. Intralobular distribution of oleîc acid-ìnduced pulmonary edema in the pig. Evaluation by high resolution CT. Invest Racliol 1989: 24:647-653
12)Bulpitt CJ. Confidence int.ervals. Lancet 1.987: 1.:494-497 13)Chotas HG,Dobbins JT,3rd,Ravin CE. Prînciples of
digital radiography with large-area ,electronically readable detectors: a review of the basics. Radiology 1999:210:595-599
14)Rowlands JA,2hao W,Blevis 1M,Waechter DF,Huang 2 Flat-panei dîgital radiology with amorphous selenium 밍ld
active-matrix readout. Radiographìcs 1997; 17:753-760 15)MacMahon H,Vyborny C. Technîcal advances in chest
,-/
/
1
"
radiography. AJR Am J Roentgenol 1994: 163:1049-1059 16)Floyd CE. Jr .. Warp RJ,Dobbins JT‘3떠,et a1. Imaging
characterîstics of an amorphous silicon flat-panel det.ector for di밍tal chest radîography. Radiology 2001;
218:683-688
17)Thaete FL,Fuhrman CR,Oliver JH,et a1. Digital radiography and conventional ima밍ng of the chest: a
comparison of observer performance. AJR Am J Roentgenol 1994: 162:575-581
18)Biume HR,Steven PM,Cobb 11E,a1. e. Characterization of high-resolution liquid crystal displays for medicai images. Proc SPIE 2002: 4323-07:271-292