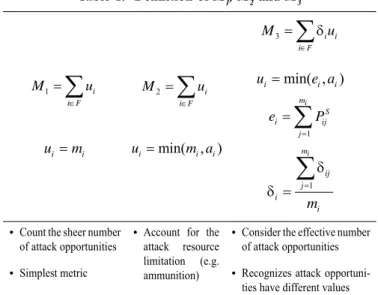
NOMENCLATURE
mi The number of network motifs in which agent i participates.
ai The maximum number of attack attempts agent i can conduct.
ui The offensive capability of an agent i. PijD The probability of successful detection. PijC The probability of successful communication. PijH The probability of successful attack.
PijS The probability of target information acquisition for
a specific attack opportunity.
ei The expected number of attack opportunities that an agent i can actually materialize.
δij Value of attack opportunity j that an agent i holds. Nc The number of enemy casualty.
1. INTRODUCTION
Commanders make strategic and tactical decisions such as weapon acquisition and new doctrines to enhance their force’s combat capabilities. To make optimal decisions, they must accurately grasp the current capabilities of their troops and those of the enemy in various combat environments. To this end, many studies in the military domain have sought to develop methods for accurately measuring combat effectiveness1-7.
Combat effectiveness can be conceptually defined as the overall capability of a military force to produce the desired outcome from a combat against an enemy force. In the classic Lanchester’s model for a firearm engagement between two opposing forces, combat effectiveness of each force is directly
proportional to their offensive firepower and initial size2. The offensive firepower is incorporated by a coefficient of attrition rate that represents the number of enemy (friendly, respectively) soldiers each soldier in a friendly (enemy, respectively) force can incapacitate per unit time. While the firepower is certainly an important contributor to combat effectiveness, firepower alone does not fully represent how effective a military force will be in a combat8. Combat effectiveness depends on many factors other than the fire power of a force, e.g., doctrines and tactics, logistics, information, knowledge, etc.
Measuring combat effectiveness is a challenging task since it is a complex function of many factors of military forces. Hayward presented a conceptual framework to measure combat effectiveness as follows1:
Combat effectiveness of a force = probability of success in combat, P(S)
= f x( , , : , , : , , , , , )1 xn y1 yn e1 e mm 1 mr ,
(1)
where xn (yn) denotes the n
th capability of a force, e
n is an
environmental parameter, and mr is a mission parameter. It
is noteworthy that this conceptual definition emphasizes that combat effectiveness is defined in a multi-dimensional space in three categories: capabilities, environment, and mission.
It is particularly difficult to measure combat effectiveness when the modern paradigm for conducting warfare is network centric warfare (NCW). A key aspect of NCW is to enhance information sharing among combatants and commanders. Sharing information is expected to create positive effects, including improved situational awareness, self-synchronization,
Network-based Metric for Measuring Combat Effectiveness
Youngwoo Lee and Taesik Lee
*Korea Advance Institute of Science and Technology, Daejeon-305 701, Korea *E-mail: [email protected]
ABSTRACT
A conceptual definition of combat effectiveness is the overall capability of a force to produce a desired outcome from combat against an enemy force. An ability to measure combat effectiveness is critical to strategic and tactical decision making; however, it is a challenging task to develop an operational metric for combat effectiveness due to the large complexity presented by the rich context of a combat environment. The present paper contends that, under a direct fire engagement, combat effectiveness can be reasonably assessed by the prevalence of attack opportunities a given force creates in a combat environment. The paper proposes a method to quantitatively measure combat effectiveness of a military force in a direct fire engagement environment. The proposed metric is based on a meta-network representation that captures various aspects of a combat environment. Using a meta-network representation, two types of basic unit structures of attack opportunity – isolated and networked – are identified, which are then used as a basic element for measuring combat effectiveness. Prevalence of network motifs in a networked combat environment and availability of attack opportunities are computed as a measure of a military force’s combat effectiveness.
Keyword: Network centric warfare, combat effectiveness, meta-matrix, network model
Received 22 November 2013, revised 18 February 2014, online published 20 March 2014 Defence Science Journal, Vol. 64, No. 2, March 2014, pp. 115-122, DOI : 10.14429/dsj.64.5534 2014, DESIDOC
faster speed of command, increased force lethality3-5,9,10. In an NCW environment, the overall capability of a military force is more than a simple sum of capabilities of individual components and abilities of forces. For example, to assess the capability of an autonomous air defence system, one must account for many other factors than the shooter components11. An air defence system must first detect the emergence of air threats. Low-altitude radars with sophisticated data fusion technologies are needed to detect the threats and create accurate information. This information needs to be disseminated to relevant decision makers and actors without delay so that action plans are formulated quickly. Optimal target allocation by command and control system also contributes to successful air defence by effectively responding to the threat. All of these factors–missiles, radar, C2, communications, etc. must be accounted for to properly assess the overall capability of an air defence system.
There have been research efforts to develop metrics for NCW combat effectiveness, primarily from the communication network perspective. Many of these studies attempt to measure the benefits from NCW capability, where they use network representation of forces with particular emphasis on information flow aspects3,4,12,13. Ling3, et al. defines network tempo as the product of network reach and richness. Network reach is related to the information flow on a network, and richness represents the ability of intelligence, surveillance, and reconnaissance (ISR) assets to transform information into knowledge. They use the network tempo to define an upper-bound for Boyd’s cycle observe-orient-decide-act (OODA) time. Janssen and Monsuur12 proposes a network performance metric to capture the level of situational awareness in a combat network. Perry4, et al. defines network plecticity to quantify the benefit and cost of information flow, and measures the impact of accuracy and precision of information on collaboration between combatants in a network. Jung13, et al. develop the concept of network power to incorporate synergetic effects brought by synchronization and shared information flow. While various metrics developed in the previous research measure the benefits in some aspects caused by NCW capability, it is not clear how such benefits translate to the overall combat effectiveness. They fail to consider how the partial effectiveness is combined with the overall combat effectiveness. For example, the upper-bound of OODA time can provide insight on the speed at which a networked force makes decisions and executes the decisions, but that is a part, not the entire whole of the overall combat effectiveness3.
One alternative to measure combat effectiveness is by directly observing outcomes of combats. Over recent decades, many researchers have developed combat simulations that can be used to generate outcomes of virtual combats (e.g., MANA, WISDOM II). A combat simulation model can incorporate features of real-world combat environments. There are several combat simulation models that capture various NCW features by including command, control, communications, computers, intelligence, surveillance and reconnaissance (C4ISR) components6,7,14. One can assess the combat effectiveness of a designated force by observing outcomes from virtual combats.
Developing an analytic metric for combat effectiveness is another alternative. Simulations can generate empirical
data from various designed situations; however it is difficult to develop logical insight and principles that can explain the appearance of the data. Often, a complex simulation model works as a black-box, making it quite difficult to establish connections between inputs and outputs by concise logical explanation. On the other hand, an analytic metric defines a functional relation between control variables and combat outputs. Therefore, an analytic metric can provide a transparent understanding as to how changes in control variables are related to outputs by functional relation.
In this paper, our goal is to develop a metric to quantitatively measure combat effectiveness of a military force in an engagement-level combat environment. Our metric is designed to capture links between firepower and NCW capability, especially information sharing among combat participants. To develop the metric, we construct a network model that represents interactions among combat participants in combat environments.
2. NETWORKED COMBAT MODEL
2.1 Network Representation of Combat Situation Measuring combat effectiveness requires an underlying combat model that captures various elements of a combat environment including firepower of forces and the information flow. Along this line, cares provides a network representation for a combat model, where a combat environment is represented by a network of distributed forces15. Nodes in a network denote entities participating in a combat. Specifically, the nodes are classified to sensors, deciders, influencers, and targets. Directed arcs between the nodes represent physical or informational interactions between the entities.
While the basic network model by Cares is a concise representation of a combat, there are much richer interactions that take place in a combat situation. A meta-matrix is a conceptual modeling technique to model relationships among various agents in heterogeneous domains16. It has been used to model terrorist networks to capture complex dynamics of terrorist activity development17. A meta-matrix representation recognizes that events like terrorist activities evolve through interactions encompassing many different domains. In the present study, our meta-matrix uses five entities: friendly force agents, hostile agents, task, information, and location.
We then adopt the basic network representation framework of Cares along with a meta-matrix representation to model a combat environment. This leads us to a graphical network model for a combat environment. A combat model based on the meta-matrix can have heterogeneous nodes in different domains, and it incorporates various interaction networks specified in the meta-matrix. This representation allows us to capture diverse aspects of a combat environment, for example, geospatial deployment of forces, information sharing by networking, and task allocation in a combat operation. As an example, an event of ‘a friendly agent’s attacking an enemy agent’ can be graphically represented as shown in Fig. 1. An attack is conducted by an agent (A). A task of incapacitating enemy agent B (m) is assigned to friendly agent A (j). Friendly agent A is also assigned a task of detecting enemy agents (j’, m’). It possesses information about the target
enemy agent B (k, l). Enemy agent B occupies a location (o), and a friendly agent A has a capability to influence entities in that location (e.g., the location is within its fire range). fig. 1, thus, represents a situation for a possible attack by friendly agent A on enemy agent B.
presence of enemy agent B by itself (e.g., due to a lack of detection capability), as depicted by the lack of connection to ‘Task (detect)’. The other friendly agent A2has the capability
to detect entities in the location where enemy agent B resides (n’), and acquires information on enemy agent B(k,l). Agent A2 can detect B, but it is not capable of incapacitating B.
Information on enemy agent B is passed to A1 from A2(p), and
it allows A1 to exert force on enemy agent B (j,m,n). This is
a situation where an attack on enemy agent B is made possible through collaboration between A1 and A2.
A combat environment with a complicated structure of agents, capabilities, tasks, and locations will create a large network with a web of edges connecting nodes. Even for such a complicated combat environment network, a basic unit for an attack opportunity structure is either an isolated attack or a coordinated attack. Thus, we use the two types of attack opportunity structures shown in Fig. 1 and 2 as a basic unit to assess the total number of attack opportunities of a friendly force in a direct fire engagement.
As the first step toward developing a measure for combat effectiveness using a network model, this paper works with a simplified model. figure 3 is reduced from figs. 1 and 2 by extracting only communication and influence networks.
To summarize this section, we argue that combat effectiveness of a force under a direct fire engagement can be reasonably assessed by the number of attack opportunities that it has under a current combat environment. In order to obtain the number of attack opportunities, we model a combat environment by a heterogeneous network. Two basic unit structures of attack opportunity – isolated and networked – are identified based on the network representation. We measure their prevalence in a combat network to assess the number of attack opportunity of a force.
2.2 Models of Attack Opportunity
When two opposing forces are engaging in a combat, one of the immediate measures of success for a friendly force is the size of enemy casualties. Enemy casualties are in turn related to the strength of friendly force’s offensive actions. Strength of offensive actions may be represented by the size of shooter elements or the number of attempts of attack. For example, a coefficient of attrition rate in Lanchester’s model is proportional to the number of attempts of attack assuming a direct-fire engagement between homogeneous combatants8. Thus, in a narrow context of a direct fire engagement, a possible measure of combat effectiveness of a force is its capability of creating a large number of opportunities and options for attack attempts.
The number of opportunities for attack attempts created by a force is a function of its intrinsic capabilities, location properties, a task assignment structure, and capabilities of an enemy force. An attack opportunity may be created by a single agent (Fig. 1), or by collaboration and coordination between two or more agents. Figure 2 is an example of a network representation of an attack opportunity created by two friendly agents A1 and A2. In this study, we refer to an attack depicted
in Fig. 1 as an isolated attack, and the mode in Fig. 2 as a networked attack.
Figure 2 depicts a situation where A1 cannot detect the Figure 1. Network representation of an engagement between
two opposing agents.
Figure 2. Networked attack opportunity.
3. METRIC DEVELOPMENT
The two types of attack opportunity structures shown in Fig. 3 are used as a basic unit to assess the total number of opportunities a friendly force possesses in a direct fire engagement. In other words, we use the two structures as a network motif, a special pattern found in a network18, and assess the prevalence of these motifs in a combat environment network as a measure of the number of opportunities for attack attempts.
Consider a direct fire engagement where a friendly force has N agents, indexed by i. Define a set of friendly agents F = {1, 2, …,N}. Let mi denote the number of network motifs in which agent i participates. Then, the simplest scheme to measure the prevalence of network motifs – thereby attack opportunities – is to sum all mi of a friendly force
1 i
i F
M m
∈
=
∑
(2) M1in Eqn. (2) ignores the fact that the number of attack attempts is related to the amount of resource (e.g., ammunitions). This leads to a possible over- or under-estimation of the attack attempts. Let ai denote the maximum number of attack attemptsagent i can materialize in a single round of fire exchange. When ai<mi, only ai attack attempts can be made at maximum, and (mi–ai) opportunities will not be materialized. Hence, M1would
overestimatethe attack attempts by agent i. On the other hand, when ai>mi, M1may lead to an under-estimation of the attack attempts: agent i can utilize all mi attack opportunities, and still have (ai–mi) resources so that it can execute more attacks than mi.
Before moving forward to present modified metrics, it is worthwhile to revisit Eqn. (2) and give a slightly different interpretation. Recall that what we ultimately attempt to measure by Eqn. (2) is the overall combat effectiveness by a friendly force. Then, Eqn. (2) can be considered as the sum of offensive capability of the agents in the force. By letting ui
denote the offensive capability of an agent i, Eqn. (2) can be written as 1 i i F M u ∈ =
∑
(3) i i u =mIn other words, Eqn. (2) is a special case of Eqn. (3) in which the offensive capability of an individual agent is defined to be equal to the number of motifs (i.e., basic attack structures) it possesses.
Now, let us consider an alternative definition of offensive capability ui that takes into account the effect of the maximum
number of attack attempts, ai
min( , )
i i i
u = m a (4) Substituting ui in Eqn. (3) with Eqn. (4), we have a new
metric which we label as M2. Equation (4) states that the
offensive capability of a combat agent i is limited either by the number of attack opportunities it has or by the amount of attack resource it can consume. This definition is based on the following rationale. First, the offensive capability of a combat agent i cannot be greater than the amount of attack resources it has. Secondly, the maximum number of enemies an agent can incapacitate cannot be greater than the number of attack opportunities it possesses.
While ui in Eqn. (4) makes an intuitive appeal, we may
refine the metric further by recognizing some of the attack opportunities may not be available to the agent. Recall that an isolated attack structure has two arcs connecting an agent to its potential target: one for detect, and the other for fire (fig. 3). For this particular attack opportunity to be materialized by the agent, a successful detection of the target should precede actual firing. Likewise, for a networked attack, detection of a target by agent A2and transferring the information from A2
to A1 must succeed before A2 can attack the target. Let j be
the index for attack opportunity structures for agent i, and let PijD and P
ij
C denote the probability of successful detection and
communication respectively for agent i’s attack opportunity j, as shown in Fig. 3. Then, the probability of target information acquisition for attack opportunity j, denoted as Pij
S, is P ij
D, for
an isolated attack and Pij DP
ij
C for a networked attack (assuming
independence between detection and communication). Then we define the effective attack opportunities ei for
agent i as follows 1 i m S i ij j e P = =
∑
(5) S D ij ijP =P for an isolated attack
S D C
ij ij ij
P =P P for a networked attack.
ei represents the expected number of attack opportunities that an agent i can actually materialize (i.e. fire), and it is evident that ei≤mi for all i. Then, eqn. (4) is modified to
min( , )
i i i
u = e a (6)
Yet another refinement can be considered by recognizing that each attack opportunity j presents different value, δij.
Probability of success for a single fire, Pij
H is a reasonable
candidate to represent a value of an attack opportunity j. For example, an attack opportunity j with a very high-precision weapon is likely to pose much higher threat to the enemy than j’ with a low-precision weapon, henceδ ≥ δij ij'. Then, average
value of all attack opportunities of an agent i can be written as
1 i m ij j i i m = δ δ =
∑
(7) Then, we have a new metric M3 as follows3 i i i F
M u
∈
=
∑
δ (8)where ui and δi are given by Eqns. (6) and (7), respectively.
Table 1 summarizes the definition of each metric along with their key features.
4. VALIDATION OF THE PROPOSED METRIC Simulation experiments and their results were examined for the validity of the proposed metrics M1, M2, and M3 in terms
of its usefulness as a metric for combat effectiveness. Authors used simulation experiments to verify a positive correlation between the value of the proposed metrics and the number of enemy casualties from simulated direct fire engagements.
4.1 Simulation Model and Experimental Design Our simulation model for a direct fire engagement is based on an agent-based modeling framework. It represents a relatively simple, ‘Lanchester-like’ model19, where two opposing forces enter a direct fire engagement with the same number of combatants (50 each). We use commercial simulation software AnyLogicTM(version 6.6) to develop a simulation model and conduct the experiments.
Figure 4 is a formalism for modeling and analysis of discrete event systems (DEVS) atomic model of an individual combat agent, which represent their state transitions. An agent is initially in ALIVE state, and its state sequentially changes to DETECT, COMM, ATTACK, and MOVE by the internal transitions (δint), which are triggered by the elapsed times in
lower parts of the circles in Fig. 4. In DETECT state, an agent acquires information about nearby enemies. In COMM state, it transmits (or receives) the acquired information to (or from) its neighbouring friendly agents. Using the shared information, it fires on its target enemy (or enemies) in ATTACk state. After consuming all their ammunitions, it moves to a designated location in MOVE state. In any of the states, if an agent receives an external input message DAMAge – i.e., it gets shot by an enemy agent, its state changes to DESTROYED state. Agents in DESTROYED state become dormant and do not participate in combat any more.
Combat in simulation progresses by the internal state transition of agents and the exchanges of messages. At the beginning of a combat, agents of a friendly force and enemy force are randomly distributed across an 800 m x 800 m battlefield. All agents have range profiles for their detection and attack function as specified in Table 2. Current locations of agents, distances to other agents, and agent’s range profiles, and attributes – the amount of ammunitions and probabilities of successful behaviours (PijD, P
ij C, P
ij
H ) – produce combat
results (i.e. the number of enemy and friendly casualties). When the engagement commences, agents in friendly and enemy forces conduct their functions in turn, and record state transitions as a result. Agents can detect, communicate, attack or move in response to other agents around them and their current states. These actions initiate message exchanges among agents. Combat is terminated when no agent is alive on either side of the forces or when no further action is possible by any agent.
For each simulation run, since we cannot directly control the value of the developed metrics, we sample a value for the communication range from a uniform distribution U[0, 300]. In other words, each simulation instances has a different communication profile for combat agents. for simplicity, the success probabilities of each action arc of an agent are assumed to have a single value – that is, PijD = P
ij C = P
ij H = P
i
for all j. Total of 13 simulation instances are tested by varying Pi and ai.
At the beginning of a simulation run, the proposed metrics M1, M2, and M3 are computed, and a simulation run is executed for a single round of fire exchange. At the end of a round of fire exchange, the number of enemy casualty Nc is reported. To verify that the proposed metric is a meaningful indicator of combat outcome (i.e., number of casualty), we follow Perry and Moffat20 to examine correlation between the metrics and the number of enemy casualties, Nc. High correlation (> 0.7) between the proposed metric and the number of casualty from simulation suggests the metric is an appropriate indicator. We compute Pearson correlation coefficient for the data from 5000
1 i i F M u ∈ =
∑
i i u =m 2 i i F M u ∈ =∑
min( , ) i i i u = m a 3 i i i F M u ∈ =∑
δ min( , ) i i i u = e a 1 i m S i ij j e P = =∑
1 i m ij j i i m = δ δ =∑
Count the sheer number •
of attack opportunities Simplest metric •
Account for the •
attack resource limitation (e.g. ammunition)
Consider the effective number •
of attack opportunities Recognizes attack opportuni-•
ties have different values
Table 1. Definition of M1, M2 and M3
Figure 4. DEVS atomic model representation of a combat agent in our simulation. Type Detection range Attack range Proportions (%) A 280 20 20 B 250 50 10 C 50 250 40 D 20 280 30
Table 2. Types of combat agents in the simulation model four types of combat agents are defined according to the range profile for the three functions – detect, communicate, and attack, and they are listed in Table 2. Type A and B have a long range detection but short-range attack. Type C and D have the opposite range profile with a short range detection and long-range attack. For communication, we assume that all four types of agents have the same capability, and so assigned a single value to all agents. Each side of the forces consists of all four types of agents with the same proportions. Table 2 summarizes the agents’ characteristics.
replications. p-values of all correlation coefficients reported in this paper are <0.01.
4.2 Experimental Results
Table 3 shows the results from the simulation instances where the amount of ammunition ai is varied while fixing Pi to
1. This set of simulation instances examines the effect of the amount of ammunition on the degree of correlation between each metric and Nc.
becomes large, which leads to a lower correlation compared to when M2 is used for measuring Nc (Fig. 5(c)). On the other
hand, for M2, ui=min(mi,ai) is bounded by ai when mi is large, and
thus M2stops increasing at some point. This explains the higher
correlation between M2 and the number of enemy casualty.
In the second set of simulation instances, Pi is varied and ai is set to 1. Table 4 shows the results for these instances
When Pi is less than 1, M3 takes a different value from M2. This difference comes from two possible causes in the simulation: first, some of the attack opportunity structures are deemed unavailable due to a failure in detection or communication task. They are structurally linked to form an attack opportunity, but either the communication or detection fails and thereby it does not get materialized. Second, when both detection and communication are successfully carried out, it is still possible that an attack attempt does not lead to incapacitation of the target. M3 captures those probabilistic
factors. The simulation model incorporates these probabilistic behaviour, and as such we expect M3 to show a higher
correlation with the number of enemy casualty than M1 and M2.
Since most combat simulation models includes probabilistic factors in some aspects, e.g., kill probability and probabilistic detection, accounting for probabilistic factors in the metric as in M3 is a logical treatment.
The improved correlation from M3 is observed in the
simulation results. Table 4 shows that in all but instance 7, M3
gives a higher correlations of M1 and M2. Between M2 and M3, M3 outperforms M2 more when Pi becomes smaller, suggesting it is more relevant to use M3in those cases. There is one
counter-intuitive pattern observed in Table 4: M1 apparently shows a
higher correlation with Nc as Pi decreases. Since M1 does not
take into account probabilistic factors, this behaviour is due to the changes in Nc. In fact, Fig. 6(d) shows a much less-obvious
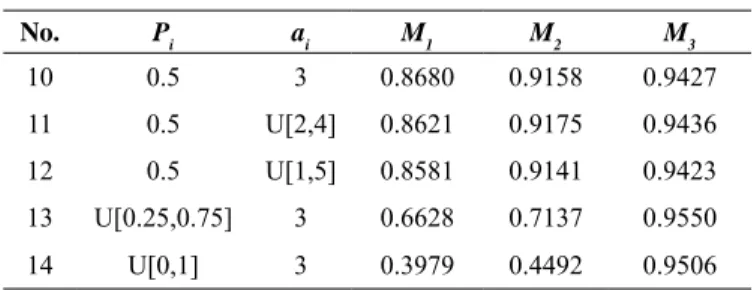
No. Pi ai M1 M2 M3 1 1 1 0.7663 0.9562 same as M2 2 1 2 0.7067 0.9740 3 1 3 0.6192 0.9348 4 1 4 0.5754 0.8897 5 1 5 0.5429 0.8558
Table 3. Pearson correlation coefficient between M1, M2, M3
and the number of enemy casualty Nc where Pi = 1, ai = {1,2,3,4,5}
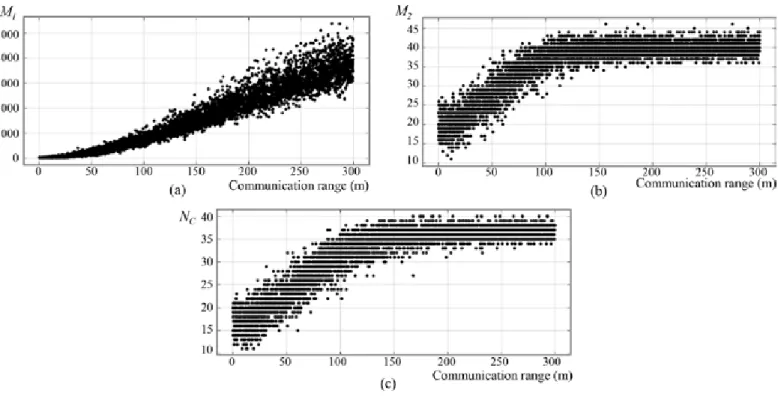
In Table 3, entries < 0.7 are italicized to indicate they do not show strong correlation. Among the three metrics, the one with the highest correlation is indicated as bold. In these instances, M2 is same as M3 since ei in M3 equals mi and δi becomes 1. M2 (and M3) shows a higher correlation than M1 in both Pearson and
Spearman correlation coefficients. A closer examination on the experimental data shows that M1 increases in response to the
level of communication range used (Fig. 5(a)). This is because longer communication range increases the number of agents communicating with agent i, thereby increasing total apparent attack opportunities mi. Meanwhile the number of enemy
casualties Nc remains stable when the communication ranges
plateau behaviour than observed in Fig. 5(c).
In the above 10 instances, all agents are assigned the same Pi and ai values. In instances 11-14, a random value is drawn from a uniform distribution for ai (instance 11 and 12) and Pi (instance 13 and 14) to introduce higher heterogeneity to the agents. With Pi less than 1 and ai greater than 1, these instances are the most general setting. Results from these instances are shown in Table 5 along with instance 10 as a reference.
In instances 11 and 12, there is not much change from the result from instance 10. In instances 13 and 14, however, correlation coefficients by M1 and M2 drop significantly while M3 still yields similar value to instance 10. This suggests that M1 and M2, which do not take into account probabilistic factors, are not robust to variations in Pi. M3 outperforms the other two metrics particularly when Pi varies among the agents.
Overall, the experimental results suggest that M3 is a reliable and appropriate metric to correlate with the number of enemy casualty in a direct fire engagement. It gives a correlation coefficient higher than 0.7 and the highest correlation coefficient in all but one instance.
We conduct additional experiments for combats between two forces possessing asymmetric powers. The asymmetric powers mean that the number of ammunitions (ai), probabilities
of successful behaviours (Pi), and communication range are differently assigned to each force. In this experiment, we set the parameters such that one force does not dominate the other: e.g., enemy force has higher ai and Pi while friendly force has longer communication range. Simulation runs are replicated five thousand times, and we observe combat results and the differences between the metric ∆(
=
M
3Friendly−
M
3Enemy). ∆indicates the advantages on attack opportunities the friendly force has over the enemy force. The experimental results show that when ∆> 0, the friendly force wins the combat for more than 50 per cent of the simulation, and when ∆< 0, it loses more than 50 per cent. Also, a larger ∆ results in the higher winning rate from the simulation runs. Similarly, we also test M2 and M1 to compute ∆, but it does not show such trend. These results demonstrate that M3 is a reasonable indicator for measuring combat effectiveness to determine superiority between two asymmetric forces.
5. CONCLUSION AND FUTURE WORKS
Measuring combat effectiveness is a challenging task since it is a complex function of many factors of military forces and combat environment. We argue that combat effectiveness of a force under a direct fire engagement can be reasonably Table 4. Pearson correlation coefficient between M1, M2, M3
and the number of enemy casualty Nc where Pi = {1, 0.875, 0.75, 0.625, 0.5}, ai = 1 No. Pi ai M1 M2 M3 6 1 3 0.6192 0.9348 0.9348 7 0.875 3 0.6621 0.9604 0.9576 8 0.75 3 0.7411 0.9734 0.9739 9 0.625 3 0.8089 0.9604 0.9704 10 0.5 3 0.8680 0.9158 0.9427
Figure 6. Scatter plots of (a) M1, (b) M2,(c) M3, and (d) Ncwith respect to communication range (instance 10).
Table 5. Pearson correlation coefficient between M1, M2, M3
and the number of enemy casualty Nc where agents are assigned random values for Pi or ai
No. Pi ai M1 M2 M3 10 0.5 3 0.8680 0.9158 0.9427 11 0.5 U[2,4] 0.8621 0.9175 0.9436 12 0.5 U[1,5] 0.8581 0.9141 0.9423 13 U[0.25,0.75] 3 0.6628 0.7137 0.9550 14 U[0,1] 3 0.3979 0.4492 0.9506
assessed by the total value of ‘effective’ attack opportunities that it has in a combat situation. Effective attack opportunity is determined by the number of resources and information acquisition.
We adopt a meta-matrix representation to model a combat environment, and create a graphical network model for a combat environment. A graphical model of a combat environment has heterogeneous nodes in different domains, and incorporates various interaction networks specified in a meta-matrix. This representation allows us to capture various aspects of a combat environment
Using a networked combat representation, two types of basic unit structures of attack opportunity – isolated and networked – are defined in an NCW environment. each of the two unit structure defines a network motif, and we measure their prevalence in a combat environment network to assess the total value of combat agents in terms of their effective attack opportunities. Experimental results verify that the proposed measure agrees with our expectation, and they are also in line with the previous findings in the context of attrition-based models. The proposed measure sheds a light on further development of the measure as we extend it to incorporate more complicated combat environment.
ACKNOWLEDGMENT
This work was supported by Defence Acquisition Program Administration and Agency for Defence Development of Korea under contract UD110006MD.
REFERENCES
1. Hayward, P. The measurement of combat effectiveness. Operations Research, 1968, 16(2), 314-323.
2. Lanchester, F.W. Aircraft in warfare; The dawn of the fourth arm. Constable and Company, Ltd., London. 1916.
3. Ling, M.F.; Terry M. & Kruzins, E.D. Proposed network centric warfare metric: From connectivity to the OODA cycle. J. Military Operations Res. Soc., 2005, 10(1), 5-14.
4. Perry, W.L. & fred, D.B. Advanced metrics for network-centric naval operations. In the Proceeding of SPIE, 2003, 5101.
5. Marshall, A.W. Measuring the Effects of Network-Centric Warfare. Booz· Allen & Hamilton Inc. Washington DC, 1999.
6. Dekker, A.H. Agility in networked military systems: A simulation experiment. In the Proceeding of 11th International Command and Control Research and Technology Symposium, Cambridge. 2006
7. Park, Seyoun; Shin, Hayong; Lee, Taesik & Choi, Bongwan. Design of the agent-based network-centric warfare modeling system. J. Korea Soc. Simulation, 2010, 19(4), 210-280.
8. Darilek, R.E. Measures of effectiveness for the information-age army. Rand Corporation, 2001, 1155. 9. Won-suk, Ou; Myungsin, Chae & Daesung, Yeum.
Influence factors of effectively executing NCW by user’s point of view. J. Korean Soc. Internet Infor., 2010, 11(2),
109-126.
10. Changbeom, Choi & Tag, gon kim. NC2W: Measuring network connectivity research in NCW environment. In the Proceeding on Conference Korea Institute of Military Science and Technology, 2009, pp. 378-381.
11. Johansson, f. & goran, f. A Bayesian network approach to threat evaluation with application to an air defence scenario. In the Proceeding on the 11th International Conference on Information Fusion, 2008.
12. Janssen, R. & Herman M. Networks, information and choice. In Collective Decision Making: Views from Social Choice and game Theory, and Decision Library C, 43, Springer, 2010, pp. 211–230.
13. Jung, Chi-Young & Lee, Jae-Yeong. A proposal of combat power measurement model of army warfare information system using network power based on social network analysis. J. Korean Academic Soc. Business Admin., 2011, 36(2), 1-16.
14. Lauren, M.K.; Smith, J.M.; Moffat, J. & Perry, N.D. Using the fractal attrition equation to construct a metamodel of the MANA cellular automaton combat model. TTCP report for the Joint Systems and Analysis group, Technical Panel 3, 2005.
15. Cares, J.R. Distributed networked operations: The foundations of network centric warfare. Alidade Press. Newport, Rhode Island, 2005.
16. Carley, K.M. Dynamic network analysis. Dynamic social network modeling and analysis: Workshop summary and papers, Committee on Human Factors, National Research Council, 2003, pp. 133-145.
17. Moon, Il-Chul & Kathleen, M. Carley. Modeling and simulating terrorist networks in social and geospatial dimensions. IEEE Intelligent Syst., 2007, 22(5), 40-49. 18. Milo, R.; Shen-Orr, S.; Itzkovitz, S.; Kastan, N.;
Chklovskii, D. & Alon, U. Network motifs: simple building blocks of complex networks. Science, 2002, 298, 824–827.
19. Justin, Beck; Terry, Moon; Coen, van Anywerpen & Hayley, Reynolds. Knowledge superiority parameter-a metric for network centric warfare. Defence Technical Information Center, 2003.
20. Perry, W.L. & Moffat, J. Measuring the effects of knowledge in military campaigns. J. Operational Res. Soc., 2010, 48(10), 965-972.
CONTRIBUTORS
Mr Youngwoo Lee received his undergraduate and master
degree in Industrial and Systems Engineering Department at KAIST, Korea. Currently pursuing his PhD at Industrial and Systems Engineering Department at KAIST, Korea. His research interests included modeling and simulation, operational research for NCW.
Dr Taesik Lee obtained his MS and PhD from Dept of
Mechanical Engineering, MIT. Currently working as is an Associate Professor at Industrial & Systems Engineering Department at KAIST, Korea. His research interests are primarily in the area of system design, modeling and simulation, especially for large-scale, complex systems.