Blood flow characteristics of diabetic
patients with complications detected by optical
measurement
Yuri An
1, Yujung Kang
2, Jungsul Lee
3, Chulwoo Ahn
4, Kihwan Kwon
5and Chulhee Choi
1,3*Background
In diabetes mellitus (DM) patients, limb perfusion monitoring is critical due to its vul-nerability to peripheral macro- and micro-vascular complications [1, 2]. Because a high glucose level can induce vascular endothelial cell dysfunction and affect blood viscosity and arterial wall tension [3–5], DM patients are at higher risk for development of vascu-lar complications than non-diabetic persons, and the frequency of limb amputation is 23-fold higher in DM patients than in normal controls [6, 7]. In DM patients, coronary artery disease develops more easily and rapidly [8], which is a life-threatening disease [5,
Abstract
Background: Diabetes mellitus (DM) is one of the most common diseases world-wide. Uncontrolled and prolonged hyperglycemia can cause diabetic complications, which reduce the quality of life of patients. Diabetic complications are common in DM patients. Because it is impossible to completely recover from diabetic complications, it is important for early detection. In this study, we suggest a novel method of determin-ing blood flow characteristics based on fluorescence image analysis with indocyanine green and report that diabetic complications have unique blood flow characteristics. Methods: We analyzed time-series fluorescence images obtained from controls, DM patients, and DM patients with complications. The images were segmented into the digits and the dorsum of the feet and hands, and each part has been considered as arterial and capillary flow. We compared the blood flow parameters in each region among the three groups.
Results: The DM patients with complications showed similar blood flow parameters to the controls, except the area under the curve and the maximum intensity, which indicate the blood flow volume. These parameters were significantly decreased in DM patients with complications. Although some blood flow parameters in the feet of DM patients with complications were close to normal blood flow, the vascular response of the macrovessels and microvessels to stimulation of the hands was significantly reduced, which indicates less reactivity in DM patients with complications.
Conclusions: Our results suggest that DM patients, and DM patients with complica-tions, have unique peripheral blood flow characteristics.
Keywords: Diabetes mellitus, Diabetic complications, Blood flow characteristic, Medical imaging, Indocyanine green
Open Access
© The Author(s) 2018. This article is distributed under the terms of the Creative Commons Attribution 4.0 International License (http://creat iveco mmons .org/licen ses/by/4.0/), which permits unrestricted use, distribution, and reproduction in any medium, provided you give appropriate credit to the original author(s) and the source, provide a link to the Creative Commons license, and indicate if changes were made. The Creative Commons Public Domain Dedication waiver (http://creat iveco mmons .org/publi cdoma in/zero/1.0/) applies to the data made available in this article, unless otherwise stated.
RESEARCH
*Correspondence: cchoi@kaist.ac.kr 1 Department of Bio and Brain Engineering, KAIST, Daejeon, Republic of Korea Full list of author information is available at the end of the article
Page 2 of 13 An et al. BioMed Eng OnLine (2018) 17:25
9, 10]. Moreover, diabetic microvascular complications affect coronary arterial disease, which is the most important long-term complication and the most common cause of death in diabetes [11]. Therefore, monitoring and understanding the blood flow charac-teristics of DM patients is important.
Indocyanine green (ICG) is a fluorescent dye that has been used in clinics for decades and it is activated by near-infrared (NIR) light, which can penetrate to a depth of sev-eral centimeters. Using ICG imaging, blood perfusion in deep tissue can be monitored. When introduced into the systemic circulation, ICG binds to plasma proteins such as albumin [12] and circulates through the vasculature. The vascular properties of tissue can be extracted by dynamic analysis of the fluorescence kinetics of ICG. ICG fluores-cence imaging has been used to detect various diseases, such as synovitis [13, 14], rheu-matoid arthritis [15–17], peripheral vascular disease (PVD) [18, 19], and diabetes [7,
20, 21]. Compared to other blood flow characterization systems, such as laser Doppler imaging (LDI), ICG fluorescence imaging has several advantages. LDI is the technique basically measuring velocity of a red blood cell (RBC) [22], not the blood perfusion. However, with ICG imaging, blood perfusion can be monitored [23]. Moreover, blood permeability can be measured by ICG imaging, [24] and ICG imaging has greater sensi-tivity for monitoring tissue perfusion [23]. LDI imaging can show detailed information in a small area and is adequate for tissue perfusion [25, 26], but not for imaging of whole organs due to the long acquisition and processing times [22]. Compared to LDI, ICG imaging had already been used for even whole body imaging [27, 28].
Due to such a high demand for understanding the blood flow characteristics in dia-betic patients, in this study, we characterized the blood flow of DM patients with and without complications by fluorescence imaging with ICG.
Methods
Volunteers
All protocol, data, and consent forms for human subjects in this research were approved by the Institutional Review Board of Gangnam Severance Hospital (Seoul, Korea). All experimental procedures were conducted according to the principles of the Declara-tion of Helsinki. Written informed consent was obtained from each subject. The control group (C) comprised volunteers who had no history of DM, inflammatory disease his-tory, or vascular disease, and had no other vascular risk factors (Table 1). DM only group (D) comprised DM patients with no history of microvascular or macrovascular disease. The DM patients with complications group (M) comprised patients with a diabetic com-plications, such as retinopathy or neuropathy, which was diagnosed by experienced phy-sicians [29, 30].
ICG imaging
For ICG time-series imaging, 120 images (768 × 512 pixels) of the dorsum of both feet and hands were taken at 5-s intervals for 10 min simultaneously with an intravenous bolus injection of ICG (0.16 mg/kg). ICG fluorescence images were obtained using a NIR imaging system equipped with a charge-coupled device (CCD) digital camera with an 830-nm bandpass filter and 760-nm light-emitting diode arrays (VISQUE, Vieworks
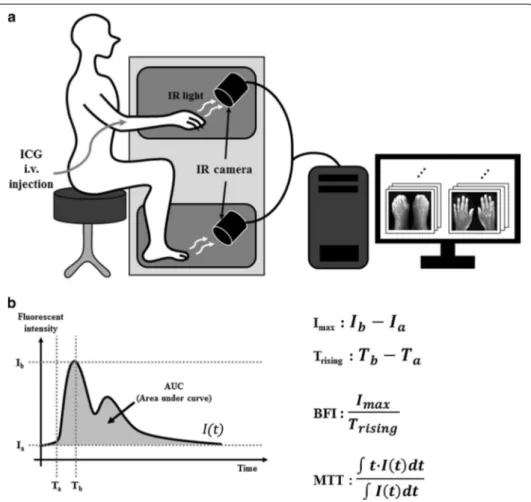
Corp., Anyang, Gyeonggi-do, Korea), as previously reported [18, 20, 31–33]. A sche-matic diagram of ICG imaging is shown in Fig. 1a.
Fluorescent image analysis
Regional ICG dynamics obtained from each pixel was analyzed to obtain the Imax value, blood flow index (BFI), mean transit time (MTT), and the area under the curve (AUC). Imax is the maximum fluorescence intensity after subtraction of the basal intensity, and the AUC is calculated as the area under the curve without baseline intensity area; both are indirect indicators of the blood volume in the region of interest (ROI) [34, 35] (Fig. 1b). The BFI is the ratio of ΔI and ΔT, which indicates the slope of the fluorescence intensity rising curve [36]. MTT is the average time from blood in and out at a specific pixel, and is calculated as shown in Fig. 1b [37]. Every parameter calculation method is shown in Fig. 1b. To analyze regional time-series pharmacokinetics, we used Visual C++ (version 10.0 SP1, Microsoft, Redmond, WA). The analyzed region was divided into toes and dorsum. The toe part represents peripheral arterial input and the dorsum part represents microvascular circulation, as reported previously [20, 32]. To extract the vascular tracer parameters from each region, we collected time-series pixel intensities as single vectors. Each value was collected from each foot and hand separately. The images of volunteers who moved their digits, hands, or feet by > 1 cm during the initial 3 min of imaging were excluded because of the movement artifact.
Vascular stimulation
All volunteers underwent imaging in a resting state and after vascular stimulation. Vas-cular stimulation was induced by pressing the brachial artery with an air cuff, which is a commonly used method for endothelial function testing [38]. After 3 min of cuff stimu-lation, volunteers rested for 1 min and then underwent a second round of ICG imaging.
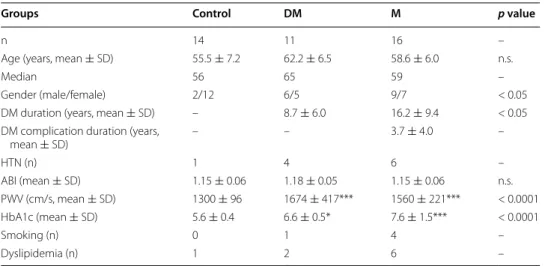
Table 1 Demography of each group
HTN hypertension, ABI Ankle-brachial index
Values were subjected to one-way analysis of variance (ANOVA) with a post hoc Bonferroni test; * p < 0.05, *** p < 0.001, compared with control; Chi square was used for analyzing gender
Groups Control DM M p value
n 14 11 16 –
Age (years, mean ± SD) 55.5 ± 7.2 62.2 ± 6.5 58.6 ± 6.0 n.s.
Median 56 65 59 –
Gender (male/female) 2/12 6/5 9/7 < 0.05
DM duration (years, mean ± SD) – 8.7 ± 6.0 16.2 ± 9.4 < 0.05 DM complication duration (years,
mean ± SD) – – 3.7 ± 4.0 – HTN (n) 1 4 6 – ABI (mean ± SD) 1.15 ± 0.06 1.18 ± 0.05 1.15 ± 0.06 n.s. PWV (cm/s, mean ± SD) 1300 ± 96 1674 ± 417*** 1560 ± 221*** < 0.0001 HbA1c (mean ± SD) 5.6 ± 0.4 6.6 ± 0.5* 7.6 ± 1.5*** < 0.0001 Smoking (n) 0 1 4 – Dyslipidemia (n) 1 2 6 –
Page 4 of 13 An et al. BioMed Eng OnLine (2018) 17:25
Results
Volunteers’ characteristics
The demographic characteristics of the volunteers are shown in Table 1. The groups were age matched. The number of female subjects was greater than that of male subjects in control, and vice versa in the M group. Pulse wave velocity (PWV), which is blood velocity by arterial pulse propagation, is shown in Table 1. PWV represents arterial stiff-ness [39, 40], and is strongly correlated with cardiovascular disease [41, 42]. Its measur-ing method is described in previous studies [43]. The PWV and HbA1c values differed significantly among the three groups (one-way ANOVA, p < 0.0001).
Blood flow characteristics
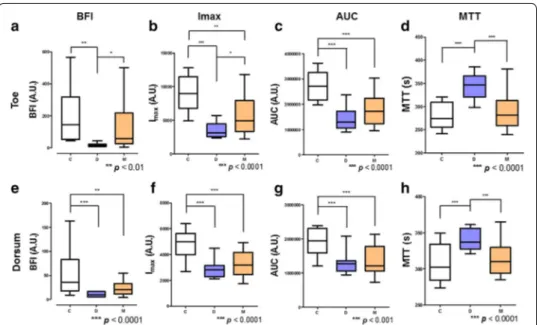
The BFI, Imax, AUC, and MTT values are shown in Table 2, Figs. 2 and 3. The C and M groups showed similar BFI and MTT values compared to the D group. However, the Imax and AUC values of both parts, and the BFI value of the dorsum part, differed signifi-cantly between the C and M groups. The C and M groups exhibited higher BFI values
Fig. 1 The ICG imaging system. a Indocyanine green (ICG) imaging scheme. ICG is bolus-injected
intravenously, and near-infrared (NIR) imaging acquisition begins simultaneously. The fluorescence images were analyzed using the respective vascular tracer parameter calculation algorithms. b Calculation algorithms for the vascular tracer parameters: Imax, difference between the maximum and minimum fluorescence
intensities; Trising, time from onset to Imax; BFI, the Imax to Trising ratio. MTT (mean transit time) is calculated as
in the toes compared with the D group, indicating a rapid and considerable increase in blood flow (Fig. 3a). Also, the D group showed a significantly higher MTT value than the C and M groups. Therefore, the mean circulation time in the D group was delayed than that in the C and M groups.
In contrast, the AUC and Imax, values differed between the C and M groups. This sug-gests that DM patients with complications have more rapid blood flow but lower abso-lute blood volume than healthy controls. In the C and M groups at toes, blood flow was faster than that in the D group, and in M group, the blood volume was less than that in the C group. The D group had the lowest blood flow and the lowest absolute blood vol-ume; the dorsum part exhibited a similar pattern to that in the toe part, with the excep-tion of BFI in the dorsum part (Fig. 3e), which suggested rapid blood flow only in the C group.
Table 2 Blood flow parameters of each group at foot
Values were subjected to one-way ANOVA with a post hoc Bonferroni test; ** p < 0.01, *** p < 0.001, compared with control
Groups C D M p value BFI Toe (A.U., mean ± SD) 199.4 ± 167.2 17.1 ± 10.9** 124.0 ± 135.6 < 0.005 Dorsum 52.8 ± 43.4 10.6 ± 5.1*** 24.0 ± 15.1** < 0.0001 Imax Toe 8967.7 ± 2700.0 3519.3 ± 1139.8*** 5798.9 ± 2742.9** < 0.0001 Dorsum 4750.4 ± 1092.9 2907.3 ± 729.9*** 3313.4 ± 960.9*** < 0.0001 MTT Toe 279.3 ± 26.0 344.6 ± 27.6*** 290.4 ± 37.0 < 0.0001 Dorsum 308.1 ± 24.0 341.6 ± 15.1*** 312.9 ± 22.7 0.0001 AUC Toe 2,736,757 ± 544,287 1,448,562 ± 479,210*** 1,774,164 ± 598,795*** < 0.0001 Dorsum 1,917,892 ± 385,771 1,309,075 ± 333,641*** 1,362,036 ± 413,776*** 0.0002
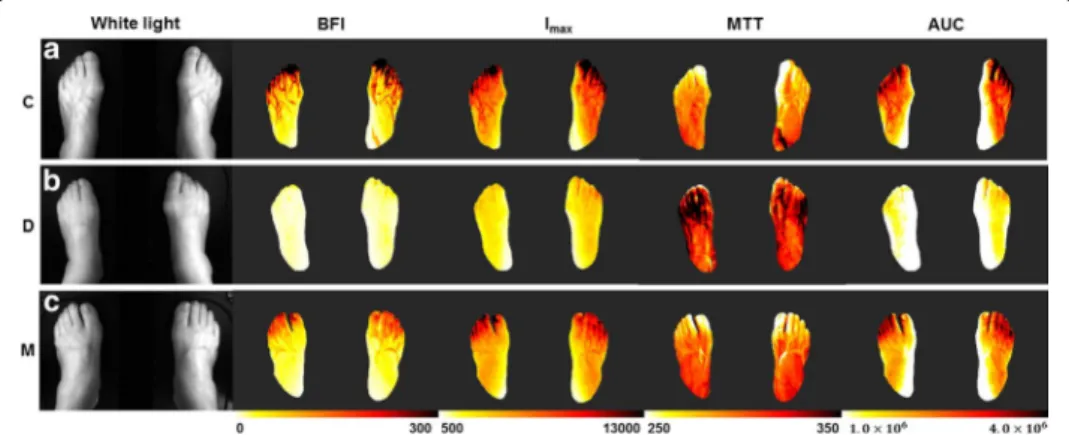
Fig. 2 Representative vascular tracer parameter maps. Representative vascular tracer parameter maps of the
control (a), diabetes mellitus (D) (b), and diabetic patients with complications (M) (c) groups. The first column shows white light images of each foot
Page 6 of 13 An et al. BioMed Eng OnLine (2018) 17:25
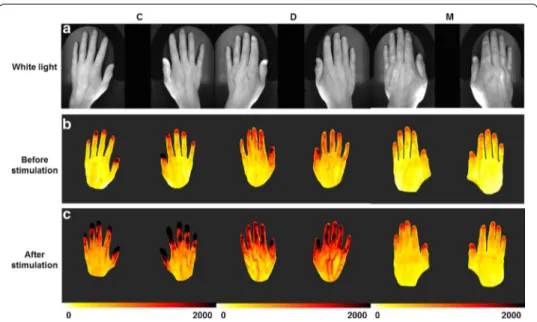
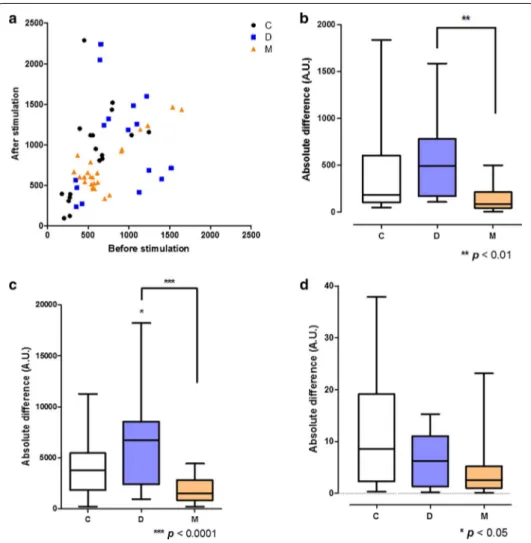
Response to stimulation
The volunteers were subjected to a stimulus, followed by a flow-mediated dilation (FMD) protocol [38], and were measured difference of the blood flow characteristics with ICG fluorescent imaging. The C and D groups, but not the M group, showed a response to the stimulus in the hands (Figs. 4, 5). In the C group, BFI increased after application of the stimulus. A portion of the D group showed an increased BFI value, and the remainder a decreased BFI value. However, in the M group, the BFI value was unaffected by the stimu-lus, as indicated by the closeness of the BFI values to the y = x line (Fig. 5a). Figure 5b shows the absolute BFI difference before and after stimulation. The BFI value varied little in the M group before and after application of the stimulus. We investigated which parameter of BFI effected to this phenomenon (Fig. 5c, d). The differences in the Imax and Trising values, which are all related with BFI, before and after stimulation were of significantly lesser mag-nitude in the M group than the other two groups. Therefore, even though the stimulus can induce blood flow increase and vasodilation, in the M group the stimulus did not induce a blood-flow response in the upper extremities. No such phenomenon was detected in the lower extremities (data not shown) as the cuff stimulus was applied to the upper arm, and endothelial function in the brachial artery does not reflect that in the tibial artery [44]. Therefore, lower extremities did not show significant response before and after stimuli.
Discussion
This study aimed to determine the blood flow characteristics of diabetic patients with complications and to suggest appropriate diagnostic values. Diabetes has a strong asso-ciation with both micro- and macro-vascular complications [45]. Diabetic retinopathy,
Fig. 3 Vascular tracer parameters. Top panels, toes; bottom panels, dorsum. Blood flow index (BFI) (a, e), Imax
(b, f), area under the curve (AUC) (c, g) and mean transit time (MTT) (d, h) values. Values were subjected to analysis of variance (ANOVA) with a post hoc Bonferroni test. The values of all parameters in the toes and dorsum in the D group were significantly different from those of the C group. The M and C group showed a similar pattern of BFI in toes and MTT; however, the BFI value in the dorsum part, and the Imax and AUC values in both parts, differed significantly between the C and M groups. The D group showed a delayed MTT value (c, g) (*p < 0.05, **p < 0.01, ***p < 0.001)
neuropathy, and nephropathy has been categorized as diabetic microvascular compli-cations in decades [2, 11, 46]. When diabetic neuropathy or retinopathy is present in diabetic patients, the progress of diabetes is more advanced, so it can be said that micro-vascular dysfunction becomes worse [11]. In this study, we considered diabetic retinopa-thy or neuroparetinopa-thy as a marker that shows severity of diabetes, and due to the increased disease severity, we considered that diabetic patients with these complications could have more severe microvascular dysfunctions than the diabetes only patients. With this grouping criterion, we divided patients into three groups, which are control, diabetic patients, and diabetic patients with complications.
We suggested that ICG imaging could monitor these diabetic complications in early stage and it could show the blood flow characteristics of each group. Our result has shown distinct features compared to previous researches with NIR imaging [7, 47]. We initially expected that blood flow would be slowest and blood volume lowest in DM patients with complications, followed by DM patients and controls. However, the result was not matched to our assumption. Blood flow velocity and volume were lowest in the DM only group, which is considered as intermediate-stage of disease prognosis. Through Figs. 2, 3, we could find out the blood flow pattern of each group. The C group showed the fastest blood flow and largest blood volume in the feet, both arterial and capillary flow. This blood flow is retarded and reduced in D group. Blood flow was higher in the M group than the D group, but blood volume was not, especially in the dorsum part, likely due to a reduced vasodilatory capacity. In the dorsum part, which reflects the blood flow of capillaries, BFI value is significantly decreased in the M group compared to the C group, not like in the toe part. The toe/brachial index (TBI) was significantly lower in D group than in the C and M groups, in previous study [48]. Also, in diabetic complica-tions patients, transcutaneous oxygen (TcPO2) was significantly different due to patient’s position, likely due to the disturbance of vessel autoregulation by autonomic neuropathy
Fig. 4 BFI maps before and after cuff stimulation. Representative BFI maps before (b) and after (c) stimulation
Page 8 of 13 An et al. BioMed Eng OnLine (2018) 17:25
[49]. From these factors, it can be assumed that microvascular vessel control fails due to vascular complications, which reduces vascular resistance, in M group. Therefore, the BFI and MTT values of the M group were similar to those of the control group, but it does not mean that C and M groups have the same blood flow characteristics.
Moreover, it has been reported in several studies that DM leads to vascular dysfunc-tion, even in the absence of microvascular complications [3, 50, 51]. Blood flow is insuffi-cient in early DM patients but is faster in DM patients with microvascular complications [50, 52, 53]; this is in agreement with our finding of slower blood flow and a lower blood volume in the D group. In the presence of diabetic peripheral arterial disease (PAD), the PWV is in the normal range, whether DM without PAD patients showed higher PWV value [54]. This is in agreement with our data (Table 1). Thus, vascular tone is disrupted in DM patients with complications, and so all vascular shunts are open and vascular resistance is reduced [48, 49, 55]. Therefore, in DM patients, peripheral limb blood flow dramatically decreases because of vessel damage due to hyperglycemia. It could be said that even there is no diabetic complications, DM patients seemed to have microvascular
Fig. 5 Response to stimulation. a X-axis, BFI values in the fingers before cuff stimulation; y-axis, BFI values
after cuff stimulation. Absolute difference in BFI values (b), Imax values (c), and Trising values (d) in the fingers before and after stimulation. Note that the M group did not show a response to stimulation. Values were subjected to ANOVA, with a post hoc Bonferroni test
insufficiencies. Then, when vascular disturbance has been exacerbated to get microvas-cular problems, it can be assumed that arteriovenous fistula is occurred, which reduces vascular resistance. Although the vascular resistance is decreased, blood circulation is impaired by damage due to hyperglycemia, and the total blood volume does not recover.
When there is a vascular disorder such as endothelial dysfunction, it is well known that people do not properly response to the vascular stimulations [38, 43]. Because DM patients are vulnerable to vascular disorder and endothelial dysfunction [1, 3, 5, 56], they do not react properly to stimuli. In this study, we found that DM patients with and with-out complications react to vascular stimuli differently (Figs. 4, 5). The DM patients with complications showed a vascular response of lesser magnitude than the controls or the DM patients in upper extremities. Regarding the BFI values before and after stimulation, the largest variance was in the C group and the lowest in the M group (Fig. 5). This was a distinguishing feature of DM patients with complications.
Interestingly, some patients in the DM group showed an increased BFI value after stimulation, but two patients (both hands) showed a decreased BFI value (Fig. 5a). The only common feature of two patients is hypertension. It is well known that DM patients have an impaired macrovascular response [57, 58], but only two of our patients showed an impaired vascular blood flow response. This is likely because ICG imaging reveals not only macrovascular endothelial cell reactions but also the microvascular systemic reac-tion and endothelial cell reacreac-tions. In addireac-tion, autonomic dysfuncreac-tion, which is related to expansion of microvascular vessels, in DM patients may also explain their post-stim-ulation blood flow characteristics. The FMD and nitroglycerin-mediated dilation tests are typically used to assess vascular endothelial cell reactions [43]; these reflect the reac-tivity of mainly macrovascular endothelial cells [59]. However, endothelial cell dysfunc-tion is a systemic process, in which both macrovascular and microvascular reactivity should be considered. Moreover, the FMD test has several limitations that FMD meth-odology needs to be standardized and probe position can dramatically affect the result [43]. Therefore, our ICG imaging method can be used for macro- and micro-vascular endothelial cell function testing, and for assessing autonomic dysfunction. Although our findings should be verified in further studies, our method shows promise for evaluating the responses of vascular endothelial cells.
We have found several blood flow characteristics of patients with diabetes and dia-betic complications, but this study had several limitations. Due to the small population and the nature of DM, risk factors for vascular disease—such as smoking, dyslipidemia, and hypertension—could not be adjusted for. In addition, all of the DM patients were taking diabetes medications, and some of the controls were taking medications for non-vascular diseases.
Conclusions
We report herein a significantly different blood flow pattern in DM patients with and without complications by ICG fluorescent imaging. DM only patients have vascular disruption despite the absence of symptoms of vascular disease; this was reflected in ICG fluorescent images. In DM patients with complications, ICG time-series dynam-ics showed normal-mimicking patterns which are similar with that in the controls, but the blood volume was lower than that in the control. The more rapid blood flow in DM
Page 10 of 13 An et al. BioMed Eng OnLine (2018) 17:25
patients with than without complications may be due to autosympathectomy, which may lead to vascular shunt opening and reduction in vascular resistance.
We report here a novel vascular endothelial cell function test based on ICG fluores-cent imaging. Although the underlying mechanism is unclear and further clinical study is necessary, our method enables measurement of not only macrovascular reactions but also microvascular and systemic reactions.
In this study, we analyzed the ICG images with dividing the image as segments of arte-rial blood flow and capillary blood flow. The results suggest that diabetic patients with and without complications have unique peripheral blood flow characteristics.
Abbreviations
ICG: indocyanine green; BFI: blood flow index; Imax: maximum intensity; MTT: mean transit time; PWV: pulse wave veloc-ity; DM: diabetes mellitus; PAD: peripheral arterial disease; ABI: Ankle-brachial index; HTN: hypertension.
Authors’ contributions
YA was responsible for writing the manuscript. YA and JL were responsible for data analysis and algorithmic develop-ment. YK, YA and CA were responsible for planning and carrying out the clinical measurements. KK was responsible to medical advice and discussion. CC was responsible for overall planning of the study. All authors read and approved the final manuscript.
Author details
1 Department of Bio and Brain Engineering, KAIST, Daejeon, Republic of Korea. 2 R&D Center, Vieworks Co., Anyang-si, Gyeonggi-do, Republic of Korea. 3 Cellex Life Sciences, Inc, Daejeon, Republic of Korea. 4 Department of Internal Medicine, Yonsei University College of Medicine, Seoul, Republic of Korea. 5 Department of Internal Medicine, College of Medicine, Ewha Womans University, Seoul, Republic of Korea.
Acknowledgements
Not applicable.
Competing interests
The authors declare that they have no competing interests.
Availability of data and materials
All data generated or analyzed during this study are included in this published article.
Consent for publication
Written informed consent was obtained from each subject.
Ethics approval and consent to participate
All protocol, data, and consent forms from human subjects in this research were approved by the Institutional Review Board of Gangnam Severance Hospital (Seoul, Korea). All experimental procedures were conducted according to the principles described in the Declaration of Helsinki.
Funding
This research was supported by the Bio & Medical Technology Development Program of the National Research Founda-tion (NRF) funded by the Korean government, MSIP (NRF-2016M3A9B6945831).
Publisher’s Note
Springer Nature remains neutral with regard to jurisdictional claims in published maps and institutional affiliations. Received: 21 September 2017 Accepted: 16 February 2018
References
1. Cooper ME, Bonnet F, Oldfield M, Jandeleit-Dahm K. Mechanisms of diabetic vasculopathy: an overview. Am J Hypertens. 2001;14(5 Pt 1):475–86 (PubMed PMID: 11368471).
2. Forbes JM, Cooper ME. Mechanisms of diabetic complications. Physiol Rev. 2013;93(1):137–88. https ://doi. org/10.1152/physr ev.00045 .2011 (PubMed PMID: 23303908).
3. Rask-Madsen C, King GL. Vascular complications of diabetes: mechanisms of injury and protective factors. Cell Metab. 2013;17(1):20–33. https ://doi.org/10.1016/j.cmet.2012.11.012 (PubMed PMID: 23312281; PubMed Central
PMCID: PMCPMC3546345).
4. Krentz AJ, Clough G, Byrne CD. Interactions between microvascular and macrovascular disease in diabetes: pathophysiology and therapeutic implications. Diabetes Obes Metab. 2007;9(6):781–91. https ://doi.org/10.111 1/j.1463-1326.2007.00670 .x (PubMed PMID: 17924862).
5. Paneni F, Beckman JA, Creager MA, Cosentino F. Diabetes and vascular disease: pathophysiology, clinical conse-quences, and medical therapy: part I. Eur Heart J. 2013;34(31):2436–43. https ://doi.org/10.1093/eurhe artj/eht14 9
(PubMed PMID: 23641007; PubMed Central PMCID: PMCPMC3743069).
6. Brownrigg JR, Apelqvist J, Bakker K, Schaper NC, Hinchliffe RJ. Evidence-based management of PAD & the diabetic foot. Eur J Vasc Endovasc Surg. 2013;45(6):673–81. https ://doi.org/10.1016/j.ejvs.2013.02.014 PubMed PMID:
23540807.
7. Igari K, Kudo T, Uchiyama H, Toyofuku T, Inoue Y. Quantitative evaluation of microvascular dysfunction in peripheral neuropathy with diabetes by indocyanine green angiography. Diabetes Res Clin Pract. 2014;104(1):121–5. https :// doi.org/10.1016/j.diabr es.2014.01.022 (PubMed PMID: 24552681).
8. Picchi A, Capobianco S, Qiu T, Focardi M, Zou X, Cao JM, et al. Coronary microvascular dysfunction in diabetes melli-tus: a review. World J Cardiol. 2010;2(11):377–90. https ://doi.org/10.4330/wjc.v2.i11.377 (PubMed PMID: 21179305;
PubMed Central PMCID: PMCPMC3006474).
9. Haffner SM. Management of dyslipidemia in adults with diabetes. Diabetes Care. 1998;21(1):160–78 (PubMed
PMID: 9538988).
10. Asakawa H, Tokunaga K, Kawakami F. Comparison of risk factors of macrovascular complications: peripheral vascular disease, cerebral vascular disease, and coronary heart disease in Japanese type 2 diabetes mellitus patients. J Diabe-tes Complicat. 2000;14(6):307–13 (PubMed PMID: 11120454).
11. Laakso M. Heart in diabetes: a microvascular disease. Diabetes Care. 2011;34(Suppl 2):S145–9. https ://doi. org/10.2337/dc11-s209 (PubMed PMID: 21525446; PubMed Central PMCID: PMCPMC3632152).
12. Desmettre T, Devoisselle JM, Mordon S. Fluorescence properties and metabolic features of indocyanine green (ICG) as related to angiography. Surv Ophthalmol. 2000;45(1):15–27 (PubMed PMID: 10946079).
13. Meier R, Thurmel K, Moog P, Noel PB, Ahari C, Sievert M, et al. Detection of synovitis in the hands of patients with rheumatologic disorders: diagnostic performance of optical imaging in comparison with magnetic resonance imag-ing. Arthritis Rheum. 2012;64(8):2489–98. https ://doi.org/10.1002/art.34467 (PubMed PMID: 22421978). 14. Mohajerani P, Koch M, Thurmel K, Haller B, Rummeny EJ, Ntziachristos V, et al. Fluorescence-aided tomographic
imaging of synovitis in the human finger. Radiology. 2014;272(3):865–74. https ://doi.org/10.1148/radio l.14132 128
(PubMed PMID: 24827999).
15. Werner SG, Langer HE, Ohrndorf S, Bahner M, Schott P, Schwenke C, et al. Inflammation assessment in patients with arthritis using a novel in vivo fluorescence optical imaging technology. Ann Rheum Dis. 2012;71(4):504–10. https ://doi.org/10.1136/annrh eumdi s-2010-14828 8 (PubMed PMID: 22388997; PubMed Central PMCID:
PMCPMC3298665).
16. Werner SG, Langer HE, Schott P, Bahner M, Schwenke C, Lind-Albrecht G, et al. Indocyanine green-enhanced fluores-cence optical imaging in patients with early and very early arthritis: a comparative study with magnetic resonance imaging. Arthritis Rheum. 2013;65(12):3036–44 (PubMed PMID: WOS:000327692600006).
17. Mohajerani P, Meier R, Noel PB, Rummeny EJ, Ntziachristos V. Spatiotemporal analysis for indocyanine green-aided imaging of rheumatoid arthritis in hand joints. J Biomed Opt. 2013;18(9):097004 (PubMed PMID:
WOS:000324747300021).
18. Kang Y, Lee J, Kwon K, Choi C. Dynamic fluorescence imaging of indocyanine green for reliable and sensitive diagno-sis of peripheral vascular insufficiency. Microvasc Res. 2010;80(3):552–5 (PubMed PMID: WOS:000284678300036). 19. Igari K, Kudo T, Toyofuku T, Jibiki M, Inoue Y, Kawano T. Quantitative evaluation of the outcomes of
revasculariza-tion procedures for peripheral arterial disease using indocyanine green angiography. Eur J Vasc Endovasc Surg. 2013;46(4):460–5. https ://doi.org/10.1016/j.ejvs.2013.07.016 PubMed PMID: 23973274.
20. Seo J, An Y, Lee J, Ku T, Kang Y, Ahn C, et al. Principal component analysis of dynamic fluorescence images for diagnosis of diabetic vasculopathy. J Biomed Opt. 2016;21(4):46003. https ://doi.org/10.1117/1.JBO.21.4.04600 3
(PubMed PMID: 27071414).
21. Joh JH, Park HC, Han SA, Ahn HJ. Intraoperative indocyanine green angiography for the objective measurement of blood flow. Ann Surg Treat Res. 2016;90(5):279–86. https ://doi.org/10.4174/astr.2016.90.5.279 (PubMed PMID:
27186573; PubMed Central PMCID: PMCPMC4865706).
22. Briers JD. Laser Doppler, speckle and related techniques for blood perfusion mapping and imaging. Physiol Meas. 2001;22(4):R35–66 (PubMed PMID: WOS:000172456200001).
23. Kang Y, Choi M, Lee J, Koh GY, Kwon K, Choi C. Quantitative analysis of peripheral tissue perfusion using spatiotem-poral molecular dynamics. PLoS ONE. 2009;4(1):e4275. https ://doi.org/10.1371/journ al.pone.00042 75 (PubMed
PMID: 19169354; PubMed Central PMCID: PMCPMC2626246).
24. Choi M, Choi K, Ryu SW, Lee J, Choi C. Dynamic fluorescence imaging for multiparametric measurement of tumor vasculature. J Biomed Opt. 2011;16(4):046008. https ://doi.org/10.1117/1.35629 56 (PubMed PMID: 21529077). 25. Leutenegger M, Martin-Williams E, Harbi P, Thacher T, Raffoul W, Andre M, et al. Real-time full field laser Doppler
imaging. Biomed Opt Express. 2011;2(6):1470–7 (PubMed PMID: WOS:000299878800008).
26. Mermod T KS, Raffoul W, El Ezzi O, Anthony S de Buys Roessingh. Tissue perfusion assessment of paediatric burns by laser Doppler imaging (LDI). Curr Pediatr Res. 2017;21(1):69–76.
27. Hillman EMC, Moore A. All-optical anatomical co-registration for molecular imaging of small animals using dynamic contrast. Nat Photonics. 2007;1(9):526–30. https ://doi.org/10.1038/nphot on.2007.146 (PubMed PMID:
WOS:000249609100018).
28. Piper SK, Habermehl C, Schmitz CH, Kuebler WM, Obrig H, Steinbrink J, et al. Towards whole-body fluorescence imaging in humans. PLoS ONE. 2013;8(12):e83749. https ://doi.org/10.1371/journ al.pone.00837 49 (PubMed PMID:
24391820; PubMed Central PMCID: PMCPMC3877082).
29. Boyko EJ, Ahroni JH, Stensel VL, Smith DG, Davignon DR, Pecoraro RE. Predictors of transcutaneous oxy-gen tension in the lower limbs of diabetic subjects. Diabet Med. 1996;13(6):549–54. 10.1002/(sici)1096-9136(199606)13:6<549::aid-dia126>3.0.co;2-r. (PubMed PMID: 8799659).
30. Deng W, Dong X, Zhang Y, Jiang Y, Lu D, Wu Q, et al. Transcutaneous oxygen pressure (TcPO(2)): a novel diagnostic tool for peripheral neuropathy in type 2 diabetes patients. Diabetes Res Clin Pract. 2014;105(3):336–43. https ://doi. org/10.1016/j.diabr es.2014.05.012 (PubMed PMID: 25023217).
Page 12 of 13 An et al. BioMed Eng OnLine (2018) 17:25
31. Kang Y, Lee J, Kwon K, Choi C. Assessment of peripheral tissue perfusion by optical dynamic fluorescence imaging and nonlinear regression modeling. In: Proceedings of SPIE. 2010. vol. 7548. p. 75483L. https ://doi. org/10.1117/12.84162 0.
32. Kang Y, Lee J, An Y, Jeon J, Choi C. Segmental analysis of indocyanine green pharmacokinetics for the reli-able diagnosis of functional vascular insufficiency. J Biomed Opt. 2011;16(3):030504 (PubMed PMID:
WOS:000289869200004).
33. An Y, Jeon JW, Kwon K, Choi C. Application of dynamic indocyanine green perfusion imaging for evaluation of vasoactive effect of acupuncture: a preliminary follow-up study on normal healthy volunteers. Med Devices (Auckl). 2014;7:17–21. https ://doi.org/10.2147/MDER.S5671 6 (PubMed PMID: 24600252; PubMed Central PMCID:
PMCPMC3933705).
34. Hopton P, Walsh TS, Lee A. Measurement of cerebral blood volume using near-infrared spectroscopy and indocya-nine green elimination. J Appl Physiol. 1999;87(5):1981–7 (PubMed PMID: WOS:000083675000052).
35. Zierler K. Indicator dilution methods for measuring blood flow, volume, and other properties of biological systems: a brief history and memoir. Ann Biomed Eng. 2000;28(8):836–48 (PubMed PMID: WOS:000165604200002). 36. Kuebler WM, Sckell A, Habler O, Kleen M, Kuhnle GEH, Welte M, et al. Noninvasive measurement of regional cerebral
blood flow by near-infrared spectroscopy and indocyanine green. J Cerebr Blood Flow Metab. 1998;18(4):445–56
(PubMed PMID: WOS:000072852700013).
37. Rempp KA, Brix G, Wenz F, Becker CR, Guckel F, Lorenz WJ. Quantification of regional cerebral blood-flow and vol-ume with dynamic susceptibility contrast-enhanced MR-imaging. Radiology. 1994;193(3):637–41 (PubMed PMID:
WOS:A1994PT55300013).
38. Flammer AJ, Anderson T, Celermajer DS, Creager MA, Deanfield J, Ganz P, et al. The assessment of endothelial function from research into clinical practice. Circulation. 2012;126(6):753–67. https ://doi.org/10.1161/Circu latio naha.112.09324 5 (PubMed PMID: WOS:000307472600021).
39. Wilkinson IB, Cockcroft JR, Webb DJ. Pulse wave analysis and arterial stiffness. J Cardiovasc Pharmacol. 1998;32(Suppl 3):S33–7 (PubMed PMID: 9883745).
40. Nichols WW. Clinical measurement of arterial stiffness obtained from noninvasive pressure waveforms. Am J Hyper-tens. 2005;18(1):3s–10s. https ://doi.org/10.1016/j.amjhy per.2004.10.009 (PubMed PMID: WOS:000226827000002). 41. Blacher J, Asmar R, Djane S, London GM, Safar ME. Aortic pulse wave velocity as a marker of cardiovascular risk in
hypertensive patients. Hypertension. 1999;33(5):1111–7 (PubMed PMID: WOS:000080485100004). 42. Cruickshank K, Riste L, Anderson SG, Wright JS, Dunn G, Gosling RG. Aortic pulse-wave velocity and its
rela-tionship to mortality in diabetes and glucose intolerance: an integrated index of vascular function? Cir-culation. 2002;106(16):2085–90. https ://doi.org/10.1161/01.Cir.00000 33824 .02722 .F7 (PubMed PMID:
WOS:000178683600013).
43. Arrebola-Moreno AL, Laclaustra M, Kaski JC. Noninvasive assessment of endothelial function in clinical practice. Rev Esp Cardiol. 2012;65(1):80–90. https ://doi.org/10.1016/j.rec.2011.10.004 (PubMed PMID: WOS:000299809200012). 44. Black CD, Vickerson B, McCully KK. Noninvasive assessment of vascular function in the posterior tibial artery of
healthy humans. Dyn Med. 2003;2(1):1 (PubMed PMID: 12628021; PubMed Central PMCID: PMCPMC151670). 45. Cade WT. Diabetes-related microvascular and macrovascular diseases in the physical therapy setting. Phys Ther.
2008;88(11):1322–35. https ://doi.org/10.2522/ptj.20080 008 (PubMed PMID: 18801863; PubMed Central PMCID:
PMCPMC2579903).
46. Rosenson RS, Fioretto P, Dodson PM. Does microvascular disease predict macrovascular events in type 2 diabe-tes? Atherosclerosis. 2011;218(1):13–8. https ://doi.org/10.1016/j.ather oscle rosis .2011.06.029 (PubMed PMID:
21763654).
47. Holmer A, Kämmerer PW, Dau M, Grambow E, Wahl P. The ability of hyperspectral imaging to detect perfusion disorders. In: Proceedings of SPIE, diffuse optical spectroscopy and imaging VI. 2017; vol. 10412. p. 1041213. (Epub
July 28, 2017).
48. Uccioli L, Monticone G, Durola L, Russo F, Mormile F, Mennuni G, et al. Autonomic neuropathy influences great toe blood pressure. Diabetes Care. 1994;17(4):284–7 (PubMed PMID: 8026283).
49. Zimny S, Dessel F, Ehren M, Pfohl M, Schatz H. Early detection of microcirculatory impairment in diabetic patients with foot at risk. Diabetes Care. 2001;24(10):1810–4 (PubMed PMID: 11574447).
50. Fowler MJ. Microvascular and macrovascular complications. Clin Diabetes. 2008;26(2):6. https ://doi.org/10.2337/ diacl in.26.2.77.
51. Schaper NC, Nabuurs-Franssen MH, Huijberts MS. Peripheral vascular disease and type 2 diabetes mellitus. Diabetes Metab Res Rev. 2000;16(Suppl 1):S11–5 (PubMed PMID: 11054881).
52. Williams DT, Pugh ND, Coleman DP, Harding KG, Price P. Review: the laboratory evaluation of lower limb perfusion in diabetes mellitus. A clinical review. Br J Diabetes Vasc Dis. 2005;5(2):64–70. https ://doi.org/10.1177/14746 51405 00500 20301 .
53. Williams DT, Price P, Harding KG. The influence of diabetes and lower limb arterial disease on cutaneous foot perfu-sion. J Vasc Surg. 2006;44(4):770–5. https ://doi.org/10.1016/j.jvs.2005.06.040 (PubMed PMID: 16930928). 54. Yokoyama H, Shoji T, Kimoto E, Shinohara K, Tanaka S, Koyama H, et al. Pulse wave velocity in lower-limb arteries
among diabetic patients with peripheral arterial disease. J Atheroscler Thromb. 2003;10(4):253–8 (PubMed PMID:
14566089).
55. Flynn MD, Tooke JE. Diabetic neuropathy and the microcirculation. Diabet Med. 1995;12(4):298–301 (PubMed
PMID: 7600742).
56. Akbari CM, LoGerfo FW. Diabetes and peripheral vascular disease. J Vasc Surg. 1999;30(2):373–84 (PubMed PMID:
10436463).
57. Kawano H, Motoyama T, Hirashima O, Hirai N, Miyao Y, Sakamoto T, et al. Hyperglycemia rapidly suppresses flow-mediated endothelium-dependent vasodilation of brachial artery. J Am Coll Cardiol. 1999;34(1):146–54 (PubMed
• We accept pre-submission inquiries
• Our selector tool helps you to find the most relevant journal • We provide round the clock customer support
• Convenient online submission • Thorough peer review
• Inclusion in PubMed and all major indexing services • Maximum visibility for your research
Submit your manuscript at www.biomedcentral.com/submit
Submit your next manuscript to BioMed Central
and we will help you at every step:
58. Henry RM, Ferreira I, Kostense PJ, Dekker JM, Nijpels G, Heine RJ, et al. Type 2 diabetes is associated with impaired endothelium-dependent, flow-mediated dilation, but impaired glucose metabolism is not: The Hoorn Study. Ath-erosclerosis. 2004;174(1):49–56. https ://doi.org/10.1016/j.ather oscle rosis .2004.01.002 (PubMed PMID: 15135250). 59. Deanfield JE, Halcox JP, Rabelink TJ. Endothelial function and dysfunction: testing and clinical relevance. Circulation.