P R O C E E D I N G S
Open Access
Linear predictive coding representation of
correlated mutation for protein sequence
alignment
Chan-seok Jeong, Dongsup Kim
*From Third International Workshop on Data and Text Mining in Bioinformatics (DTMBio) 2009
Hong Kong. 6 November 2009
Abstract
Background: Although both conservation and correlated mutation (CM) are important information reflecting the different sorts of context in multiple sequence alignment, most of alignment methods use sequence profiles that only represent conservation. There is no general way to represent correlated mutation and incorporate it with sequence alignment yet.
Methods: We develop a novel method, CM profile, to represent correlated mutation as the spectral feature derived by using linear predictive coding where correlated mutations among different positions are represented by a fixed number of values. We combine CM profile with conventional sequence profile to improve alignment quality. Results: For distantly related protein pairs, using CM profile improves the profile-profile alignment with or without predicted secondary structure. Especially, at superfamily level, combining CM profile with sequence profile
improves profile-profile alignment by 9.5% while predicted secondary structure does by 6.0%. More significantly, using both of them improves profile-profile alignment by 13.9%. We also exemplify the effectiveness of CM profile by demonstrating that the resulting alignment preserves share coevolution and contacts.
Conclusions: In this work, we introduce a novel method, CM profile, which represents correlated mutation information as paralleled form, and apply it to the protein sequence alignment problem. When combined with conventional sequence profile, CM profile improves alignment quality significantly better than predicted secondary structure information, which should be beneficial for target-template alignment in protein structure prediction. Because of the generality of CM profile, it can be used for other bioinformatics applications in the same way of using sequence profile.
Background
Currently, the comparison of multiple sequence align-ments (MSAs) is based on aligning the sequence profiles that represent conservation at specific positions. How-ever, the alignment quality of profile-profile alignment becomes unreliable as the sequence identity of seed sequences becomes low [1]. Even though using pre-dicted secondary structure as additional information slightly improves profile-profile alignment, it is still unsatisfactory since the most protein secondary
structure prediction methods are based on sequence profile. In this situation, using correlated mutation information originated from coevolution of two or more residue positions would be informative.
Constructing alignments with high quality is impor-tant in comparative modeling, in which target-template alignment is a crucial step together with template selec-tion, but the sequence alignments based solely on statis-tical amino acid matches become undependable at low sequence identity. Particularly, below 20% sequence identity referred to as midnight zone, using sequence alignment without structural evidence can be proble-matic. Practically, it is found that many proteins with * Correspondence: kds@kaist.ac.kr
Department of Bio and Brain Engineering, KAIST, 373-1 Guseong-dong, Yuseong-gu, Daejeon, 305-701, Korea
© 2010 Kim and Jeong; licensee BioMed Central Ltd. This is an open access article distributed under the terms of the Creative Commons Attribution License (http://creativecommons.org/licenses/by/2.0), which permits unrestricted use, distribution, and reproduction in any medium, provided the original work is properly cited.
similar structure have low sequence identity [2], and, in CASP7, about half of the targets have the single best templates with <20% sequence identity [3]. This means that the reliability of alignment in the midnight zone is a bottleneck for protein structure prediction, and there-fore its improvement is strongly desirable.
Correlated mutation is estimated in various ways. McBASC algorithm [4] calculates the correlation of amino acid substitutions at individual positions. SCA algorithm and its variants [5-7] measure the relative amino acid frequencies observed after perturbing the MSA. Mutual information [8,9] is used for estimating correlated mutation. Recently, it is also found that nor-malizing mutual information improves the determina-tion of coevolving residues [10,11]. In spite of these efforts, the application of correlated mutation is restricted mainly to inter-residue contact prediction [12,13] and functional site prediction [5]. Moreover, it has not been utilized for the purpose of sequence align-ment, the most basic procedure in sequence analysis, and there is no universal method for comparing corre-lated mutation patterns of different proteins.
In this article, we introduce a novel method, CM profile, which represents correlated mutation based on signal pro-cessing technique called linear predictive coding (LPC) [14], and apply it to the protein sequence alignment pro-blem. The results show that the employment of correlated mutation improves alignment quality consistently at differ-ent SCOP levels and sequence iddiffer-entities. The analysis on a few examples shows that the use of CM profile makes alignments preserve correlated mutation and the residues with common contacts are aligned with high scores.
Methods
Data
We prepare protein pairs which are non-redundant and distantly related with each other. The data are derived from SCOP [15] version 1.69 with <35% sequence iden-tity downloaded from Astral compendium [16]. 4253 domains whose MSA is composed of less than 100 sequences are omitted because correlated mutation ana-lysis using MSA with a small number of sequences can be unreliable and include much noise, and 2501 domains remain. To make pairs of distantly related homologs, we select superfamilies with at least 10 domains, and pair the domains with each other in each superfamily. The selected domains are composed of 1105 domains of 50 folds, 60 superfamilies, and 341 families. For parameter selection we use 388 pairs con-sisting of 200 domains randomly chosen, and for testing use 9118 pairs consisting of the remaining 905 domains.
The frequency matrices and the position-specific score matrices (PSSMs) representing sequence profiles are
automatically generated by running PSI-BLAST [17] ver-sion 2.2.19 against NCBI nr database with “–j 3 –e 0.001 – h 0.001” options. The MSAs used for constructing CM profiles are also generated by running PSI-BLAST with the same option, and then thinned by removing the sequences covering less than 50% of the seed sequence and clustering the remaining sequences at 65% sequence identity.
Representation of correlated mutation
If we have a sequence of length n, we build, at each position, 400 correlated mutation vectors consisting of n correlated mutation scores with other positions for one of 400 possible amino acids pairs. The correlated mutation vector for amino acid pair a, b at position i, m(ai, b) = [m(ai, b1) m(ai, b2)… m(ai, bn)], consists of
n log-odds scores defined as
m a b f a b f a f b for i j i j i j i j ( , ) log ( , ) ( ) ( ) 0 otherwise
where f(ai, bj) is the joint frequency of amino acid a at
position i and amino acid b at position j, f(ai) is the
marginal frequency calculated as f a bi j
b ( , )
20
, andf(bj) is the marginal frequency calculated as
f a bi j
a ( , )
20
. The correlated mutation score m(ai, bj)of amino acid a at position i and amino acid b at posi-tion j has a positive value if they have positive correla-tion with each other, a negative value if they have negative correlation, or zero if they evolve indepen-dently. Because a small number of observations can make the joint frequency very noisy, we apply low number cor-rection [10], thereby defining the joint frequency as
f a b N a b N
i j
i j
( , ) ( , )
where N(ai, bj) is the number of observations of amino
acid a at position i and amino acid b at position j in the
MSA, and N N a bi j
a a
20
20( ( , )).Since the dimension of correlated mutation vector is variable depending on sequence length, the correlated mutation vectors of distinct sequences are not paral-leled. Therefore, we extract the spectral features, known as LPC cepstral coefficients, to represent the correlated mutation vector. LPC cepstral coefficients have been used for comparing DNA and protein sequences [18].
The basic assumption of LPC model is that the pre-sent sample at time n, s(n), can be calculated as a linear combination of the past p samples. The approximation is expressed as [14] s n a s n a s n a s n p a s n k p k k p ( ) ( ) ( ) ... ( ) ( )
1 2 1 1 2where the coefficients {ak} are constants called as LPC
coefficients, which are determined by minimizing the sum of squared error
E s n s n s n a s n k n k k p n
[ ( ) ( )]2 [ ( ) ( )] 1 2To solve this equation for the predictor coefficients {ak}, we differentiate E with respect to each ak and set
the result to zero,
E
ak 0, k 1 2, ,...,p
The result gives a set of p linear equations
r i k ak r i i p k p ( ) ( ), , ,...,
1 2 1where r(i), known as the autocorrelation function of s(n), is defined as
r i s n s n i
n
( )
( ) ( )and symmetric, i.e. r(– k) = r(k). The linear equations can be expressed in matrix form as
r r r p r r r p r p r p r ( ) ( ) ( ) ( ) ( ) ( ) ( ) ( ) ( ) 0 1 1 1 0 2 1 2 0 a a a r r r p p 1 2 1 2 ( ) ( ) ( ) Since the p x p matrix of autocorrelation values is a Toeplitz matrix that is symmetric and all the diagonal elements are equal, the solution of the linear equations can be calculated recursively and very efficiently through Levinson-Durbin algorithm without relatively expensive computation such as matrix inversion. If the linear equation is solved, more advanced spectral feature called as LPC cepstral coefficients can be derived from the LPC coefficients by the following recursion.
c E m a k mc a m p k mc a m p m m k m k k m k m k k p
log( ) 0 1 1 1 1 .By using the LPC analysis process described above, we transform a correlated mutation vector to the CM pro-file consisting of the LPC cepstral coefficients. Since the cepstral coefficients are decaying, we use only the first L coefficients excluding c0. Additionally, we normalize CM
profiles of a protein by fitting the mean and variance into zero and one, respectively, to weight them equally regardless of the orders. We obtain consequently a L-dimensional CM profile, c(ai, b), that represents the
cor-related mutations between amino acid a at position i and amino acid b at other positions. In other word, all the correlated mutation between position i and other positions are represented as 400 x L coefficients.
Alignment
To compare sequences, we define the alignment score between the position i of a protein and the position j of another protein as follows,
S i j( , )wmut mutS ( , )i j w Scor cor( , )i j w Ssec sec( , ),i j where wmut, wcor, and wsecdenote the weights, and Smut
(i, j), Scor(i, j), and Ssec(i, j) denote the similarity scores of
sequence profiles, CM profiles, and secondary structure predictions, respectively, between the positions i and j. Smut(i, j) is the sequence profile score defined as
Smut i j q a t a t a q a i j i j a ( , ) ( ) ( ) ( ) ( ),
2 1 20where q(ai), q(aj), t(ai), and t(aj) are the frequencies
and the PSSM scores of amino acid a at position i and j respectively. Scor(i, j) is the CM profile score defined as
S i j d d c a b c a b cor i j b a ( , ) log ( ( , ), ( , ),
0 1 20 1 20Where d(c(ai, b), c(aj, b)) is the Euclidean distance
between CM profile c(ai, b) at position i and CM profile
c(aj, b) at position j, d0 is the threshold, and a is the
scaling factor. The Scor(i, j) gives a positive score in case
that the distance between CM profiles is less than d0,
and a negative score in case that the distance is more than d0. Ssec(i, j) is the secondary structure prediction
position i and j are identical, and 0 otherwise. We use PSIPRED [19] to predict secondary structures. Based on the score matrix consisting of S(i, j) for all i and j, we perform the Needleman-Wunsch algorithm with affine gap costs and baseline to find the optimal alignment.
Assessment and parameter selection
We assess the alignment quality by measuring the aver-age MaxSub score [20] of models derived from sequence alignments. The model is generated by directly copying the coordinates of C-alpha atoms based on the sequence alignment, and the MaxSub score of the model is com-puted with default options. The MaxSub score identifies the largest subset of C-alpha atoms of a model that superimpose well over the experimental structure, and provides a single normalized score in the range of 0 to 1. The MaxSub score 0 indicates a completely wrong model, and 1 indicates a perfect model. The parameters of each method are selected by simulated annealing (SA) that uses the average MaxSub score of training set as the objective function.
Results
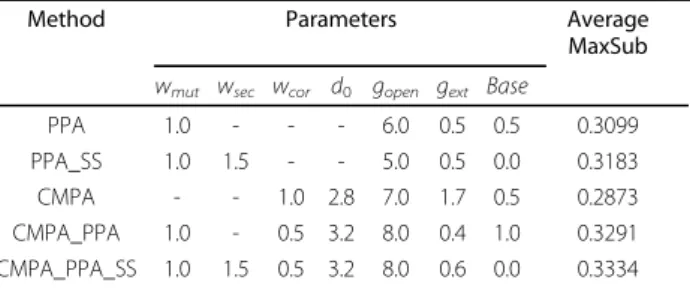
The selected parameters by simulated annealing are listed in Table 1. For p and L in LPC analysis, 6 and 9 are used, respectively. Fora in CM profile score calcula-tion, 0.025 is used. Combining CM profile, sequence profile, and secondary structure prediction (CMPA_P-PA_SS) improves the conventional methods, the profile-profile alignment without and with secondary structure prediction (PPA and PPA_SS), by 7.6% and 4.7%, respec-tively. In addition, combining CM profile only with pro-file-profile alignment (CMPA_PPA) improves the PPA by 6.2%, which is 2.3 times more increase than PPA_SS which improves PPA by 2.7%. However, using CM pro-file solely performs poorly; therefore we will exclude it in the following test.
As shown in Table 2, overall, CMPA_PPA_SS and CMPA_PPA significantly outperform the original meth-ods, PPA_SS and PPA that do not use correlated muta-tion informamuta-tion by 4.1% (p-value 2.1e-252) and 5.0% (p-value 8.2e-232), respectively. The p-values are calcu-lated by Wilcoxon signed rank test. At family level, using CM profile shows almost the same improvement that can be achieved by using secondary structure pre-diction. However, it is seen that CMPA_PPA_SS shows 2.2 times more improvement than PPA_SS and CMPA_PPA. A dramatic result can be seen at superfam-ily level where the average sequence identity is 11.5%, less than 17.4% at family level, and 96% of the protein pairs have sequence identity less than 20%. CMPA_P-PA_SS and CMPA_PPA improve PPA by 13.9% and 9.5%, respectively, while PPA_SS does by 6.0%. This indicates that the use of correlated mutation is much more effective for difficult cases, where the sequence identity is very low, and the following analysis also con-sistently shows more effective improvements below 20% sequence identity. Moreover, it also implies that both the information can be used complementarily and many of the current alignment methods using secondary structure prediction can be improved by incorporating correlated mutation information. According to a pre-vious study using data set derived from SCOP with <75% sequence identity, the sophisticated methods including the structural state assignment based on self-organizing map and the scoring function based on artifi-cial neural network, have performed best and shown the average MaxSub score 0.22 at superfamily level [21]. In their work, the other methods have shown the average MaxSub scores of 0.20-0.22. The MaxSub scores of PPA and PPA_SS of this work are also in that range. Although the results cannot be directly compared, it is reasonable to expect that CMPA_PPA_SS should out-perform the previous method on their test set as well.
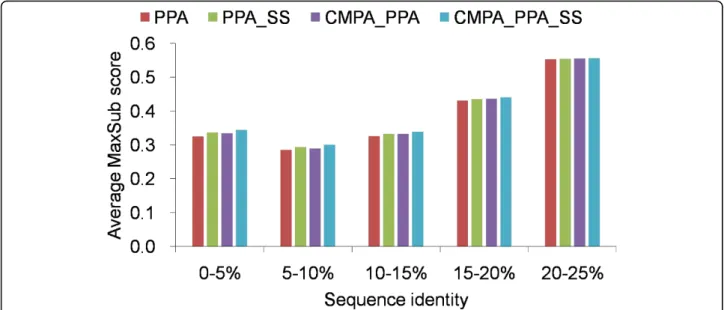
Figure 1 shows the average MaxSub scores of various methods at family level as a function of sequence iden-tity. Below 20% sequence identity, CMPA_PPA_SS
Table 1 Selected parameters for the different combination of scoring terms.
Method Parameters Average
MaxSub wmut wsec wcor d0 gopen gext Base
PPA 1.0 - - - 6.0 0.5 0.5 0.3099 PPA_SS 1.0 1.5 - - 5.0 0.5 0.0 0.3183 CMPA - - 1.0 2.8 7.0 1.7 0.5 0.2873 CMPA_PPA 1.0 - 0.5 3.2 8.0 0.4 1.0 0.3291 CMPA_PPA_SS 1.0 1.5 0.5 3.2 8.0 0.6 0.0 0.3334
wmut, wsec, wcor, and d0denote the corresponding notations in alignment
score function, and gopen, gext, and base denote gap-open cost, gap-extension
cost, and baseline parameter used for dynamic programming procedure. PPA and PPA_SS denote profile-profile alignment without and with secondary structure prediction, respectively, CMPA denote alignment solely using CM profile, and CMPA_PPA and CMPA_PPA_SS denote alignment combining CM profile with PPA and PPA_SS, respectively.
Table 2 Average MaxSub scores of test set by different methods
Method Average MaxSub
Family Superfamily All
PPA 0.4485 0.2053 0.2851
PPA_SS 0.4524 0.2177 0.2947 CMPA_PPA 0.4524 0.2248 0.2994 CMPA_PPA_SS 0.4572 0.2338 0.3070
Family and Superfamily denote the average MaxSub score at SCOP family and superfamily level, and All denotes the average MaxSub score of all samples. PPA and PPA_SS denote profile-profile alignment without and with secondary structure prediction, respectively, and CMPA_PPA and CMPA_PPA_SS denote alignment combining CM profile with PPA and PPA_SS, respectively.
consistently outperforms the others and improves PPA by 3.2%. However, all the methods perform almost iden-tically above 20% sequence identity. A reason for this result is that closely related proteins possibly share more common or similar sequences in their MSAs and yield similar sequence profiles. Particularly, the key resi-dues strongly conserved are easily aligned and guide the global alignment optimally. According to a previous study [22], it has been demonstrated that the model quality generated by comparative modeling is related with the distribution of the sequence identity between the sequences comprised in the MSAs. Moreover, it is more probable that MSAs share more common or simi-lar sequences, here, at family level where evolutionary distance is much closer than at superfamily level. Thus, in case where there is close evolutionary relationship and high sequence identity, sequence profiles seem to be sufficiently informative and combining correlated mutation or secondary structure prediction does not improve alignment quality.
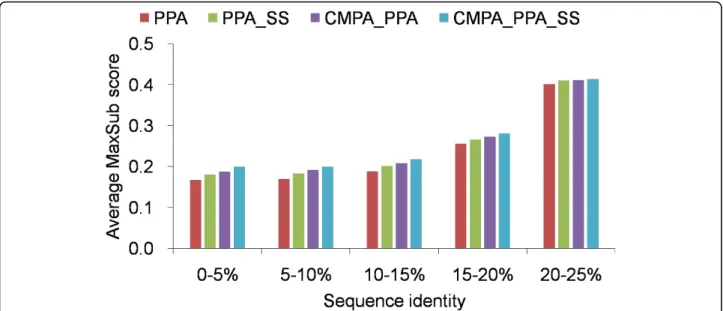
As shown in Figure 2, CMPA_PPA_SS and CMPA_PPA outperform the conventional methods, PPA and PPA_SS, consistently, regardless of sequence iden-tity at superfamily level. Similarly at family level, align-ment quality deteriorates below 20% sequence identity, and the average MaxSub score of PPA does not exceed 0.19 below 15% sequence identity. Although CMPA_P-PA_SS also shows a decline below 20% sequence iden-tity, it significantly improves PPA and PPA_SS by 18.4% and 12.5%, respectively, in the range of 0-10% sequence identity, and by 13.0% and 8.9%, respectively, in the range of 10-20% sequence identity.
This result has important implications in several aspects. It is well known that profile-profile alignment is improved most by using secondary structure prediction [1,23] and numerous state-of-the-art methods hence incorporate secondary structure prediction in their alignment scheme [21,24-26]. Also in our results, pro-file-profile alignment is consistently outperformed by combining secondary structure prediction. However, it is more significantly improved by combining correlated mutation (CMPA_PPA), and the best performance is achieved by combining correlated mutation and second-ary structure prediction together (CMPA_PPA_SS). Tak-ing this into account, the state-of-the-art methods can be improved significantly by incorporating correlated mutation information.
Another aspect is related with the reliability of align-ment in the midnight zone. An alignalign-ment becomes less reliable when the sequence identity lies in the midnight zone [1]. Since using correlated mutation is more advan-tageous for the proteins pairs with low sequence identity and CM profile is easily combined with conventional methods, the coverage of current alignment methods in the midnight zone can be increased by using CM pro-file. The most important implication is related with the template-based protein structure prediction. From two other aspects described above, it is obvious that using correlated mutation remarkably improves current align-ment methods for the sequences with less than 20% sequence identity. This is beneficial to target-template alignment because most of promising templates sharing the same structure have relatively low sequence identity [2]. Practically, according to the recent analysis for the
Figure 1 Average MaxSub scores of various methods, measured by different sequence identities at family level Average MaxSub scores above 25% sequence idenitty are not shown.
template-based modeling targets of CASP7 [3], almost half of the targets, specifically 50 among 108 targets, have the best templates with similar structure but low sequence identity less than 20%, and a virtual predictor based on the best templates overall outperforms all other groups by far. The effectiveness of CM profile will carry out more reliable target-template alignments and subsequently provide better models for difficult target-template pairs, thereby increasing the confidence for template-based structure prediction.
To assess the performance of CM profile for domains which have less MSA sequences than 100, we build two additional test sets from the omitted domains. The first test set is built from the domains with 50-99 MSA sequences, and consists of 527 domains of 30 folds, 31 superfamilies, and 142 families, deriving 5586 pairs. The second test set is built from the domains with 1-49 MSA sequences, and consists of 752 domains of 31 folds, 37 superfamilies, and 225 families, deriving 9676 pairs.
When testing with the domains whose MSA is com-posed of 50-99 sequences, using CM profile improves PPA and PPA_SS by 4.3% and 3.8%, respectively, as shown in Table 3. Also, when testing with the domains whose MSA is composed of 1-49 sequences, using CM profile improves PPA and PPA_SS by 2.4% and 3.5%, respectively, as shown in Table 4. Although the improvement rate becomes small for the domains with less MSA sequences, correlated mutation is still valuable as additional information for sequence alignment. More-over, combining profile-profile alignment with both cor-related mutation and secondary structure prediction outperforms the others significantly, convincing that
both the information can complement each other. How-ever, just as the quality of profile-profile alignment decrease when the amount of sequences in MSA is not sufficient, the performance of CM profile seems to decrease likewise.
Figure 2 Average MaxSub scores of various methods, measured by different sequence identities at superfamily level Average MaxSub scores above 25% sequence idenitty are not shown.
Table 3 Average MaxSub scores of test set with 50-99 MSA sequences by different methods
Method Average MaxSub
Family Superfamily All
PPA 0.4708 0.1714 0.2631
PPA_SS 0.4762 0.1839 0.2734 CMPA_PPA 0.4811 0.1832 0.2744 CMPA_PPA_SS 0.4852 0.1949 0.2838
Family and Superfamily denote the average MaxSub score at SCOP family and superfamily level, and All denotes the average MaxSub score of all samples. PPA and PPA_SS denote profile-profile alignment without and with secondary structure prediction, respectively, and CMPA_PPA and CMPA_PPA_SS denote alignment combining CM profile with PPA and PPA_SS, respectively.
Table 4 Average MaxSub scores of test set with 1-49 MSA sequences by different methods
Method Average MaxSub
Family Superfamily All
PPA 0.4209 0.1816 0.2499
PPA_SS 0.4239 0.1925 0.2586 CMPA_PPA 0.4222 0.1896 0.2560 CMPA_PPA_SS 0.4305 0.2024 0.2676
Family and Superfamily denote the average MaxSub score at SCOP family and superfamily level, and All denotes the average MaxSub score of all samples. PPA and PPA_SS denote profile-profile alignment without and with secondary structure prediction, respectively, and CMPA_PPA and CMPA_PPA_SS denote alignment combining CM profile with PPA and PPA_SS, respectively.
Discussion
The reason for the effectiveness of CM profile is related with the correlation between coevolution and contact. It has been shown that the residues important for protein function are not only conserved but also coevolved with other inter-related residues [12,27]. This fact has been exploited to infer the structural factor such as inter-residue
contacts [13] and to evaluate the correctness of de novo model [28]. Recently, it has been also shown that key residues can be identified by analyzing residue-residue coe-volution network [29]. In the aspect of alignment, contact-mutation matrices derived from structural information have been used for improving alignment quality [30]. CM profile utilizes correlated mutation information much more globally and progressively, implying all the correlated
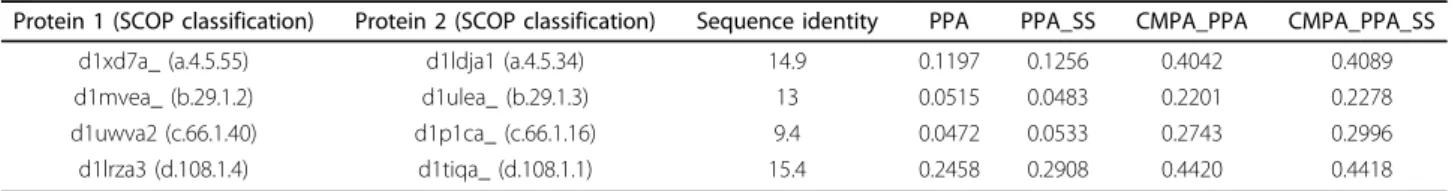
Table 5 Protein pairs with the MaxSub scores of various methods
Protein 1 (SCOP classification) Protein 2 (SCOP classification) Sequence identity PPA PPA_SS CMPA_PPA CMPA_PPA_SS d1xd7a_ (a.4.5.55) d1ldja1 (a.4.5.34) 14.9 0.1197 0.1256 0.4042 0.4089 d1mvea_ (b.29.1.2) d1ulea_ (b.29.1.3) 13 0.0515 0.0483 0.2201 0.2278 d1uwva2 (c.66.1.40) d1p1ca_ (c.66.1.16) 9.4 0.0472 0.0533 0.2743 0.2996 d1lrza3 (d.108.1.4) d1tiqa_ (d.108.1.1) 15.4 0.2458 0.2908 0.4420 0.4418
PPA and PPA_SS denote profile-profile alignment without and with secondary structure prediction, respectively, and CMPA_PPA and CMPA_PPA_SS denote alignment combining CM profile with PPA and PPA_SS, respectively.
Figure 3 Correlated mutation matrices of the proteins listed in Table 5 The upper-lower triangular matrix represents mutual information between the residues of the respective protein, (a) d1xd7a_-d1ldja1, (b) d1mvea_-d1u1ea_, (c) d1uwva2-d1p1ca_, and (d) d1lrza3-d1tiqa_, respectively. Note that the intensity and the size of image are scaled differently, regarding to the distribution of mutual information and the alignment length.
mutation of possible residue pairs. This optimizes align-ment to match multiple contacting residue pairs, while the previous studies only consider at most two residue pairs, thereby improving alignment quality noticeably.
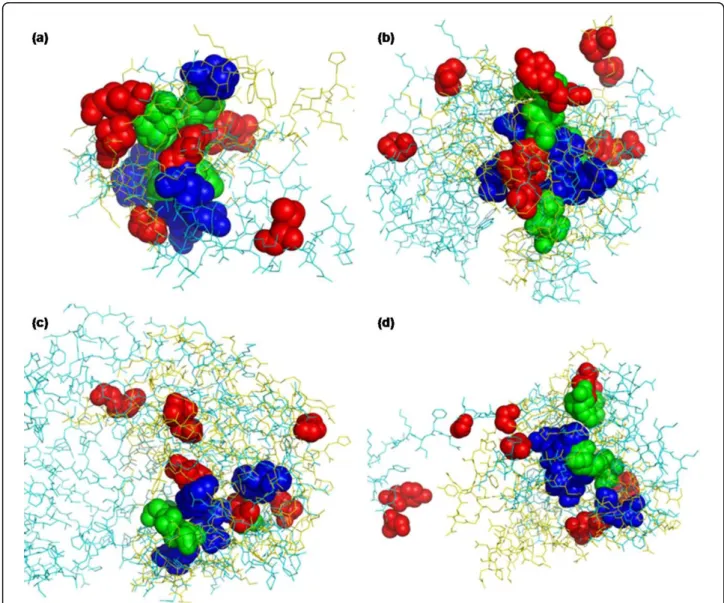
In the following, we exemplify that combining CM pro-file generates the alignment reflecting correlation muta-tion, and the aligned residues with high CM profile score are related with common contacts. As listed in Table 5, the proteins pairs are chosen from SCOP class a, b, c, and d, and share the same superfamily but different family.
If the inter-related residues of a protein are aligned with the comparable residues of other protein, the corre-lated mutation information should be kept mutually in the resulted alignment. To demonstrate this, we
investigate the correlation coefficient between correlated mutations of proteins. As correlated mutation measure, we calculate mutual information with low number cor-rection [10], and the residues not aligned are excluded. The resulting correlated mutation scores for aligned resi-dues are shown as matrix form in Figure 3. Although the matrices do not look completely symmetric, they have positive correlation coefficients, (a) 0.1208, (b) 0.1952, (c) 0.1131, and (d) 0.2118, respectively. These values are small, but all the correlations are statistically significant (p-value < 2.2e-308). In other words, the present method constructs an alignment that preserves coevolution.
As shown in Figure 4, the residues with high CM pro-file scores are located spatially close with each other
Figure 4 High scoring residue pairs of the examples listed in Table 5 Each pair of proteins, (a) d1xd7a_-d1ldja1, (b) d1mvea_-d1u1ea_, (c) d1uwva2-d1p1ca_, and (d) d1lrza3-d1tiqa_ is superimposed based on the CMPA_PPA alignment, and coded as cyan-yellow, respectively. Top-10 residue pairs ranked by sequence profile score and CM profile score are shown as spheres coded as red and blue, respectively, but the residue pairs ranked by both are coded as green.
even though they are distant on sequence. On the other hand, the residues with high sequence profile scores are dispersed or not superimposed. This shows that CM profile reflects the structural aspect with regard to resi-due-residue contact in alignment and the common con-tacts of aligned proteins are ranked highly by CM profile score. This will be very useful in template-based protein structure prediction.
Due to the generality of CM profile, it can be success-fully exploited for various bioinformatics applications, particularly with machine learning approaches. Our approach is position-specific and consists of a fixed number of values, which allows CM profile to be manipulated in the same way that we use sequence pro-file. Thus, CM profile can be easily adopted into the current methodology without serious modification to complement them. Moreover, it should be noted that our CM profile is not optimally generated because sequence profiles are automatically generated by PSI-BLAST [17]. The present method can be improved sig-nificantly, as the accuracy of correlated mutation is increased through various corrections and noise reduc-tions [10,11].
Conclusions
We develop a novel method to represent correlated mutation as the spectral features derived from LPC ana-lysis, and we also apply it to sequence alignment of distantly related proteins. When combined with conven-tional sequence profile, CM profile improves alignment quality significantly better than predicted secondary structure information. Especially, the dramatic improve-ment in the midnight zone is observed, which should be beneficial for target-template alignment in protein struc-ture prediction. Finally, because the methodology that we have developed in this work can be generalized to many interesting areas of bioinformatics, we expect that CM profile can be applicable to other bioinformatics applications equally well.
Acknowledgements
This work was supported by the Korea Institute of Science and Technology Information Supercomputing Center.
This article has been published as part of BMC Bioinformatics Volume 11 Supplement 2, 2010: Third International Workshop on Data and Text Mining in Bioinformatics (DTMBio) 2009. The full contents of the supplement are available online at http://www.biomedcentral.com/1471-2105/11?issue=S2.
Authors’ contributions
CSJ designed the study, implemented the methods, performed the experiments and the result analysis, and drafted the manuscript. DK conceived of the study, participated in its design and coordination, and helped to draft the manuscript. All authors read and approved the final manuscript.
Competing interests
The authors declare that they have no competing interests.
Published: 16 April 2010
References
1. Elofsson A: A study on protein sequence alignment quality. Proteins 2002, 46(3):330-339.
2. Yang AS, Honig B: An integrated approach to the analysis and modeling of protein sequences and structures. II. On the relationship between sequence and structural similarity for proteins that are not obviously related in sequence. J Mol Biol 2000, 301(3):679-689.
3. Kopp J, Bordoli L, Battey JN, Kiefer F, Schwede T: Assessment of CASP7 predictions for template-based modeling targets. Proteins 2007, 69(Suppl 8):38-56.
4. Olmea O, Rost B, Valencia A: Effective use of sequence correlation and conservation in fold recognition. J Mol Biol 1999, 293(5):1221-1239. 5. Lockless SW, Ranganathan R: Evolutionarily conserved pathways of
energetic connectivity in protein families. Science 1999, 286(5438):295-299.
6. Süel GM, Lockless SW, Wall MA, Ranganathan R: Evolutionarily conserved networks of residues mediate allosteric communication in proteins. Nat Struct Biol 2003, 10(1):59-69.
7. Dekker JP, Fodor A, Aldrich RW, Yellen G: A perturbation-based method for calculating explicit likelihood of evolutionary co-variance in multiple sequence alignments. Bioinformatics 2004, 20(10):1565-1572.
8. Atchley WR, Wollenberg KR, Fitch WM, Terhalle W, Dress AW: Correlations among amino acid sites in bHLH protein domains: an information theoretic analysis. Mol Biol Evol 2000, 17(1):164-178.
9. Tillier ER, Lui TW: Using multiple interdependency to separate functional from phylogenetic correlations in protein alignments. Bioinformatics 2003, 19(6):750-755.
10. Buslje CM, Santos J, Delfino JM, Nielsen M: Correction for phylogeny, small number of observations and data redundancy improves the
identification of coevolving amino acid pairs using mutual information. Bioinformatics 2009, 25(9):1125-1131.
11. Dunn SD, Wahl LM, Gloor GB: Mutual information without the influence of phylogeny or entropy dramatically improves residue contact prediction. Bioinformatics 2008, 24(3):333-340.
12. Göbel U, Sander C, Schneider R, Valencia A: Correlated mutations and residue contacts in proteins. Proteins 1994, 18(4):309-317.
13. Shackelford G, Karplus K: Contact prediction using mutual information and neural nets. Proteins 2007, 69(Suppl 8):159-164.
14. Rabiner LR, Juang BH: Fundamentals of speech recognition. Englewood Cliffs, N.J.: PTR Prentice Hall 1993.
15. Murzin AG, Brenner SE, Hubbard T, Chothia C: SCOP: a structural classification of proteins database for the investigation of sequences and structures. J Mol Biol 1995, 247(4):536-540.
16. Chandonia JM, Hon G, Walker NS, Lo Conte L, Koehl P, Levitt M, Brenner SE: The ASTRAL Compendium in 2004. Nucleic Acids Res 2004, 32(Database issue):D189-192.
17. Altschul SF, Madden TL, Schäffer AA, Zhang J, Zhang Z, Miller W, Lipman DJ: Gapped BLAST and PSI-BLAST: a new generation of protein database search programs. Nucleic Acids Res 1997, 25(17):3389-3402. 18. Pham T: Spectral distortion measures for biological sequence
comparisons and database searching. Pattern Recognition 2007, 40(2):516-529.
19. Jones DT: Protein secondary structure prediction based on position-specific scoring matrices. J Mol Biol 1999, 292(2):195-202.
20. Siew N, Elofsson A, Rychlewski L, Fischer D: MaxSub: an automated measure for the assessment of protein structure prediction quality. Bioinformatics 2000, 16(9):776-785.
21. Ohlson T, Aggarwal V, Elofsson A, MacCallum RM: Improved alignment quality by combining evolutionary information, predicted secondary structure and self-organizing maps. BMC bioinformatics 2006, 7:357. 22. Cozzetto D, Tramontano A: Relationship between multiple sequence
alignments and quality of protein comparative models. Proteins 2005, 58(1):151-157.
23. Qi Y, Sadreyev RI, Wang Y, Kim BH, Grishin NV: A comprehensive system for evaluation of remote sequence similarity detection. BMC bioinformatics 2007, 8:314.
24. Söding J: Protein homology detection by HMM-HMM comparison. Bioinformatics 2005, 21(7):951-960.
25. Lee M, Jeong C, Kim D: Predicting and improving the protein sequence alignment quality by support vector regression. BMC bioinformatics 2007, 8:471.
26. Wu S, Zhang Y: MUSTER: Improving protein sequence profile-profile alignments by using multiple sources of structure information. Proteins 2008, 72(2):547-556.
27. Neher E: How frequent are correlated changes in families of protein sequences? Proc Natl Acad Sci USA 1994, 91(1):98-102.
28. Bartlett GJ, Taylor WR: Using scores derived from statistical coupling analysis to distinguish correct and incorrect folds in de-novo protein structure prediction. Proteins 2008, 71(2):950-959.
29. Lee BC, Park K, Kim D: Analysis of the residue-residue coevolution network and the functionally important residues in proteins. Proteins 2008, 72(3):863-872.
30. Kleinjung J, Romein J, Lin K, Heringa J: Contact-based sequence alignment. Nucleic Acids Res 2004, 32(8):2464-2473.
doi:10.1186/1471-2105-11-S2-S2
Cite this article as: Jeong and Kim: Linear predictive coding
representation of correlated mutation for protein sequence alignment. BMC Bioinformatics 2010 11(Suppl 2):S2.
Submit your next manuscript to BioMed Central and take full advantage of:
• Convenient online submission
• Thorough peer review
• No space constraints or color figure charges
• Immediate publication on acceptance
• Inclusion in PubMed, CAS, Scopus and Google Scholar
• Research which is freely available for redistribution
Submit your manuscript at www.biomedcentral.com/submit