저작자표시-비영리-변경금지 2.0 대한민국 이용자는 아래의 조건을 따르는 경우에 한하여 자유롭게 l 이 저작물을 복제, 배포, 전송, 전시, 공연 및 방송할 수 있습니다. 다음과 같은 조건을 따라야 합니다: l 귀하는, 이 저작물의 재이용이나 배포의 경우, 이 저작물에 적용된 이용허락조건 을 명확하게 나타내어야 합니다. l 저작권자로부터 별도의 허가를 받으면 이러한 조건들은 적용되지 않습니다. 저작권법에 따른 이용자의 권리는 위의 내용에 의하여 영향을 받지 않습니다. 이것은 이용허락규약(Legal Code)을 이해하기 쉽게 요약한 것입니다. Disclaimer 저작자표시. 귀하는 원저작자를 표시하여야 합니다. 비영리. 귀하는 이 저작물을 영리 목적으로 이용할 수 없습니다. 변경금지. 귀하는 이 저작물을 개작, 변형 또는 가공할 수 없습니다.
MASTER THESIS
A STUDY ON THE POLICY DIRECTION OF
COFFEE PRODUCTION IN VIETNAM
GRADUATE SCHOOL
JEJU NATIONAL UNIVERSITY
Department of Agriculture Economics
NGUYEN THI BICH NGOC
A STUDY ON THE POLICY DIRECTION OF
COFFEE PRODUCTION IN VIETNAM
NGUYEN THI BICH NGOC
(Supervised by Professor Bae-Sung Kim)
A thesis submitted in partial fulfillment of the requirement for the degree of Master of Agriculture Economics
This thesis has been examined and approved by KANG DONG IL
Thesis director, Dong-Il Kang, Professor of Agriculture Economics KO SEONG BO
Seong-Bo Ko, Professor of Agriculture Economics KIM BAE SUNG
Bae-Sung Kim, Professor of Agriculture Economics
2018.08
Department of Agriculture Economics
GRADUATE SCHOOL
JEJU NATIONAL UNIVERSITY
i
TABLE OF CONTENTS
CHAPTER 1
INTRODUCTION ... 1
1.1 Research Background ... 1 1.2 Problem Discussion ... 2 1.3 Research Objective ... 3 1.4 Delimitation ... 4 1.5 Research Organization ... 4CHAPTER 2
CURRENT STATUS OF COFFEE INDUSTRY IN VIETNAM ... 6
2.1 Brief Introduction about Coffee ... 6
2.2 Current Status of World Coffee ... 7
2.2.1 Production and Price ... 7
2.2.2 Export and Import... 14
2.2.3 Consumption... 17
2.3 Current Status of Vietnamese Coffee ... 19
2.3.1 Production and Price ... 19
2.3.2 Export and Import... 25
2.3.3 Consumption ... 29
CHAPTER 3
ANALYTIC METHODOLOGY ... 39
ii
3.1.1 Definition ... 39
3.1.2 Relevant Theory of This Study ... 40
3.2 Analysis Procedure ... 53
3.2.1 Research Process ... 53
3.2.2 Method of Collecting Data ... 54
CHAPTER 4
CONSUMER PREFERENCE OF VIETNAMESE COFFEE IN SOUTH
KOREA ... 57
4.1 Questionnaire Design... 57
4.2 Independent and Dependent Variables ... 57
4.3 Analysis Results ... 58
CHAPTER 5
DEVELOPMENT
STRATEGY
FOR
VIETNAMESE
COFFEE
INDUSTRY ... 66
5.1 AHP Model Contents ... 66
5.2 AHP Model Results and Analysis ... 69
5.3 Conclusion ... 73
CHAPTER 6
SUMMARY AND POLICY IMPLICATION ... 75
iii
List of Figure
Figure 1: World’s Largest Coffee Producing Countries in 2017 Figure 2: World Coffee Production
Figure 3: Arabica and Robusta Production in Percentage
Figure 4: Monthly Coffee Price from March 2007 to March 2017 Figure 5: Price Fluctuation of Arabica and Robusta in the World
Figure 6: Price Fluctuation of Arabica and Robusta in the World in 2017 Figure 7: World Coffee Import and Export
Figure 8: Consumption in Importing Countries and Exporting Countries Figure 9: Top 10 Coffee Consuming Countries in 2016/2017
Figure 10: Arabica and Robusta Production in Vietnam’s Coffee Industry Figure 11: Average Export Price for Green Coffee of Vietnam
Figure 12: Generic Hierarchic Structure Figure 13: Coffee Processing Steps
iv
List of Tables
Table 1: Top 10 Coffee Exporting Countries Table 2: Top 10 Coffee Importing Countries
Table 3: Estimate of Vietnam’s Coffee Areas by Province Table 4: Vietnam’s Coffee Import Quantity and its Percentage Table 5: 10 Main Countries Vietnam Exports Coffee to
Table 6: Quantity of Vietnam’s Coffee Imports during 2008 - 2018 Table 7: Vietnamese Domestic Consumption by Specific Type
Table 8: Saaty’s Ratio Scale for Pair-wise Comparison of Importance of Weights of Criteria/ Alternatives
Table 9: Average random index (RI) Based on the Matrix Size (Adapted from Saaty, 2000) Table 10 The Main Contents and Evaluation Items of Criterion for the Development of the Vietnamese Coffee Industry
Table 11: Result of Experts’ Survey
Table 12: Evaluation Result of Replanting Program
Table 13: Evaluation Result of Farmers’ Knowledge Improvement
Table 14: Evaluation Result of Government Support & Institutionalization Table 15: Evaluation Result of Business Efficiency
v
ABSTRACT
Vietnam is the second largest coffee producing and exporting country in the world, only after Brazil. Brazil is famous for producing Arabica coffee whereas Vietnam is famous for producing Robusta coffee. Currently, Vietnam mainly produces and exports green coffees which account at 90% of total coffee production and the remaining 10% is processed coffee. This is a big problem of the Vietnam’s coffee industry since the value of one unit of processed coffee is threefold higher than one unit of green coffee. The main purpose of this research is to clarify current status of the Vietnamese coffee industry; what problems are existing; from that find out the way to improve the Vietnam’s coffee industry. In addition, this research aims to clarify Korean behavior about Vietnamese coffee, understand their tastes and thoughts; and the tendency to consume Vietnamese coffee. There are two main models are applied in this study in order to clarify the two mentioned purpose above. One is AHP model and another one is Logit model. AHP model is used in the decision making of which are the best methods to solve the current problems as well as improve the Vietnamese coffee industry. By contrast, Logit model is used to clarify which factors effect on consumer’s decision making when they purchase Vietnamese coffee.
1
CHAPTER 1
INTRODUCTION
1.1 Research Background
In Vietnamese agriculture, coffee and rice are the two main exported products which contribute significantly to the GDP; rice holds the first position and the second position is coffee. In the world, Vietnam is the second biggest coffee exporter, only after Brazil. Coffee plays an important role for the country’s economy. In the crop year 2016/2017, Vietnam exported 1.79 million tons of coffee with a turnover of 3.36 billion USD which accounted for 3% of the total national GDP. In the next period, 2017/2018, the coffee export amount is projected to decrease to 1.4 million tons, which would bring 3.2 billion USD in turnover; a decrease of 19% in total amount of export and 2.7% in turnover when compared with the previous year. In the crop period of 2017/2018, the average export price was about 2,249 USD/ ton, an increase of 20.1% compared to 2016.
Vietnam mainly exports green coffee, where the proportion of green to processed coffee is 9 to 1. And, the price of green coffee is flexible (it changes each hour) and depends on many factors; such weather conditions, fertilizer price and so on, whereas the price of processed coffee is quite stable in the market. Moreover, the value of one unit of processed coffee is threefold higher than the value of 1 unit of green coffee.
According to International Coffee Organization (ICO), the consumption of coffee has increased continuously during the last 40 years with the average increase rate of 1.6% per year and is expected to quickly increase in the future. This is a good opportunity for Vietnam’s coffee industry; to have a new production direction when changing from focusing on producing and exporting green coffee to focusing on producing and exporting processed coffee which brings higher return than green coffee. There is one conflict that exists currently; Vietnam is the biggest coffee exporter in the world, but mainly exports green coffee at a low price and then Vietnam imports processed coffee back from other foreign countries but at a higher price. However, with an advantage in cheap, fresh and abundant raw
2
material inputs – green coffee, Vietnam has a good opportunity to develop its coffee industry in a new production direction – processed coffee
In Vietnam’s domestic market, the culture of drinking coffee has increased in recent years and people tend to drink more qualitative coffee and require more from its flavor. Although Vietnam is the second biggest coffee exporting country, the Vietnamese people are still drinking either low quality or expensive, high quality coffee which is imported from some other foreign country. Moreover, Vietnam’s domestic brand has not succeeded in building brand loyalty and brand awareness for their customers since many customers believe and trust in foreign brands such as Nescafe rather than
domestic brands In the whole country, there are 97 companies that are processing green coffee but only 10% of it
has the TCVN 4193:2005 standard (TCVN standard is a standard use to measure the quality of green coffee export); 160 companies for ground coffee and only 6 companies for processing instant coffee. Besides that, most of the companies are small-scale and have poor techniques in producing and processing coffee products. Until now, there have been a modest number of domestic famous brand such as Trung Nguyen Coffee and Buon Me Thuat Coffee. Trung Nguyen is the biggest brand name in Vietnam’s coffee industry – the first time it appeared on the market was in 1999, producing high quality coffee and was well-known in the international market. However, with only Trung Nguyen, Vietnam can only provide for the world market with very tiny amount of coffee products
1.2 Problem Discussion
As mentioned above, Vietnam is the second biggest coffee exporter in the world and in the case of Robusta coffee, Vietnam holds the 1st position. Currently, Vietnam only focuses on export green
coffee, where 90% of total harvested coffee is exported and only 10% of harvested coffee is used to produce coffee products for the local market. However, the amount of coffee exported is huge and increases year by year, but the turnover is not high. In some years, although the amount of coffee exported is high, the turnover is lower than the previous year because the turnover depends on the price of coffee as determined by the world coffee market, and that price is always flexible depending
3
on many factors such as weather conditions. On the other hand, processed coffee brings higher and more stable revenue for Vietnam’s coffee industry but is not matter of concern. Focusing on producing processed coffee could contribute more for Vietnam’s national GDP (until now, the total revenue of the coffee industry contributes to 3% of the total national GDP).
This is not a good strategy when Vietnam exports green coffee at a lower price and imports processed coffee from other countries at a higher price. Until now, Vietnam does not invest much in its coffee industry, especially in techniques for producing coffee products. Vietnam has a big advantage in fresh raw materials, producing coffee products within the country would help to reduce lots of costs; such as tariffs when exporting green coffee, inventory costs, and transportation costs and so on. However, in the current situation, besides a high-quality product, it still exists a huge amount of low-quality products or even fake coffee. Many companies are using manual methods in producing coffee that lead to low-quality products rather than using technical methods. By the way, setting up high-tech facilities in producing coffee requires a great deal of money which small-scale companies could not apply without government support. Additionally, the reason for producing low-quality coffee also comes from the lack of knowledge of farmers when growing, harvesting and preserving green coffee beans.
The domestic coffee market is expanding day by day since the culture of drinking coffee has increased in recent years. This is a good opportunity to produce and consume coffee in the domestic market. Nowadays, consumers require more and more in the quality of their coffee as well as coffee products; hence producing high-quality coffee is the first priority. Moreover, other industries such as the confectionary industry and milk industry also use coffee in their ingredients.
1.3 Research Objective
This research study aims to clarify the current status of the production in the Vietnamese coffee industry; what problems exist; and ideas for applying new directions in processing coffee in order to increase the turnover for Vietnam’s coffee industry
4
1.4 Delimitation
This research study is limited to the Vietnamese coffee industry, because it is really interesting since people more and more like drinking coffee beverages. My study mainly focuses on coffee production, which is an important step in making a good tasting cup of coffee for drinkers as well as increasing the value of coffee not only in Vietnam’s market but also in the international market. More specially, production direction and processed coffee are the main keywords of this study.
1.5 Research Organization
Chapter 1: Introduction
Chapter 1 provides a general view of the research and the reason to conduct the study. This chapter includes research background, problem discussion, research objective and delimitation
Chapter 2: Current Status of Vietna’s Coffee Industry
This chapter provides a general view of the status of the international coffee industry and Vietnam’s coffee industry in particular. The main purpose of this chapter is to clarify the great achievements as well as the existing problems in Vietnam’s coffee industry. This chapter includes two main parts, one is on the international coffee market and the other is on Vietnamese coffee market.
Chapter 3: Literature Review and Methodology
Chapter 3 presents an applied theory relating to the research topic and provides a general look about concepts which are related to coffee production and a new direction for it. This chapter also describes research methodology which is used for this study in order to clarify the hypothesis. In particular, this chapter consists of research methods and methods of data collection, and describes how and where data is collected.
Chapter 4: Data Collection and Analysis
5
collected in relation to a relevant theory in order to clarify the research topic. This is the most important part in this research.
Chapter 5: Conclusion and Recommendation
The final chapter includes the conclusion which has emerged during this thesis and a recommendation which clarifies the limitation of the research as well as propositions on future research.
6
CHAPTER 2
CURRENT STATUS OF COFFEE INDUSTRY IN VIETNAM
2.1 Brief Introduction about Coffee
History of Coffee
According to a popular legend, the origin of coffee can be traced to the day, maybe a thousand years ago, when an Abyssinian (Ethiopian) goatherd named Kaldi observed his goats prancing and frolicking about. Kaldi had previously found the behavior of his goats to be “irreproachable,” so he knew that something unusual was going on. When Kaldi investigated, he saw that the goats were merrily eating the red berries and shiny leaves of an unfamiliar tree. Kaldi decided to try some, and when he did he joined the dancing goats and became “the happiest herder in happy Arabia.” From then on, those red berries have become a kind of beverage for humans.
From the 6th century, coffee was not only used by Ethiopians because of its stimulant effects, but
also spread outside Ethiopia to different countries like Yemen, some countries in the Middle-Near East and Saudi Arabia
In the 16th century, Venetian merchants imported coffee into Europe. Coffee was introduced into Italy first. Coffee really became popular in Europe in the 17th century and then spread into Asia and Australia
In the early 18th century, the Dutch began growing coffee in Indonesia. Also in the 18th century, people began growing coffee in Brazil. By the early 19th century coffee plantations in Brazil were booming. In the 20th century a vast amount of coffee was grown in Uganda.
Types of Coffee
Arabica and Robusta are the two most common types of coffee beans which we use in making coffee every day. These two beans are used more than any other kind of coffee beans. A third type of
7
coffee, Liberica coffee, found its place in the localized Liberian coffee, but it generates only a small amount of sales in the global stock market.
- Arabica coffee: it accounts for 60% of the world’s coffee production. Its shape is oval and contains less caffeine than Robusta coffee only 1.5%. The ideal altitude to grow Arabica is 1,000 to 1,900 meters above sea level
- Robusta coffee: it accounted for only 40% of the world’s coffee production. Its shape is much more circular, the taste is described as burnt tires, or rubbery and contains 2.7% caffeine, nearly double compared with Arabica coffee. The ideal altitude to grow Arabica is 500 to 1,000 meters above sea level
- Liberica coffee was first discovered in 1902 in Ubangui Chari. Because its taste is very strong, Liberica coffee is usually mixed with Arabica coffee in order to create a better smelling coffee.
2.2 Current Status of World Coffee
2.2.1 Production and Price
According to data from the International Coffee Organization (ICO), until now, there have been 50 coffee producing countries around the world, focusing mainly on the areas of North, Central and South America, Africa and the Asia Pacific region.
In the coffee producing of year 2016/2017, the world’s coffee production was estimated at 157.44 million bags (60 kilograms per bag) and is forecast to increase up to 158.78 million bags in the production year of 2017/2018, an increase of around 0.7% compared to the previous year. Brazil, Vietnam, Colombia and Indonesia are the four major producers in the coffee market.
8
Figure 1: World’s Largest Coffee Producing Countries in 2017
Source: U.S Department of Agriculture (USDA), 2017
Brazil has been the highest global producer of coffee beans for over 150 years with 27,000 square kilometers growing coffee in the whole country. Its coffee production accounts for 40% of the world’s coffee production, mainly producing on Arabica coffee. The majority of coffee plantations are located in Minas Gerais, Sao Paulo and Parama, three southern states where the climate and temperature are ideal for coffee production. After reaching 55 million bags in 2016/2017, Brazil’s output is estimated to decline to 51.5 million bags in the crop year of 2017/2018. Compared to the crop year of 2016/2017, Arabica’s production decreased by 6.4% and only reached 38.63 million bags. Brazilian coffee exports for the year 2017/2018 are projected to remain stable at 33.03 million bags, the same as the export amount of the previous crop of 2016/2017. Green bean exports are forecast at 29.4 million bags, and 3.6 million bags for soluble coffee exports.
4,000 4,600 5,100 5,333 7,650 8,349 10,800 14,000 28,500 51,500 0 10,000 20,000 30,000 40,000 50,000 60,000 Mexico Peru Uganda India Ethiopia Honduras Indonesia Colombia Vietnam Brazil
9
Vietnam is the second largest coffee producing nation in the world but is the highest global producer of Robusta. Vietnam’s rapid expansion in coffee production, which was only 6,000 tons in 1975 and now is almost 2 million, has moved them to second place. Vietnam’s coffee industry has had an average growth rate of 1.4% per year. In the crop of 2017/2018, the cultivated area is 662,200 ha; similar with the previous years and over 95% of total output is Robusta. Production in Vietnam was revised down to 25.54 million bags in 2016/17 due to being overly hot, and dry and output in the current crop year of 2017/2018 is provisionally estimated to increase to 28.5 million bags, 11.6% higher than in the previous year (Coffee market report December, 2017, ICO)
Colombia is the third country in producing coffee, only after Brazil and Vietnam, but is the second highest global producer of Arabica coffee, only after Brazil. After having increased over the past five crop years, Colombia’s production is provisionally estimated to decrease by 4.3% to 14 million bags as heavy rains caused damage during the flowering period. Total production in 2016/17 was provisionally estimated at 14.5 million bags, and is forecasted to increase in the crop of 2017/2018 to 14.6 million bags as production recovery stabilizes and weather patterns remain normal.
Though they may not be as internationally known as a top producer, the nation of Indonesia produced 10.6 million bags of coffee beans in the coffee year of 2016/2017 and is forecast to increase by 0.3 million bags to 10.9 million in the crop year of 2017/2018. Approximately 85 percent of Indonesia’s coffee production is made up by Robusta bean production, while the remaining 15% is Arabica beans. Robusta bean production is concentrated in southern Sumatra, while the majority of Arabica production is located in northern Sumatra.
10
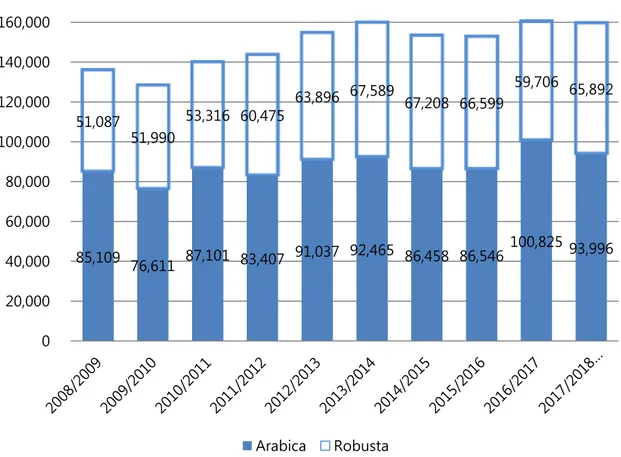
Figure 2: World Coffee Production
Source: U.S Department of Agriculture (USDA), 2017
During the period of 2008-2018, nearly 60% of the total coffee production has been Arabica and the remaining 40% has been Robusta. Total production of Arabica decreased from 100,825,000 bags in the crop year of 2016/2017 to 93,996,000 bags in the production year of 2017/2018. On the other hand, the total production of Robusta coffee tended to increase from 59,760,000 bags up to 65,892,000 bags. However, the total production amount between these two periods had a very tiny change. In the crop year of 2016/2017, Robusta coffee only reached 59,706,000 bags – the lowest amount since the crop of 2010/2011 and only accounted for 37.1% - the lowest percentage from the last ten years.
85,109 76,611 87,101 83,407 91,037 92,465 86,458 86,546 100,825 93,996 51,087 51,990 53,316 60,475 63,896 67,589 67,208 66,599 59,706 65,892 0 20,000 40,000 60,000 80,000 100,000 120,000 140,000 160,000 180,000 Arabica Robusta
11
Figure 3: Arabica and Robusta Production in Percentage
Source: U.S Department of Agriculture (USDA), 2017
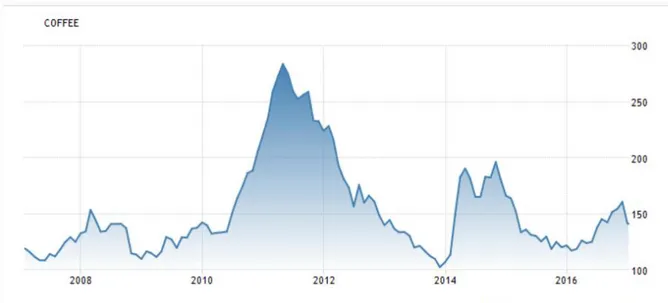
In general, the price of coffee fluctuated extremely during the last 10 years. In the last 10 years, from the crop of 2008/2009 to 2017/2018, the price of coffee reached its highest point in April, 2011 at over 250 US cents/lbs and reached the lowest point in November, 2013 around 100 US cents/lbs. In 2011, the production output reduced sharply, especially Arabica coffee, because of the effect of bad weather, whereas the demand for coffee on the world market grew constantly since coffee beverages have been becoming increasingly popular in all markets, especially from the manufacturing countries such as Brazil. In 2013, the reason why the price of coffee fell to its lowest point since 2007 is that the coffee market was also affected by developments in the broader global economic environment. Firstly, weaker‐than‐expected economic data from China at the beginning of the month suggested a slowdown in demand growth for commodities. In addition, signs of an end to the quantitative easing program in
62.5% 59.5% 62.0% 58.0% 58.8% 57.7% 56.3% 56.5% 62.8% 58.8% 37.5% 40.4% 38.0% 42.0% 41.2% 42.2% 43.7% 43.4% 37.1% 41.2% 0.0% 10.0% 20.0% 30.0% 40.0% 50.0% 60.0% 70.0% 80.0% 90.0% 100.0% Arabica Robusta Currency: %
12
the United States resulted in a widespread decline in commodity markets. These two factors exacerbated the weakness in the coffee market and contributed towards further price decreases.
Figure 4: Monthly Coffee Price from March 2007 to March 2017
Source: Trading Economics, 2017
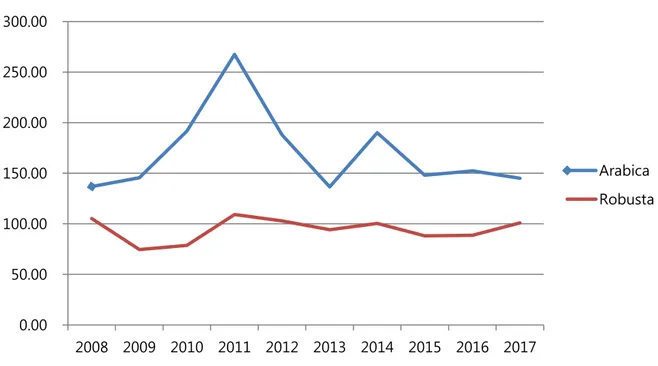
In more detail, the price of Arabica was higher than the price of Robusta, around 1.5 times, because Arabica coffee is shade grown in the mountains at over 600 meters above the sea level in temperate climates and is therefore more difficult to cultivate and harvest than plantation grown Robusta. And, Robusta is more disease and insect resistant than Arabica because Robusta plants produce as much as three times the amount of caffeine as Arabica plants. Additionally, consumers prefer to drink Arabica coffee rather than Robusta because the flavor is better, not strong like Robusta. The price of Arabica coffee has been controlled by the coffee market since the variation of the price of Arabica and general coffee prices are almost the same. On the other hand, in the period of 2008-2017, Robusta’s price did not change too much.
13
Figure 5: Price Fluctuation of Arabica and Robusta in the World
Source: International Coffee Organization (ICO), 2017
In the graph, we can see that the price of Arabica coffee reached its highest point in the year 2011 at 267.51 US cents/lb, and then it dropped rapidly until it reached the bottom at 136.54 US cents/lb. After that, the price increased a little bit and then has continued to decrease steadily, achieving 145.01 US cents/lb. On the other hand, the price of Robusta coffee was steadier than Arabica’s price; in recent years, when the price of Arabica had a trend to decrease, the price of Robusta had a trend to increase that led to the gap between these two coffee types becoming closer.
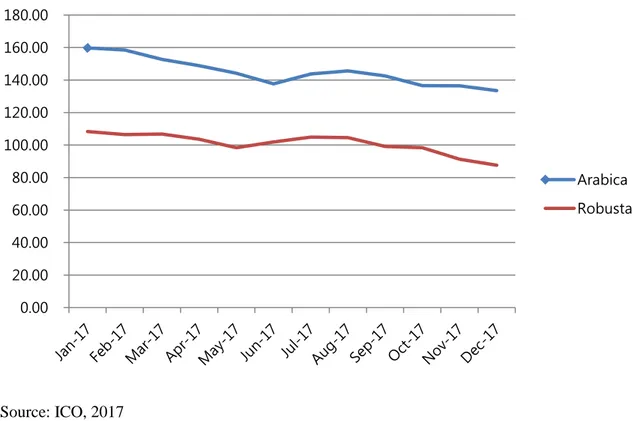
In 2017, according to the Coffee Market Report of International Coffee Organization, the price of both Robusta and Arabica decreased continuously from the beginning to the ending of the year, from 159.76 US cents/lb to 133.50 US cents/lb in case of Arabica and from 108.32 US cents/lb to 87.59 in case of Robusta. However, in general, the gap between Arabica and Robusta still remained the same. The price is forecasted to continue to decrease due to the increase in coffee output of the main exporting country. 0.00 50.00 100.00 150.00 200.00 250.00 300.00 2008 2009 2010 2011 2012 2013 2014 2015 2016 2017 Arabica Robusta
14
Figure 6: Price Fluctuation of Arabica and Robusta in the World in 2017
Source: ICO, 2017
2.2.2 Export and Import
In general, from the crop of 2013/2014 until now, total imports have increased steadily until the crop of 2016/2017 and after that had a little bit of a decrease in the period of 2017/2018. On the other hand, the amount of exported coffee fluctuated strongly which is shown in the Figure 7 below. In more detail, in the crop of 2016/2017 total export was 132,091,000 bags and is expected to decrease 2.43% in the crop of 2017/2018 to 128,879,000 bags. Total import also had a decrease (1.15%) to 124,710,000 bags between the production years 2016/2017 and 2017/2018
0.00 20.00 40.00 60.00 80.00 100.00 120.00 140.00 160.00 180.00 Arabica Robusta
15
Figure 7: World Coffee Import and Export (in thousand bags)
Source: USDA, 2017
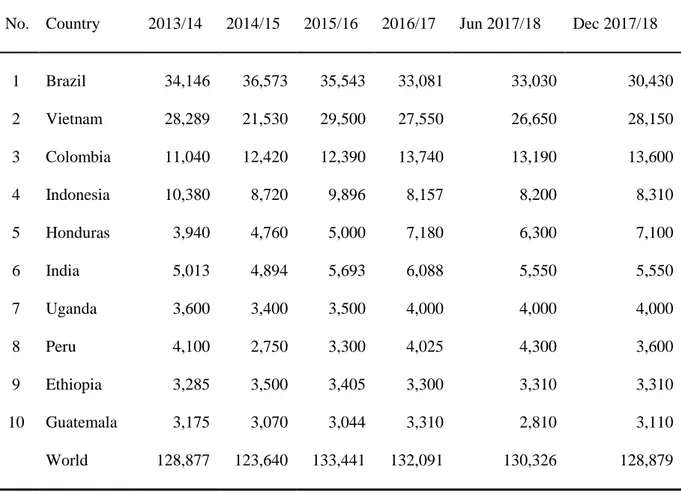
The International Coffee Organization (ICO) has 80 member countries in total in which more than 40 countries are coffee exporting countries. These countries can either grow and export coffee or only export coffee. However, the major coffee producing countries in the world are the countries that produce and export. Typically, countries such as Brazil, Colombia, Vietnam, Uganda, Ivory Coast, Ethiopia, India, etc. in which Brazil and Colombia are the countries producing and exporting mainly Arabica coffee in the world and Vietnam is the biggest country producing Robusta coffee in the world. At the end of the 2017/2018 period, as shown in the table below, Brazil was the biggest producing country and also the biggest exporting country with 30.43 million bags and followed by Vietnam with 28.15 million bags. Other biggest country exporters in the top 10 coffee exporting countries included: Colombia, Indonesia, Honduras, India, Uganda, Peru, Ethiopia and Guatemala (ranking from high to low based on export quantity). Coffee exports of the 10 leading countries accounted for 83.6% of
105,000 110,000 115,000 120,000 125,000 130,000 135,000 2013/2014 2014/2015 2015/2016 2016/2017 2017/2018 Import Export
16
world coffee exports in the 2016/17 season, in which the three markets Brazil, Vietnam and Colombia accounted for 56.3%. In the production year 2017/2018, the top 10 exporting countries are expected to account for 83.1% in which the biggest three countries are projected to account for 56.0%. From that, we can see that in the crop year of 2017/2018, the exporting amount tended to reduce from the largest countries.
Table 1. Top 10 Coffee Exporting Countries
Currency: thousand bags
No. Country 2013/14 2014/15 2015/16 2016/17 Jun 2017/18 Dec 2017/18
1 Brazil 34,146 36,573 35,543 33,081 33,030 30,430 2 Vietnam 28,289 21,530 29,500 27,550 26,650 28,150 3 Colombia 11,040 12,420 12,390 13,740 13,190 13,600 4 Indonesia 10,380 8,720 9,896 8,157 8,200 8,310 5 Honduras 3,940 4,760 5,000 7,180 6,300 7,100 6 India 5,013 4,894 5,693 6,088 5,550 5,550 7 Uganda 3,600 3,400 3,500 4,000 4,000 4,000 8 Peru 4,100 2,750 3,300 4,025 4,300 3,600 9 Ethiopia 3,285 3,500 3,405 3,300 3,310 3,310 10 Guatemala 3,175 3,070 3,044 3,310 2,810 3,110 World 128,877 123,640 133,441 132,091 130,326 128,879 Source: USDA, 2017
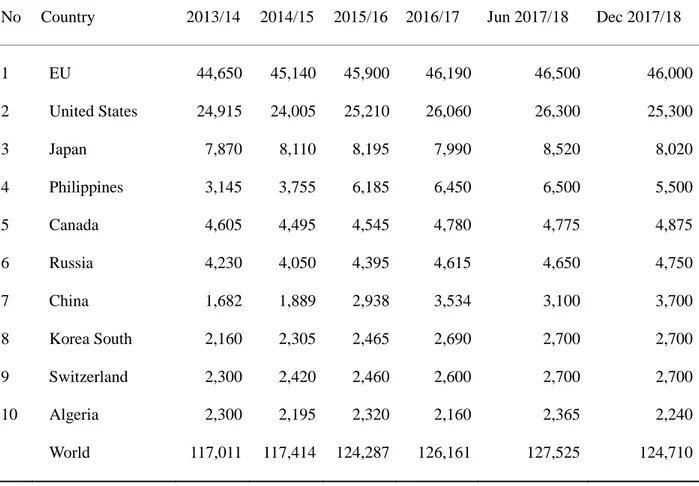
Coffee imports of the 10 leading countries accounted for 84.9% of total imports of coffee in the 2015/16 season. The three leading markets are the European Union, US and Japan accounting for 63.6% of imports of coffee in the world. In which, the EU was the biggest area imported coffee, since the import amount reached 46.19 million bags in the crop year of 2016/2017 which accounted for 36.6% of worldwide imports, and followed by the United Stated with 26.06 million bags in 2015/2016. The
17
other biggest coffee importing countries are in table below.
Table 2. Top 10 Coffee Importing Countries
Currency: thousand bags
No Country 2013/14 2014/15 2015/16 2016/17 Jun 2017/18 Dec 2017/18 1 EU 44,650 45,140 45,900 46,190 46,500 46,000 2 United States 24,915 24,005 25,210 26,060 26,300 25,300 3 Japan 7,870 8,110 8,195 7,990 8,520 8,020 4 Philippines 3,145 3,755 6,185 6,450 6,500 5,500 5 Canada 4,605 4,495 4,545 4,780 4,775 4,875 6 Russia 4,230 4,050 4,395 4,615 4,650 4,750 7 China 1,682 1,889 2,938 3,534 3,100 3,700 8 Korea South 2,160 2,305 2,465 2,690 2,700 2,700 9 Switzerland 2,300 2,420 2,460 2,600 2,700 2,700 10 Algeria 2,300 2,195 2,320 2,160 2,365 2,240 World 117,011 117,414 124,287 126,161 127,525 124,710 Source: USDA, 2017 2.2.3 Consumption
According to coffee trade statistics reported by ICO (international Coffee Organization) which was published in February 2018, total world coffee consumption has been increasing steadily year by year and is estimated at 158.9 million bags in the coffee year of 2017/18, an increase of 1.5 million bags compared to the 2016/2017 crop, and 3.13 million bags compare to the 2015/2016 crop.
18
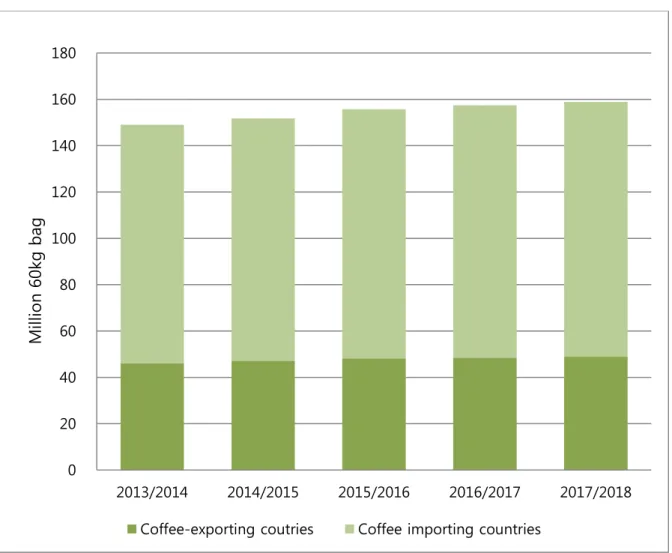
Figure 8: Consumption in Importing Countries and Exporting Countries
Source: ICO, 2018
Consumption in coffee-importing countries was twofold higher than consumption in exporting country. Furthermore, the consumption has increased steadily in both these types of countries and the consumption of coffee in the world is expected to increase without any interruption and will reach 158.9 million bags in 2017/2018. According to the ICO, the consumption of coffee has increased continuously during the last 40 years with the average annual growth rate in global coffee consumption at 1.3% since the coffee year 2012/2013, and the demand for coffee beverage increase by nearly 25% over the coming five years. By 2020, coffee demand is slated to rise to 175.8 million bags. Some of the biggest consumption countries in the world are showed in the graph below.
0 20 40 60 80 100 120 140 160 180 2013/2014 2014/2015 2015/2016 2016/2017 2017/2018 Coffee-exporting coutries Coffee importing countries
M ill ion 6 0k g bag
19
Figure 9: Top 10 Coffee Consuming Countries in 2016/2017
Source: USDA, 2017
2.3 Current Status of Vietnamese Coffee
2.3.1 Production and Price
During the 2000-2005 period, the coffee price had fallen in the world. Because of debt and lack of investment in coffee production, farmers are cutting down coffee trees and the area of planting coffee trees gradually being decreased. According to data from the General Statistic Office of Vietnam, during a five year period from 2000 to 2005, Vietnam’s coffee planted coffee area reduced by 70,000 hectares. As the planted area decreased, coffee output also decreased by 35,000 tons over five years.
After joining the WTO (1st November, 2007), although managers expected an increase in coffee 3.22 3.22 3.77 4.62 4.78 7.03 8.17 21.53 25.02 45.22 0.00 10.00 20.00 30.00 40.00 50.00
Ethiopia
Indonesia
China
Russia
Canada
Philippines
Japan
Brazil
United States
European Union
20
production based on the opportunity of expanding exports, not only the quantity of the output of coffee reduced, but also the quality of coffee was not good. At that time, Vietnam’s coffee price depended on the world price. In 2008, the world market continued to fluctuate due to the global economic crisis. Although the price of fertilizer and production costs increased continuously, the selling price of coffee went up and down without any regularity. Especially, the anomalous climatic environment was a factor of production output reduction. There were not any polices to support producers in order to maintain the relationship of buyers and sellers, and no support for technology applied in production. Therefore, Vietnamese coffee was still faced with the problems of excess production and anomalous price fluctuation. 90% of coffee trees were owned by ranch owners, garden owners and private family businesses. It is difficult to transfer technology and information to over 500,000 people who were planting coffee trees. In 2009, coffee production had faced many difficult things.
In the crop year of 2008/2009, Vietnamese coffee production reached 1,080,000 tons. The average production was 2.16 ton/ha. The government strived to increase the cultivation area from 500,000 to 525,000 hectares as well as focus on investments to improve crop area productivity. In recent years, many farmers expanded their cultivation area by 2000 hectares/year. In 2009, the cultivation area of Arabica coffee was 35,000 hectares, accounting for 6% of the total coffee planting area in Vietnam. Until 2010, Vietnamese coffee production was the second largest in the world, accounting for 14% of the world’s production. Vietnamese coffee is grown mainly in five provinces in Tay Nguyen (Dak Lak, Dak Nong, Gia Lai, Kon Tum, and Lam Dong) which accounts for more than 80% of Vietnam's coffee cultivation area.
The cultivation area of coffee trees has continuously grown in the main region. According to data from Vietnam’s Ministry of Agriculture and Rural Development (MARD), in 2016/2017 the total coffee tree cultivation area was 662,200 ha, which was 50 ha less compared with the cultivation area in the previous year 2015/2016. The cultivation area in the next crop of 2017/2018 is predicted to be same as the previous crop year. Dak Lak, Lam Dong, Dak Nong and Gia Lai provinces accounted for 86% of total coffee tree cultivation area, mainly planting Robusta coffee. On the other hand, Arabica
21
coffee is mainly planted in 3 provinces, including Lam Dong, Quang Tri and Dien Bien in which Lam Dong is the largest area with 16,000 ha of Arabica coffee. Arabica coffee cultivation area accounts for 10% of the total cultivation area in the whole country whereas Robusta coffee accounts for 90% of the total cultivation area.
Table 3: Estimate of Vietnam’s Coffee Areas by Province
Province Approximate Coffee Area in MY 2014/2015 Approximate Coffee Area in MY 2015/2016 Approximate Coffee Area in MY 2016/2017 Approximate Coffee Area in MY 2017/2018 Dak Lak 209,760 209,000 190,000 190,000 Lam Dong 151,565 154,000 162,000 162,000 Dak Nong 131,859 126,000 135,000 135,000 Gia Lai 83,168 80,000 82,500 82,500 Dong Nai 20,800 21,000 21,000 21,000 Binh Phuoc 15,646 16,000 16,000 16,000 Kontum 12,390 14,000 13,500 13,500 Son La 10,650 12,000 12,000 12,000 Ba Ria–Vung Tau 15,000 15,000 15,000 15,000 Quang Tri 5,050 5,050 5,000 5,000 Dien Bien 3,385 4,500 4,500 4,500 Others 5,700 5,700 5,700 5,700 Total 665,009 662,250 662,200 662,200 Source: USDA, 2017
Vietnam coffee production increased continuously from 2008/2009 until it reached its highest point at 29.8 million bags in 2013/2014. After that it has fluctuated continuously. In the crop year of 2016/2017, Vietnam’s coffee production only achieved 26.7 million bags – the lowest amount during the last 5 years due to unfavorable weather conditions (El Nino and La Nina).. However, in the crop
22
of 2017/2018, the production is projected to reach 29.9 million bags – the highest amount during the past 10 years, an increase of 12% compared with the previous year crop. (El Nino phenomenon: very hot weather, little rain, high temperatures and low humidity. La Nina phenomenon: lots of rain, high humidity)
Figure 10: Arabica and Robusta Production in Vietnam Coffee Industry
Source: USDA, 2018
Vietnam is one of the main countries in planting and producing Robusta coffee, hence the production of Robusta coffee is far higher than Arabica each year. In the crop of 2016/2017, with 26.7 million bags of coffee, 25.6 million bags were Robusta, which accounted for 96% of total production, Arabica accounting for only 4% of total production. In the next crop of 2017/2018, this proportion is predicted to remain unchanged and both Arabica production and Robusta production is expected to increase.
Although Vietnam is the second biggest coffee producing country in the world, lots of limitations existing in Vietnam’s coffee industry
0 5000 10000 15000 20000 25000 30000 35000 Arabica Robusta
23
1. Limitations in production stage
The area of farms with old, stunted coffee plants has increased in the Central Highlands,
resulting in a decrease in output. Now, the area of farms which have coffee trees that are more than 20 years old is 86,000 ha, account for 13.8% of the total coffee cultivation area. In addition, over 40,000 ha of coffee trees that are have not grown well, branches that developed with little, many branches do not have coffee fruit, the average productivity is low which under 1.5ton/ha, low-quality fruit, and so producers do not receive any profit. According to reports from Agriculture Departments in the Central Highland provinces, the region needs to replant around 200,000ha by 2020, due to the area having old and stunted coffee trees. Dak Lak needs to replace 85,000ha; Lam Dong 59,000ha; Gia Lai 27,000ha; and Dak Nong 24,000ha.
Small-scale farm and dispersion. Small-scale farms are common. The number of households
that own an area of 2 to 5 hectares only account for 9.75%, whereas household owning less than 1 ha account for 63%. The coffee cultivation area of small households accounts for 84.8-87.9% of the entire coffee industry. Households have a small-scale production, so it is difficult for them to get loan capital which is used for production development, re-cultivation, and research in new coffee varieties; and applying technical advances is limited. That is the reason why the productivity is not as high as expected.
Fertilizers abusing. When the price increases, in order to achieve maximum productivity, farmers
use lots of chemical fertilizers, higher than the standard of 10-30%. Coffee cultivation areas which use organic fertilizers account for only 50%
Water-saving irrigation technology is applied slowly. Coffee cultivation areas which are irrigated by surface water account for 18%, by underground water account for 69.6%, and coffee growing areas which are irrigated by rain-water account for 12.4% of the total coffee cultivation area. In general, irrigation techniques have not improved, almost all coffee growers waters their coffee crops based on their experience and amount of water used is higher than the standard 600-700 m3/ha/crop (the standard is 2000-2005 m3/ha/crop) which causes a waste of water.
24
Harvesting unripe fruits. Coffee harvesting with unripe fruit is the biggest limitation of coffee
production in Vietnam, due to the fact that management of coffee in the crop is still limited. In detail, in Tay Nguyen (Dak Lak, Dak Nong, Lam Dong, Gia Lai) show that 15.5 of household farmers harvest coffee one time during a crop, 64.5% two times and 20% three times. The proportion of ripe coffee cherries after harvest is 45.7%. The number of households that have ripe coffee cherries rate lower than 50%; 41.8 of households have the rate from 50-70%, and only 12.5% of households have a rate over 70%. Because of that, it is really difficult to apply the wet processing method (which is more efficient than the dry method) so green and brown bean have a high percentage in coffee production
Some coffee areas developed out of the plan. Coffee areas which were developed out of the plan
have faced many risks, especially the lack of irrigation water when droughts occur, evidenced by the drought in 2013.
2. Limitations in the preliminary treating, processing and preserving of coffee
The conditions of preliminary treatment, preservation and storage of coffee of households are inadequate. Coffee cultivation areas which are owned by household farmers account for 90% of the entire industry, in which many ethnic minority households are in remote areas, lacking drying yards, storage facilities and technical requirements. In 4 provinces, namely Gia Lai, Dak Lak, Dak Nong and Lam Dong we can see that cement drying yards accounts for 61.5%, drying on tarpaulin accounts for 13.5% and drying on the ground accounts for 25% of the total area of drying yards
Because of not having enough yards for drying, 71% of the output of coffee is dried from fresh coffee cherries, 20.8% has the skin removed before drying and only 8.2% is sold as fresh coffee cherries to processing factories which have enough facilities to dry coffee. That is one reason why the rate of black, brown and moldy seed is high. In addition, inventory for the temporary storage of coffee has not reached technical standards; hence coffee fruits and seeds after storage time will have increased in humidity, resulting in a change of their original color which will have an effect on the quality of coffee
25
Until now, in Vietnam, there have been a total of 97 small factories that are processing coffee beans, 160 small factories that are processing coffee powder, and only 5 small factories for instant coffee. Vietnam is a country that mainly exports green coffee rather than processed coffee, exporting 90% green coffee, and only the remaining 10% of green coffee is used to produce processed products; such as coffee powder, roasted coffee, instant coffee and so on. Furthermore, Vietnamese processed coffee is short of famous brands, until now there have only been 3 famous brands including: Trung Nguyen Coffee, Buon Ma Thuat Coffee, and Vinacafe but only Trung Nguyen Coffee is well-known in the world market.
2.3.2 Export and Import
Vietnam’s coffee export, if compared with other agricultural products, has progressed more quickly. According to the statistics from the ICO, in the world, from the year 2000, most of the major coffee producers have made an increase in production. Brazil holds the first position in the international coffee market with an output of 35.5 million bags, following by Vietnam – the second biggest coffee exporter, with an output of 29.5 million bags in the crop of 2015/2016. The other main coffee exporters include Colombia, Indonesia and so on.
26
Table 4: Vietnamese Coffee Import Quantity and its Percentage
Currency: thousand 60 kg bags
Crop Year Vietnam Export World Export % Vietnam coffee Export
2008/2009 15,565 102,931 15.12% 2009/2010 18,670 104,813 17.81% 2010/2011 18,640 115,319 16.16% 2011/2012 24,495 116,402 21.04% 2012/2013 24,643 119,074 20.70% 2013/2014 28,289 128,877 21.95% 2014/2015 21,530 123,640 17.41% 2015/2016 29,500 133,441 22.11% 2016/2017 27,550 132,091 20.85% 2017/2018 28,150 128,879 21.84% Source: USDA, 2017
Vietnamese coffee export amount increased continuously during the period of 2008/09~2013/14, especially soared from the crop 2011/12. However, until reaching the highest point in 2013/14 with 28.3 million bags, the amount of export fell to the lowest point in the crop 2014/15 at only 21.5 million bags. After that, Vietnamese coffee export amounts have gradually recovered and grown again. In recent years, Vietnamese coffee export quantity has accounted for over 20% of the total exporting coffee in the world (except the crop of 2014/15) and maintained the second biggest position in coffee exporting.
In more detail, according to the statistics from General Department of Vietnam Customs, in the crop of 2016/17, Vietnam exported about 25 million bags of green coffee, increased 1.95 million bags compared with in the previous 2015/16. In the crop 2017/18, exporting amount of green coffee is predicted to increase to 25.5 million bags due to an advantage in harvesting. Together with green
27
coffee export, Vietnam also exports roast coffee and instant coffee. In the crop of 2016/17, Vietnam exported 550,000 bags of roast coffee and 2 million bags of instant coffee. In the crop year of 2017/18 export turn-over is predicted to be equivalent with the current crop. In the present, Vietnam mainly exports green coffee rather than processed coffee (roast coffee, instants coffee.) with the percentage of green coffee export is 90% and only 10% of processed coffee.
Table 5: 10 Main Countries Vietnam Exports Coffee to
Currency: ton No. Countries 2015 2016 2017 (First 8 months) 1 Germany 191,644 275,679 157,601 2 America 157,117 237,195 139,559 3 Italia 105,578 136,223 89,720 4 Spain 117,600 115,466 70,755 5 Japan 84,169 104,450 64,956 6 Belgium 61,491 86,747 48,688 7 Algieri 46,164 59,812 38,667 8 Russia 36,793 64,050 29,982 9 Philippine 31,644 59,025 34,114 10 India 27,398 45,790 29,549 Total 1,341,839 1,781,642 1,024,518 Source: USDA, 2017
In the crop year of 2015/16, especially from Jan to Feb 2016, the monthly export price of green Robusta coffee (FOB price in Ho Chi Minh City) fell to the lowest point within the last 4 seasons. The export price from March to June 2016 recovered due to bad weather condition which had negative effects on coffee production in both countries Vietnam and Brazil.
28
At Lam Dong, Robusta green coffee bean reached the lowest price at 32,000 VND/kg (around 1.5USD) in January 2016, compared to 39,600 VND/kg (around 1.8 USD) in the same month of the previous year. The export price touched bottom in February and March, 2016; however, it recovered steadily to increase from April to September due to a poor crop in Brazil and drought in some provinces of Vietnam
However, in the crop year of 2016/2017, the price of coffee increased again after one year price dropping and was higher than the average price during the last 5 years, and the price was always over $1,900. The reason come from a decrease in production and inventory in both markets Vietnam and Brazil.
Figure 11: Average Export Price for Green Coffee in Vietnam
Currency: in USD
Source: Ministry of Industry and Trade, 2017
Although Vietnam is the second biggest coffee exporter in there world, Vietnam still imports some processed coffee; include roasted, brewed and instant coffee. Vietnam also imports a small amount of coffee beans, roasted coffee and instant coffee from Lao, Indonesia, Brazil, Cote d’Ivoire and America. The imported amount of roasted and ground coffee have been increasing in recent years due to the expansion of the retail sectors in Vietnam’s domestic market with some famous brands like Starbucks,
Oct Nov Dec Jan Feb Mar Apr May Jun Jul Aug Sep
29
McCafé và Dunkin Donuts...
In the crop of 2015/2016, Vietnam imported 630,000 bags of coffee in which 160,000 bags were instant coffee; 450,000 bags were green coffee and 20,000 bags were roast coffee. Total coffee imports in the production year of 2016/2017 were expected to be up from 640,000 to 1 million bags of Green Bean Equivalent (GBE), due to the rapid expansion of coffee shops in Vietnam. In which, 160,000 bags were soluble coffee, 340,000 bags were roast and ground coffee, and 500,000 bags were green bean. Experts forecast that total imported coffee will be 1.06 million bags in the year of 2017/2018
Table 6: Quantity of Vietnam’s Coffee Import from 2008 - 2018
Currency: thousand bags
Year Quantity 2008/09 95 2009/10 75 2010/11 350 2011/12 450 2012/13 824 2013/14 648 2014/15 590 2015/16 630 2016/17 1,000 2017/18 1,060 Source: USDA, 2017 2.3.3 Consumption
Although Vietnam is the second biggest coffee exporters in the world, domestic consumption is quite low, only reaching 1.15kg/person/year, whereas Brazil ranks at the first position on the list of top coffee drinkers. With the highest per capita coffee consumption rate of 4.8kg per year, Brazilians drink an average of 1.32 cups of coffee per day. However, domestic consumption has increased
30
continuously during the last ten years and is expected to increase quickly in the future. In the crop of 2016/17, in the whole country, the Vietnamese consumed total 2.87 million bags of coffee and is expected to increase to up to 2.93 million bags in the year 2017/2018 due to the continuing growth of coffee shops. Moreover, domestic consumption is predicted to increase based on an increase in GDP as well as in population. In the period of 2005-2015, the coffee consumption in Vietnam increased surprisingly from 0.43kg per capita to 1,38kg per capita – the highest growth rate among the world’s coffee exporters. This figure is expected to increase up 2.6kg per capita by 2021. Vietnam Ministry of Agriculture and Rural Development expect that domestic coffee consumption will increase by about 10 -15% in the crop year of 2017/2018. Vietnamese coffee drinkers prefer roasted and ground coffee because of its full-bodied and original flavors.
In recent years, in Vietnam, there have been many violations in coffee production, especially using roasted corn pulp, soybeans and chemicals to make fake coffee and then launch it into the market through small shops, kiosks and retail coffee shops. Therefore, in order to regain the trust from consumers, many coffee shops grind and brew coffee in front of customers. But, “dirty” coffee – coffee which contains many other materials – is mainly sold to low-income people or people who live in remote areas. Coffee culture in Vietnam has brought a wide range of products and many different levels of prices for consumers. Consumers can easily find coffee shops selling black coffee at just 10,000 VND (~0.5 USD) or up to 70,000 VND (~3.5 USD) per cup. In general, the coffee shops in Vietnam are highly appreciated for their variety of forms, services and products.
According to Euromonitor, the prominent presence of specialist coffee chains allows consumers to have easy access to high-quality, freshly brewed coffee at affordable prices. Consumers can also easily prepare instant coffee for consumption at their offices or homes. Domestic consumption is forecast to continue to grow, reflecting the expansion of retail coffee shops and the robust growth of other retail food service subsectors serving coffee in Vietnam. The expanding coffee retail sector will contribute to stronger consumption for the foreseeable future.
31
annual sales increase of 32%. The high growth is due to the expansion of branches of current coffee brand shops and the entry of new brands. In 2017, Starbucks increased the numbers of stores up to 29. McCafe opened 9 stores since it entered in Vietnam in 2014. The store chains such as Coffee Bean and Tea Leaf, Gloria Jeans, Coffee Concept and Highland have continuously increased their branches. The booming growth of these coffee shop chains clarifies an increase in demand of customers in coffee as well as its quality and services.
Moreover, there are a large number of smaller coffee shop chains, with the idea of serving both traditional coffee which is good for health and foreign style coffee (ice blending, latte, fruit smoothies) with more competitive prices than foreign brands. The large and small coffee shop chains in the country such as Trung Nguyen Coffee, Passio Coffee, Phuc Long, Thuc Coffee, Effoc Coffee, Takeaway Coffee, Napoli and Milano have developed and influenced domestic consumption.
In Vietnam, coffee shops are a model which mainly brings revenue for the coffee drinking industry. Besides that, the model of takeout coffee is being developed more broadly and is suitable for busy people who live in big cities. Takeout coffee is becoming more and more popular over the traditional style of drinking coffee (street coffee). Now, many brands have used the type of takeout coffee and hoe delivery to extend the number of customers.
In case of instant coffee, according to the Vietnam Coffee and Cocoa Association, Vietnam’s total targeted production for instant coffee was about 2.67 million bags in the crop of 2015/16. However, the actual production only achieved 50% of this goal. Given the strong demand for instant coffee products domestically and a growing demand for export, the USDA estimates that instant coffee consumption was at 350,000 bags in 2015/16 and 370,000 bags in 2016/17 and is projected to rise to 380,000 bags in the year 2017/2018.
The prominent presence of specialist coffee chains allows consumers to have easy access to high-quality, freshly brewed coffee at affordable prices. Consumers can also easily prepare instant coffee for consumption at their offices or homes. Domestic consumption is forecasted to continue to grow, reflecting the expanding retail coffee shops and robust growth of other retail food service subsectors
32
serving coffee in Vietnam. The expanding coffee retail sector will contribute to stronger consumption for the foreseeable future.
Table 7: Vietnam’s Domestic Consumption by Specific Types
Currency: in thousand 60kg bags
2015/2016 2016/2017 2017/2018
Domestic consumption – Roasted coffee 2,280 2,500 2,550 Domestic consumption – Instant coffee 350 370 380 Total domestic consumption 2,630 2,870 2,930
Source: USDA, GTA, Ministry of Industry and Trade of the Socialist Republic of Vietnam
SWOT Analysis of Vietnam Coffee Industry
Besides statistic information about the Vietnamese coffee industry which is shown in the previous parts, SWOT analysis is also analyzed in order to understand deeply about the Vietnam’s coffee industry. The main contains of SWOT are the analysis of Vietnamese coffee’s Strengths, Weaknesses, Opportunities and Threats.
STRENGTHS WEAKNESSES
- Vietnam is a coffee exporting country with a huge amount of production quantity and low prices
- Plentiful low-cost labor force
- Maintain the second position in the market world in term of producing and exporting green bean coffee
- Land condition is good
- Still not producing coffee with high value - Cultivation area of coffee is old that lead to a reduction in production output
- Irrationality of type of coffee production - Have a little amount of coffee brand names
33
OPPORTUNITIES THREATS
- Value and brand enhancement - Coffee consumption increase - High-tech development
- Foreign Direct Investment (FDI) - Government policy support
- Climate change effect
- Not enough capital to re-cultivate old cultivation areas
- Self-development, lack of planning, small-scale production
- Unstable coffee prices, input material price increase.
- Foreign Direct Investment (FDI)
Strengths
First of all, Vietnam is a coffee exporting country with huge amount of production quantity and low prices. In 2015/2016, Vietnam held the second position in the world market in exporting coffee and its production output achieved 29.3 million bags. In the present, some large countries focus mainly on producing Arabica coffee with high quality and the prices are also high. However, the price of coffee exported from Vietnam is very low, about 1,500~2,000 USD/ton; hence Vietnam can attract importing companies because it could help those company save on the cost of raw materials which would bring more revenue for them.
Secondly, Vietnam has plentiful a low-cost labor force. In 2016, the population of Vietnam was estimated at 92.7 million, ranking 13th in the world in which 47.5 million people are of a working age.
With young a labor force, Vietnam has an advantage in young and plentiful labor as well as in low-cost labor. The labor force has been increasing continuously without any decrease and accounts for 51.2% of the country’s total population. In the field of coffee, the labor force accounts for 2% of the total national labor force.
Thirdly, Vietnam still maintains the second position in the market world in term of producing and exporting green bean coffee. According to this strength, Vietnam can create an opportunity in
34
investment from foreign countries in capital and technology support. Coffee is one of the main exported agriculture products of the country; hence coffee management companies as well as farmers receive many concerns from the government for support, encouragement and investment policies.
Fourthly, Vietnam’s land condition is good. The soil from the central plateau to the southeast area of Vietnam has basaltic soil which brings high economic value. This advantage in land helps Vietnam produce coffee with high quantity as well as creates special natural taste for coffee
Weaknesses
The first weak point is that Vietnam does not produce high value coffee. Vietnam mainly produces Robusta coffee with 85% of the total coffee production rather than Arabica coffee, which only accounts for 15%; hence Vietnam can produce a huge amount of Robusta coffee with a low price in order to supply to the international market. However, the technology lags behind other countries, which effects negatively in producing high quality Robusta coffee. Although Vietnam has had many development policies and investments in order to improve facilities for producing coffee, the industry is still considered to be lacking in professionalism and technology compared to developed countries or producing countries with a long history in the production of coffee.
The second point is that the cultivation area of coffee is old, which leads to a reduction in production output. According to the Western Highlands Agro-Forestry Scientific and Technical Institute (WAIS), Vietnam coffee trees in the age of 22 to 25 years old account for 22%, the trees below 12 years old account for 50%. In addition, coffee growing farm do not have enough tools and techniques to propagate good seedlings. In some areas, the trees in the age of 22 to 25 years old account up to 25-30% such as in Dak Lak. Therefore, coffee trees cannot grow up and can easily to be destroyed by pests, which explains why a reduction in productivity.
Thirdly, there is an irrationality of type of coffee production. Vietnam mainly produces and exports Robusta coffee. However, in the world coffee market, Robusta coffee receives less preference than Arabica coffee since the coffee consumption of Arabica coffee is twofold higher than the
35
consumption of Robusta coffee
Fourthly, Vietnam has only a few coffee brand names. Excepting Buon Me Thuot coffee and Trung Nguyen coffee brand name, Vietnam does not have any other big and strong brand names for coffee which can enter and compete in the world market. Vietnam mainly produces and exports only green bean coffee with low prices; hence it receives a low turnover. Also, Vietnamese coffee exporting companies have a limitation in financial capacity therefore they cannot build a strong trademark. Because the marketing fee for building a strong trademark is very high and many risks may occur during the process; it is very hard to research and make a plan for a new product.
Opportunities
First of all, there is an opportunity for Vietnam’s coffee value and brand enhancement. There are some coffee brand names which are famous and well-known in the world market such as Trung Nguyen coffee. Therefore, in order to make current brands become stronger and more well known, Vietnam needs to enhance the trust of their customers by providing quality coffee with a beautiful taste which would be a tool to help protecting the benefits for Vietnam’s domestic companies in producing coffee.
Secondly, coffee consumption not only in the Vietnamese domestic market but also in the world market is increasing continuously without any reduction. According to International Coffee Organization (ICO), the demand for coffee consumption will increase 25% within the next 5 years. In detail, coffee consumption will increase up to 175.8 million bags in 2020 compared to 141.6 million bag (60kg/bag) in 2015. According to Hanns R. Neumann Stiftung Corporation’s prediction, global coffee consumption will increase 30% to 200 million bags in 2030. In Vietnam’s domestic market, the coffee consumption achieved 2.6 million bags in 2015 in and is expected to increase in the coming years.
Thirdly, there is high-tech development. Results of researching coffee variety and advanced technology has been applied in production, the new Robusta varieties such as TR4, TR5, TR6, TR7,
36
TR8, TR9, TR10, TR11, TR12, TR13 and new Arabica varieties include TN1, TN2, which have a high productivity, have been chosen to create, been recognized and have been transferred to production. Some advanced technology such as multiplication, replanting, improvement grafting, intercropping, and water-saving irrigation are being applied in order to increase the productivity of coffee as well as contribute to reduce the cost of production.
Fourthly, there is Foreign Direct Investment (FDI). FDI projects from foreign countries for processed coffee (coffee powder and instant coffee) with modern technology and equipment, mechanization and automatic systems contribute to increase the quality and diversity of coffee products sold in the domestic market and abroad. According to the Investment Promotion Center, Dak Lak province has attracted 15 investment projects in the coffee sector, with a total capital of nearly 5,400 billion in which 4 investment projects are Foreign Direct Investment (FDI) with the total capital of nearly 1,300 billion.
Fifthly, there is the government policy support. The government increases investment in agriculture and rural areas. Many new government policies have been issued to support farmers and enterprises in order to overcome difficulties, develop the land and encourage the producers and enterprises in term of producing coffee to achieve sustainable efficiency.
Threats
Firstly, there is climate change effect. Temperature and rainfall are two main factors which directly effect on production and quantity of coffee. The effect of climate changes such as droughts and unseasonal rains make it difficult to produce and difficult to deal with, especially in Tay Nguyen area, the coffee area which is not irrigated up to 53.6 thousand ha. In addition, high temperatures create favorable conditions for certain pests and diseases to appear, develop and spread to other areas. Pests will increase when the temperature increases. Consequently, the management and control of pests and diseases in the future will be more complex and expensive.
37
Vietnam Coffee-Cacao Organization, coffee trees aged from 20-25 years old in the country cover about 86,000 ha, accounting for 73% of the total coffee growing area. There are about 40,000 ha of coffee trees under 20 years old but they are old and stunted, poor growing, and the quality of cherry fruits is quite low. Thus, the total of old plants need to be replaced and changed is about 140.000-160.000 ha in the next 5-10 years, especially in Tay Nguyen province. According to the calculation of the Agriculture Department, it will cost from 80-150 million VND (~3,500 – 7,000 USD) per ha to replant new coffee trees, which is a lot of money for farmers. Farmers can borrow money from banks with the supported interest rate of about 6.5% per year. But until 31/3/2016, only 9 organizations and 5,923 individuals have been able to borrow money with supported interest rates, the total amount of money lent only reached 758.13 billion VND in order to replant 9,479 ha coffee, while the total money lent with a supported interest rate from the government for replanting coffee was about 12,000-15,000 billion VND in the period of 2014-2020 (an average about 2,500 billion / year). Therefore, many people and businesses have demanded loans for replanting coffee, but still cannot approach the capital with a supported interest rate. It is not capital for replanting coffee trees that leads an increase of the old planting coffee area.
Thirdly, there is self-development, a lack of planning, and small-scale production. Small-scale production limits the security in production and investment as well as reduces the efficiency of application of science and technology that leads to the quality of Vietnamese coffee not being identical, which means each area will produce different levels of quality. In addition, it is difficult to transfer advanced technology to farmers as well as farmers have a hard time to learn cultivation knowledge from experts.
Fourthly, there is unstable coffee price, and input material price increase. The price of coffee depends on many factors, especially climate, which effects much on coffee price. When the weather is in good condition for coffee growth the productivity increases, the price will decrease and vice versa. Other input materials such as fertilizer and pesticides increase continuously year by year.
38
enterprises in Vietnamese coffee are increasing and showing their power. Meanwhile, many domestic companies are in trouble, even facing bankruptcy or closing factories due to a lack of raw materials to process and produce coffee products. According to the Vietnam Coffee-Cacao Association (Vicofa), appearing only after a few years, FDI enterprises have occupied 50% of the total coffee production in Vietnam, an equivalent of 600,000 tons per year.