Association of Gestational Weight Gain With Maternal
and Infant Outcomes
A Systematic Review and Meta-analysis
Rebecca F. Goldstein, MBBS, FRACP; Sally K. Abell, MBBS, FRACP; Sanjeeva Ranasinha, MSc, MEpi; Marie Misso, MSc, PhD;
Jacqueline A. Boyle, MBBS, FRANZCOG, PhD; Mary Helen Black, MS, PhD; Nan Li, MSc; Gang Hu, MD, MPH, PhD; Francesco Corrado, MD; Line Rode, MD, PhD; Young Ju Kim, MD, PhD; Margaretha Haugen, BSc, PhD; Won O. Song, MPH, PhD; Min Hyoung Kim, MD, PhD; Annick Bogaerts, RM, MSc, PhD; Roland Devlieger, MD, PhD; Judith H. Chung, MD, PhD; Helena J. Teede, MBBS, FRACP, PhD
IMPORTANCEBody mass index (BMI) and gestational weight gain are increasing globally. In
2009, the Institute of Medicine (IOM) provided specific recommendations regarding the ideal gestational weight gain. However, the association between gestational weight gain consistent with theIOM guidelines and pregnancy outcomes is unclear.
OBJECTIVETo perform a systematic review, meta-analysis, and metaregression
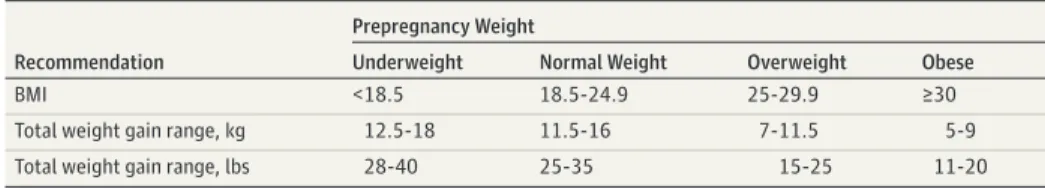
to evaluate associations between gestational weight gain above or below the IOM guidelines (gain of 12.5-18 kg for underweight women [BMI <18.5]; 11.5-16 kg for normal-weight women [BMI 18.5-24.9]; 7-11 kg for overweight women [BMI 25-29.9]; and 5-9 kg for obese women [BMIⱖ30]) and maternal and infant outcomes.
DATA SOURCES AND STUDY SELECTION Search of EMBASE, Evidence-Based Medicine Reviews,
MEDLINE, and MEDLINE In-Process between January 1, 1999, and February 7, 2017, for observa-tional studies stratified by prepregnancy BMI category and total gestaobserva-tional weight gain.
DATA EXTRACTION AND SYNTHESIS Data were extracted by 2 independent reviewers. Odds
ratios (ORs) and absolute risk differences (ARDs) per live birth were calculated using a random-effects model based on a subset of studies with available data.
MAIN OUTCOMES AND MEASURES Primary outcomes were small for gestational age (SGA),
preterm birth, and large for gestational age (LGA). Secondary outcomes were macrosomia, cesarean delivery, and gestational diabetes mellitus.
RESULTS Of 5354 identified studies, 23 (n = 1 309 136 women) met inclusion criteria.
Gestational weight gain was below or above guidelines in 23% and 47% of pregnancies, respectively. Gestational weight gain below the recommendations was associated with higher risk of SGA (OR, 1.53 [95% CI, 1.44-1.64]; ARD, 5% [95% CI, 4%-6%]) and preterm birth (OR, 1.70 [1.32-2.20]; ARD, 5% [3%-8%]) and lower risk of LGA (OR, 0.59 [0.55-0.64]; ARD, −2% [−10% to −6%]) and macrosomia (OR, 0.60 [0.52-0.68]; ARD, −2% [−3% to −1%]); cesarean delivery showed no significant difference (OR, 0.98 [0.96-1.02]; ARD, 0% [−2% to 1%]). Gestational weight gain above the recommendations was associated with lower risk of SGA (OR, 0.66 [0.63-0.69]; ARD, −3%; [−4% to −2%]) and preterm birth (OR, 0.77 [0.69-0.86]; ARD, −2% [−2% to −1%]) and higher risk of LGA (OR, 1.85 [1.76-1.95]; ARD, 4% [2%-5%]), macrosomia (OR, 1.95 [1.79-2.11]; ARD, 6% [4%-9%]), and cesarean delivery (OR, 1.30 [1.25-1.35]; ARD, 4% [3%-6%]). Gestational diabetes mellitus could not be evaluated because of the nature of available data.
CONCLUSIONS AND RELEVANCE In this systematic review and meta-analysis of more than
1 million pregnant women, 47% had gestational weight gain greater than IOM recommendations and 23% had gestational weight gain less than IOM recommendations. Gestational weight gain greater than or less than guideline recommendations, compared with weight gain within recommended levels, was associated with higher risk of adverse maternal and infant outcomes.
JAMA. 2017;317(21):2207-2225. doi:10.1001/jama.2017.3635
Editorialpage 2175
Supplemental content CME Quiz at
jamanetwork.com/learning
Author Affiliations: Author
affiliations are listed at the end of this article.
Corresponding Author: Helena J.
Teede, MBBS, FRACP, PhD, Monash University, 43-51 Kanooka Dr, Clayton, Melbourne, Victoria 3168, Australia ([email protected]).
JAMA |
Original Investigation
E
xcessive and insufficient gestational weight gain have been associated with adverse pregnancy outcomes, including small for gestational age (SGA), large for ges-tational age (LGA), macrosomia, cesarean delivery, gesta-tional diabetes mellitus (GDM), preeclampsia, postpartum weight retention, and offspring obesity.1-4The Institute ofMedicine (IOM; now known as the National Academy of Medicine) recommendations regarding gestational weight gain were developed in 1990 to guide clinical practice.5These
aimed to reduce the incidence of low-birth-weight babies and were based on a 1980 National Natality Survey of a largely white population. The updated IOM guidelines in 20096
incorporated World Health Organization (WHO) categories of maternal body mass index (BMI; calculated as weight in kilo-grams divided by height in meters squared; BMI for under-weight, <18.5; normal under-weight, 18.5-24.9; overunder-weight, 25-29.9; and obese, ≥30)7
and recommended less gestational weight gain for obese women (Table 1). The 2009 guidelines identi-fied maternal and infant relationships with gestational weight gain but were based on lower general population BMI with limited ethnic diversity. The 2009 IOM guidelines are endorsed by the American College of Obstetricians and Gyne-cologists, although they are not universally implemented.8
The prevalence of obesity and excess gestational weight gain are increasing. The US female obesity prevalence was 40% in 2013-2014.9
More than 50% of obese pregnant women gained gestational weight greater than the IOM gestational weight gain recommendations in a US study that collected data from 2002 through 2008.10
The purpose of this review and meta-analysis was to com-pare gestational weight gain with IOM guidelines from di-verse international cohorts and to evaluate associations be-tween gestational weight gain above and below guidelines with maternal and infant outcomes.
Methods
This systematic review, meta-analysis, and metaregression was prospectively registered with PROSPERO International Prospective Register of Systematic Reviews (PROSPERO iden-tifier CRD42015023325).
Search Strategy
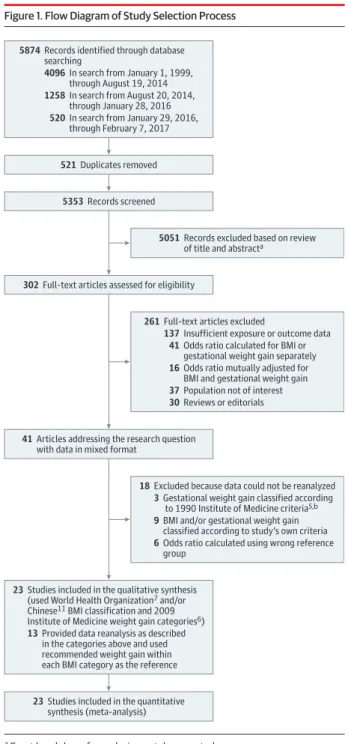
A systematic search string of relevant terms was developed (eAppendix 1 in theSupplement). Searched databases in Ovid included EMBASE, all Evidence-Based Medicine Reviews, MEDLINE, and MEDLINE In-Process from January 1, 1999, to January 28, 2016 (Figure 1). The search was limited to articles from 1999 onward to represent more current populations. The search was later updated to February 7, 2017. Of 7 newly identified studies, 4 were included in the analyses. Three studies were excluded because the data were not in the required format, and there was insufficient time to obtain data from the authors. Bibliographies of included studies were reviewed to identify additional studies. Details of the search strategy and data extraction are shown in eAppendix 2 in theSupplement.
Study Eligibility Criteria
Observational studies published in English and assessing single-ton pregnancies in women aged 18 years or older were included. Study sample sizes larger than 500 women were required to identify outcomes present across the BMI categories. We pos-tulated that small studies would have insufficient sample size to detect outcomes within each BMI group. Studies were in-cluded if they presented data examining women by prepreg-nancy BMI category, stratified by the total gestational weight gain. Studies that categorized by mean weight gain per week were excluded. Only studies presenting odds ratios (ORs) strati-fied by maternal BMI and gestational weight gain were included. Studies that simultaneously adjusted for categories of BMI and gestational weight gain to estimate the independent associa-tions of weight change with outcomes were excluded because the aim of this review was to assess the association of gestational weight gain (specific for each BMI category) and outcomes.
Studies meeting these criteria used different BMI cat-egories (eg, Metropolitan Life Insurance Tables, WHO classi-fications, or Chinese classifications11[BMI for underweight,
<18.5; normal weight, 18.5-23.9; overweight, 24-28; and obese, ≥28]) and gestational weight gain categories (eg, 1990 IOM, 2009 IOM, population-specific, or study-specific categories) to classify participants. Additionally, some studies used a ref-erence of normal gestational weight gain within each BMI group, whereas others used a reference of normal-weight women with normal weight gain.
In this review, BMI was defined by WHO categories and/or Chinese BMI categories. Gestational weight gain was defined by 2009 IOM criteria; thus, authors of identified studies were contacted to reanalyze data using these categories. The ORs were calculated using recommended gestational weight gain within each BMI category as the reference.
Gestational weight gain was defined as the difference be-tween the final weight and the prepregnancy weight and was classified as below, within, or above the 2009 IOM guide-lines. The prepregnancy weight was either self-reported (which correlates well with measured weight12,13) or measured at first
antenatal visits. Final pregnancy weight was measured at the
Key Points
QuestionWhat is the association between gestational weight
gain above or below the Institute of Medicine guidelines and maternal and infant outcomes?
FindingsIn this systematic review and meta-analysis of 1 309 136
pregnancies, gestational weight gain below recommendations (in 23% of women) was associated with higher risk of small for gestational age (odds ratio [OR], 1.53) and preterm birth (OR, 1.70) and lower risk of large for gestational age (OR, 0.59) and macrosomia (OR, 0.60). Gestational weight gain above recommendations (47%) was associated with lower risk of small for gestational age (OR, 0.66) and preterm birth (OR, 0.77) and higher risk of large for gestational age (OR, 1.85), macrosomia (OR, 1.95), and cesarean delivery (OR, 1.30).
MeaningGestational weight gain below or above the Institute of
Medicine guidelines was associated with higher risk of some adverse maternal and infant outcomes.
last antenatal visit or the time of delivery or was self-reported within 1 year of delivery.
Primary outcomes were the following: (1) SGA, indicated by birth weight less than the 10th percentile for gestational age; (2) preterm birth, indicated by spontaneous birth before 37 weeks’ gestation; and (3) LGA, indicated by birth weight greater than the 90th percentile for gestational age. Secondary out-comes were the following: (1) macrosomia, indicated by birth weight greater than 4000 g; (2) cesarean delivery; and (3) GDM. Outcomes were selected based on the original IOM studies,6
and end points were determined on a 2-round Delphi survey of experienced clinicians that was used to rank clinically im-portant outcomes in a meta-analysis of lifestyle interven-tions to reduce weight gain in pregnancy.14
Risk of Bias Appraisal
Two authors assessed risk of bias (R.F.G. and S.K.A.). Discrep-ancies were resolved by consensus in discussion with a third reviewer (M.M.). Methodological quality of included studies was assessed using the Monash Centre for Health Research and Implementation evidence synthesis appraisal assessment tool.15,16
Individual quality items were assessed using a de-scriptive approach including exposure and outcome mea-sures, reporting bias, confounding, and conflict of interest. Each study was classified as low, medium, or high risk of bias.
Data Synthesis Strategy
Findings were synthesized by target population characteris-tics, study type, and outcome. Outcome measures were pro-duced for each study by calculating ORs and 95% confidence intervals, using recommended gestational weight gain within each BMI category as the reference. When 2 or more studies assessed the same outcome, results were pooled using both fixed- and random-effects meta-analysis. There were no sig-nificant differences between fixed- and random-effects analy-ses. Random effects are presented given heterogeneity among studies. Extracted pooled ORs for individual outcomes were combined to construct summary pooled ORs. Crude data were used where possible, given variable control for confounding factors. However, some articles presented adjusted ORs only.17-24
Absolute risk differences (ARDs) per live birth were calculated from event rates (available for a subset of studies) using random-effects meta-analysis.
Heterogeneity was assessed using the I2statistic, where
I2> 50% indicated substantial heterogeneity.25
Metaregres-sion was performed to investigate sources of heterogeneity (per-centage of smokers during pregnancy, mean age, and percent-age of nulliparous women). Race/ethnicity data were not available for the metaregression. Where 5 or more studies were available, publication bias was assessed using Egger test
plots.26,27Statistical significance was defined as 2-sided P < .05.
Statistical analysis used Stata software version 14 (StataCorp LP). A subgroup analysis was performed in specific population groups identified a priori (studies using Chinese or Korean BMI categories, not presented herein). Obesity subclasses were in-cluded after reviewing studies that stratified by obesity class. Tests for trend based on the Cochran-Armitage test in Stata were used to assess trends in this subgroup analysis.
Results
Study Selection
Of 5874 studies identified by the initial search, 302 were se-lected for full-text review; 261 of these were excluded, leaving 41 (Figure 1). These studies grouped women by prepregnancy BMI category, stratified by total gestational weight gain. One study28
did not meet inclusion criteria as published; however, prior collaboration had made data available in the required format. Of 41 identified studies, 18 were excluded because data could not be obtained in the required format. Of these 18 studies, authors of 15 were contacted and unable to reanalyze and authors of 3 were not contacted from the updated search because of insufficient time prior to publica-tion (eAppendix 2 in theSupplement). Overall, 23 cohort studies17-24,28-42were included, involving 1 309 136 women.
Of these 23 studies, 7 were included without contacting the authors because data were in the required format. Of 16 au-thors contacted, 13 reanalyzed data and were included; 3 pro-vided additional information, thereby avoiding reanalysis.
Study Characteristics
Table 2 and Table 3 list characteristics of the studies (descriptive characteristics are shown in eTable 1 in the Sup-plement). Eighteen studies were retrospective, and 5 were prospective.20,29,32,33,42
Ten were from the United States,1 8 -2 0, 2 3 , 2 8,3 1 ,3 5 ,3 8, 4 0, 4 1
8 were from Asia (4 from China,21,29,32,362 from Korea,34,39and 1 each from Taiwan24and
Japan22), and 5 were from Europe (1 each from Norway,33
Belgium,30Italy,37Denmark,42and Sweden17). Sample sizes
ranged from 1034 to 570 672 women.
Underweight women composed 7% (n = 94 399); normal-weight women, 55% (n = 720 456); overnormal-weight women, 18% (n = 235 295); and obese women, 20% (n = 258 986). Gesta-tional weight gain was below, within, or above guidelines in 23% (n = 300 723), 30% (n = 387 409), and 47% (n = 621 004), respectively.
Figure 2 shows pooled ORs for primary and secondary outcomes. eFigure 1 in theSupplementshows pooled ORs for individual outcomes. eTable 2 in theSupplementreports Table 1. Recommendations for Gestational Weight Gain During Pregnancya
Recommendation
Prepregnancy Weight
Underweight Normal Weight Overweight Obese
BMI <18.5 18.5-24.9 25-29.9 ≥30
Total weight gain range, kg 12.5-18 11.5-16 7-11.5 5-9
Total weight gain range, lbs 28-40 25-35 15-25 11-20
Abbreviation: BMI, body mass index (calculated as weight in kilograms divided by height in meters squared).
a
Adapted from 2009 Institute of Medicine guidelines.6
event rates. eTable 3 and eFigure 2 in theSupplementreport ARDs and P values. The ARDs are expressed as percentage dif-ference per live birth.
Primary Outcomes
Small for Gestational AgeEleven studies assessed SGA, defined as birth weight less than the 10th percentile for gestational age in 5 studies.22,31,36,39,40
Four studies defined SGA by additionally accounting for sex,24,28,33,381 for sex and race/ethnicity,41and another for sex,
race, and parity.23
Across BMI categories, gestational weight gain below guidelines was associated with higher risk for SGA than ges-t a ges-t i o n a l w e i g h ges-t g a i n w i ges-t h i n g u i d e l i n e s ( O R , 1 . 5 3 [95% CI, 1.44 to 1.64]; I2
= 82.8%; ARD, 5% [95% CI, 4% to 6%]). This association was greatest in lower prepregnancy BMI (underweight: OR, 1.89 [95% CI, 1.67 to 2.14]; ARD, 8% [95% CI, 6% to 11%]; normal weight: OR, 1.63 [95% CI, 1.54 to 1.71]; ARD, 5% [95% CI, 4% to 6%]; overweight: OR, 1.34 [95% CI, 1.24 to 1.44]; ARD, 3% [95% CI, 3% to 4%]; and obese: OR, 1.24 [95% CI, 1.06 to 1.45]; ARD, 2% [95% CI, 2% to 3%]).
Compared with gestational weight gain within guide-lines, gain above guidelines was associated with lower risk for SGA (OR, 0.66 [95% CI, 0.63 to 0.69]; I2
= 56%; ARD, −3% [95% CI, −4% to −2%]). The association was similar across BMI cat-egories (underweight: OR, 0.62 [95% CI, 0.53 to 0.72]; ARD, −6% [95% CI, −8% to −3%]; normal weight: OR, 0.65 [95% CI, 0.62 to 0.68]; ARD, −2% [95% CI, −3% to−1%]; overweight: OR, 0.65 [95% CI, 0.59 to 0.71]; ARD, −3% [95% CI, −4% to −2%]; and obese: OR, 0.72 [95% CI, 0.65 to 0.80]; ARD, −2% [95% CI, −3% to −1%]).
Preterm Birth
Four studies assessed preterm birth (<37 weeks’ gestation). Of these, 3 did not specify whether the preterm birth was spon-taneous or induced28,31,36and 1 specified spontaneous and
in-duced combined.22
Compared with gestational weight gain within guide-lines, weight gain below guidelines was associated with higher risk for preterm birth (OR, 1.70 [95% CI, 1.32 to 2.20];
I2= 97.3%; ARD, 5% [95% CI, 3% to 8%]). This association
was greatest with lower BMI (underweight: OR, 2.41 [95% CI, 1.01 to 5.73]; ARD, 8% [95% CI, 1% to 15%]; normal weight: OR, 1.96 [95% CI, 1.17 to 3.29]; ARD, 6% [95% CI, 0% to 11%]; overweight: OR, 1.55 [95% CI, 1.10 to 2.19]; ARD, 4% [95% CI, −1% to 9%]; and obese: OR, 1.20 [95% CI, 1.03 to 1.40]; ARD, 3% [95% CI, 1% to 5%]).
Gestational weight gain above guidelines was associated with lower risk for preterm birth (OR, 0.77 [95% CI, 0.69 to 0.86]; I2= 78.7%; ARD, −2% [95% CI, −2% to −1%]). This
as-sociation was significant for normal-weight and overweight women (underweight: OR, 0.80 [95% CI, 0.50 to 1.28]; ARD, −1% [95% CI, −3% to 0%]; normal weight: OR, 0.76 [95% CI, 0.59 to 0.97]; ARD, −1% [95% CI, −2% to 0%]; overweight: OR, 0.70 [95% CI, 0.53 to 0.93]; ARD, −3% [95% CI, −5% to −1%]; and obese: OR, 0.76 [95% CI, 0.62 to 0.93]; ARD, −2% [95% CI, −5% to 2%]).
Large for Gestational Age
Thirteen studies assessed LGA, defined as birth weight greater than the 90th percentile for gestational age in 6 studies.22,31,34,36,39,40
Four defined LGA by additionally ac-counting for infant sex,24,28,33,38
1 for sex and race/ethnicity,41
1 for sex, race, and parity,23and 1 for sex, parity, and study
center.20
Figure 1. Flow Diagram of Study Selection Process
5051 Records excluded based on review
of title and abstracta
5874 Records identified through database
searching
4096 In search from January 1, 1999,
through August 19, 2014
1258 In search from August 20, 2014,
through January 28, 2016
520 In search from January 29, 2016,
through February 7, 2017
521 Duplicates removed 5353 Records screened
261 Full-text articles excluded
137 Insufficient exposure or outcome data 41 Odds ratio calculated for BMI or
gestational weight gain separately
16 Odds ratio mutually adjusted for
BMI and gestational weight gain
37 Population not of interest 30 Reviews or editorials
23 Studies included in the quantitative
synthesis (meta-analysis)
18 Excluded because data could not be reanalyzed 3 Gestational weight gain classified according
to 1990 Institute of Medicine criteria5,b
9 BMI and/or gestational weight gain
classified according to study’s own criteria
6 Odds ratio calculated using wrong reference
group
23 Studies included in the qualitative synthesis
(used World Health Organization7 and/or Chinese11 BMI classification and 2009
Institute of Medicine weight gain categories6)
13 Provided data reanalysis as described
in the categories above and used recommended weight gain within each BMI category as the reference
302 Full-text articles assessed for eligibility
41 Articles addressing the research question
with data in mixed format
aExact breakdown for exclusion not documented.
bThe Institute of Medicine 1990 guidelines differ from the 2009 guidelines. In
the 1990 guidelines, the recommended weight gain range was 12.5 to 18 kg for women with a body mass index (BMI; calculated as weight in kilograms divided by height in meters squared) less than 19.8; 11.5 to 16 kg for women with a BMI of 19.8 to 26.0; 7 to 11.5 kg for women with a BMI between 26.0 and 29.0; and at least 6.8 kg for women with a BMI higher than 29.0.
T able 2. Char ac teris tic s o f 19 Studie s T hat Str atif ied b y Prepregnanc y BMI Categ orie s a Source Study Period, Design T otal No . o f W omen Setting Outcomes Prepregnancy BMI Categor y W omen, No . No . o f E v ents/No . o f Liv e Bir ths (%) by Gestational W eight Gain Categor y b B elo w Guidelines Within Guidelines Abo v e Guidelines Durst et al , 23 2016 (United States) 2000-2014, Retrospectiv e 5651 Univ ersit y o f Alabama at Birmingham SGA , L GA , cesarean deliv er y, macrosomia Ov er w eight 5651 NR NR NR E nomoto etal , 22 2016 (Japan) 2013, Retrospectiv e 97 157 Japan Societ y of Obstetrics and Gynecology R egistr y system with 280 par ticipating hospitals SGA Under w eight 17 724 2032/13 529 (15.0) 286/3783 (7.6) 23/412 (5.6) Normal w eight 69 126 4575/44 189 (10.4) 1254/20 835 (6.0) 163/4102 (4.0) Ov er w eight 7502 275/2990 (9.2) 179/2810 (6.4) 89/1702 (5.2) Obese 2805 112/1297 (8.6) 48/853 (5.6) 38/655 (5.8) L G A Under w eight 17 724 518/13 529 (3.8) 388/3783 (10.3) 61/412 (14.8) Normal w eight 69 126 3322/44 189 (7.5) 2754/20 835 (13.2) 868/4102 (21.1) Ov er w eight 7502 363/2990 (12.1) 489/2810 (17.4) 450/1702 (26.4) Obese 2805 213/1297 (16.4) 206/853 (24.2) 215/655 (32.8) Preterm bir th Under w eight 17 724 1979/13 529 (14.6) 167/3783 (4.4) 8/412 (1.9) Normal w eight 69 126 5891/44 189 (13.3) 994/20 835 (4.8) 178/4102 (4.3) Ov er w eight 7502 508/2990 (17.0) 240/2810 (8.5) 125/1702 (7.3) Obese 2805 199/1297 (15.3) 95/853 (11.1) 44/655 (6.7) Cesarean deliv er y Under w eight 17 724 3174/13 539 (23.4) 739/3783 (19.5) 82/412 (19.9) Normal w eight 69 126 12 446/44 189 (28.2) 5062/20 835 (24.3) 1119/4102 (27.3) Ov er w eight 7502 1151/2990 (38.5) 991/2810 (35.3) 617/1702 (36.3) Obese 2805 542/1297 (41.8) 367/853 (43.0) 296/655 (45.2) Macrosomia Under w eight 17 724 16/13 529 (0.1) 20/3783 (0.5) 11/412 (2.7) Normal w eight 69 126 149/44 189 (0.3) 214/20 835 (1.0) 111/4102 (2.7) Ov er w eight 7502 34/2990 (1.1) 35/2810 (1.3) 63/1702 (3.7) Obese 2805 21/1297 (1.6) 37/853 (4.3) 37/655 (5.7) (con tinued)
T able 2. Char ac teris tic s o f 19 Studie s T hat Str atif ied b y Prepregnanc y BMI Categ orie s a(continued) Source Study Period, Design T otal No . o f W omen Setting Outcomes Prepregnancy BMI Categor y W omen, No . No . o f E v ents/No . o f Liv e Bir ths (%) by Gestational W eight Gain Categor y b B elo w Guidelines Within Guidelines Abo v e Guidelines Hung and Hsieh, 24 2016 (T aiw an) 2009-2015, Retrospectiv e 10 973 T aipei Chang Gung Memorial Hospital SGA Under w eight 1556 117/691 (16.9) 63/718 (8.8) 10/147 (6.8) Normal w eight 8247 199/2304 (8.7) 233/3827 (6.1) 90/2116 (4.3) Ov er w eight + obese 1170 121/161 (75.2) 23/403 (5.7) 24/606 (4.0) L G A Under w eight 1556 8/691 (1.2) 34/718 (4.7) 18/147 (12.2) Normal w eight 8247 103/2304 (4.5) 306/3827 (8.0) 274/2116 (12.9) Ov er w eight + obese 1170 18/161 (11.2) 61/403 (15.1) 107/606 (17.7) Cesarean deliv er y Under w eight 1556 143/691 (20.7) 151/718 (21.0) 54/147 (36.7) Normal w eight 8247 412/2304 (17.9) 882/3827 (23.1) 644/2116 (30.4) Ov er w eight + obese 1170 34/161 (21.1) 89/403 (22.1) 197/606 (32.5) Macrosomia Under w eight 1556 3/691 (0.4) 4/718 (0.6) 5/147 (3.4) Normal w eight 8247 17/2304 (0.7) 63/3827 (1.7) 74/2116 (3.5) Ov er w eight + obese 1170 6/161 (3.7) 9/403 (2.2) 30/606 (5.0) Xiong et al , 29 2016 (China) c 2012-2013, Prospectiv e 57 891 Hospitals and communit y centers Cesarean deliv er y Under w eight 10 121 NR NR NR Normal w eight 44 522 Ov er w eight 2877 Obese 371 Shin and Song, 31 2015 (United States) 2004-2011, Retrospectiv e 219 868 Pregnancy Risk Assessment Monitoring S ystem SGA , preterm bir th, LG A Under w eight 11 865 NR NR NR Normal w eight 113 523 Ov er w eight 51 517 Obese 42 963 W e n and L v , 21 2015 (China) c 2009-2013, Retrospectiv e 13 776 Jishuitan Hospital Preterm bir th Under w eight 0 NR NR NR Normal w eight 13 776 Ov er w eight 0 Obese 0 Y ang et al , 32 2015 (China) c 2011-2013, Prospectiv e 85 765 W uhan W omen and Children Health Care Center Macrosomia Under w eight 14 477 13/158 (8.2) 93/4723 (2.0) 449/7139 (6.3) Normal w eight 65 536 361/11627 (3.1) 623/14 103 (4.4) 3387/33 647 (10.1) Ov er w eight + obese 5752 35/573 (6.1) 79/982 (8.0) 551/3299 (16.7) Badon et al , 20 2014 (United States) 2000-2006, Prospectiv e 5297 Nor th American Field Centers, HAPO Study L G A Under w eight 179 NR NR NR Normal w eight 3013 Ov er w eight 1322 Obese 783 (con tinued)
T able 2. Char ac teris tic s o f 19 Studie s T hat Str atif ied b y Prepregnanc y BMI Categ orie s a(continued) Source Study Period, Design T otal No . o f W omen Setting Outcomes Prepregnancy BMI Categor y W omen, No . No . o f E v ents/No . o f Liv e Bir ths (%) by Gestational W eight Gain Categor y b B elo w Guidelines Within Guidelines Abo v e Guidelines Chihar a e t a l, 19 2014 (United States) 2003-2005, Retrospectiv e 19 130 Haw aii’ s Special Supplemental Nutrition Progr am for W omen, Infants, and Children Macrosomia Under w eight 1153 NR NR NR Normal w eight 9291 Ov er w eight 4391 Obese 4295 Haugen et al , 33 2014 (Nor w ay) d 1999-2008, Prospectiv e 56 082 Nor w egian Mother and Child Cohor t Study SGA Under w eight 1610 143/457 (31.3) 144/751 (19.2) 37/402 (9.2) Normal w eight 37 315 1327/7798 (17.0) 1662/14 904 (11.2) 1042/14 613 (7.1) Ov er w eight 12 181 156/1037 (15.0) 281/2485 (11.3) 557/8659 (6.4) Obese 4976 97/878 (11.1) 99/1054 (9.4) 204/3044 (6.7) L G A Under w eight 1610 4/457 (0.9) 21/751 (2.8) 30/402 (7.5) Normal w eight 37 315 250/7798 (3.2) 914/14 904 (6.1) 1796/14 613 (12.3) Ov er w eight 12 181 62/1037 (6.0) 212/2485 (8.5) 1370/8659 (15.8) Obese 4976 90/878 (10.3) 154/1054 (14.6) 676/3044 (22.2) Cesarean deliv er y Under w eight 1610 44/457 (9.6) 71/751 (9.5) 47/402 (11.7) Normal w eight 37 315 726/7798 (9.3) 1526/14 904 (10.2) 1836/14 613 (12.6) Ov er w eight 12 181 137/1037 (13.2) 327/2485 (13.2) 1439/8659 (16.6) Obese 4976 173/878 (19.7) 227/1054 (21.5) 703/3044 (23.1) Macrosomia Under w eight 1610 15/457 (3.3) 68/751 (9.1) 62/402 (15.4) Normal w eight 37 315 782/7798 (10.0) 2573/14 904 (17.3) 4014/14 613 (27.5) Ov er w eight 12 181 160/1037 (15.4) 530/2485 (21.3) 2472/8659 (28.5) Obese 4976 206/878 (23.5) 300/1054 (28.5) 1822/3044 (59.9) Lee et al , 34 2014 (K orea) e 2010-2012, Retrospectiv e 16 297 Single medical center L G A Under w eight 2655 NR NR NR Normal w eight 12 250 Ov er w eight 1191 Obese 201 (con tinued)
T able 2. Char ac teris tic s o f 19 Studie s T hat Str atif ied b y Prepregnanc y BMI Categ orie s a(continued) Source Study Period, Design T otal No . o f W omen Setting Outcomes Prepregnancy BMI Categor y W omen, No . No . o f E v ents/No . o f Liv e Bir ths (%) by Gestational W eight Gain Categor y b B elo w Guidelines Within Guidelines Abo v e Guidelines Black et al , 28 2013 (United States) 2005-2010, Retrospectiv e 9835 Kaiser Permanente Southern California SGA Under w eight 179 11/55 (20.0) 9/75 (12.0) 3/51 (5.9) Normal w eight 3805 158/1031 (15.3) 125/1388 (9.0) 114/1386 (8.2) Ov er w eight 3116 58/424 (13.7) 70/815 (8.6) 119/1877 (6.3) Obese 2735 57/608 (9.4) 54/648 (8.3) 80/1479 (5.4) L G A Under w eight 179 0/55 4/73 (5.5) 2/51 (3.9) Normal w eight 3805 2/1031 (0.2) 46/1388 (3.3) 113/1386 (8.2) Ov er w eight 3116 15/424 (3.5) 39/815 (4.8) 205/1877 (10.9) Obese 2735 32/608 (5.3) 52/648 (8.0) 235/1479 (15.9) Preterm bir th Under w eight 179 10/55 (18.2) 2/73 (2.7) 1/51 (2.0) Normal w eight 3805 127/1031 (12.3) 77/1388 (5.5) 45/1386 (3.2) Ov er w eight 3116 54/424 (12.7) 76/815 (9.3) 87/1877 (4.6) Obese 2735 53/608 (8.7) 49/648 (7.6) 80/1479 (5.4) Cesarean deliv er y Under w eight 179 6/55 (10.9) 14/73 (19.2) 13/51 (25.5) Normal w eight 3805 219/1031 (21.2) 293/1388 (21.1) 339/1386 (24.5) Ov er w eight 3116 105/424 (24.8) 200/815 (24.5) 589/1877 (31.4) Obese 2735 184/608 (30.3) 216/648 (33.3) 575/1479 (38.9) Macrosomia Under w eight 179 0/55 5/73 (6.8) 3/51 (5.9) Normal w eight 3805 28/1031 (2.7) 63/1388 (4.5) 148/1386 (10.7) Ov er w eight 3116 17/424 (4.0) 46/815 (5.6) 225/1877 (12.0) Obese 2735 38/608 (6.3) 65/648 (10.0) 265/1479 (17.9) (con tinued)
T able 2. Char ac teris tic s o f 19 Studie s T hat Str atif ied b y Prepregnanc y BMI Categ orie s a(continued) Source Study Period, Design T otal No . o f W omen Setting Outcomes Prepregnancy BMI Categor y W omen, No . No . o f E v ents/No . o f Liv e Bir ths (%) by Gestational W eight Gain Categor y b B elo w Guidelines Within Guidelines Abo v e Guidelines Li et al , 36 2013 (China) f 2009-2011, Retrospectiv e 33 973 Tianjin W omen’ s and Children’ s Health Center SGA Under w eight 3732 151/733 (20.6) 323/1820 (17.7) 114/1179 (9.7) Normal w eight 24 262 383/2777 (13.8) 817/9347 (8.7) 935/12 138 (7.7) Ov er w eight 4998 6/86 (7.0) 54/665 (8.1) 277/4247 (6.5) Obese 981 1/16 (6.3) 6/54 (11.1) 44/911 (4.8) L G A Under w eight 3732 15/733 (2.0) 49/1820 (2.7) 77/1179 (6.5) Normal w eight 24 262 15/2777 (0.5) 625/9347 (6.7) 1549/12 138 (12.8) Ov er w eight 4998 32/86 (37.2) 86/665 (12.9) 741/4247 (17.4) Obese 981 4/16 (25.0) 10/54 (18.5) 228/911 (25.0) Preterm bir th Under w eight 3732 31/733 (4.2) 45/1820 (2.5) 22/1179 (1.9) Normal w eight 24 262 142/2777 (5.1) 322/9347 (3.4) 248/12 138 (2.0) Ov er w eight 4998 5/86 (5.8) 37/665 (5.6) 134/4247 (3.2) Obese 981 1/16 (6.3) 2/54 (3.7) 61/911 (6.7) Cesarean deliv er y Under w eight 3732 375/733 (51.2) 945/1820 (51.9) 723/1179 (61.3) Normal w eight 24 262 1677/2777 (60.4) 5645/9347 (60.4) 8208/12 138 (67.6) Ov er w eight 4998 62/86 (72.1) 480/665 (72.2) 3348/4247 (78.8) Obese 981 11/16 (68.8) 50/54 (92.6) 774/911 (85.0) Macrosomia Under w eight 3732 141/733 (19.2) 53/1820 (2.9) 751/1179 (63.7) Normal w eight 24 262 145/2777 (5.2) 581/9347 (6.2) 1464/12 138 (12.1) Ov er w eight 4998 6/86 (7.0) 71/665 (10.7) 687/4247 (16.2) Obese 981 4/16 (25.0) 9/54 (16.7) 203/911 (22.3) Di B enedetto et al , 37 2012 (Italy) 2004-2009, Retrospectiv e 2225 Univ ersit y hospital Macrosomia, cesarean deliv er y Under w eight 89 NR NR NR Normal w eight 1468 Ov er w eight 493 Obese 175 Simas et al , 38 2012 (United States) 2006-2010, Retrospectiv e 11 203 Univ ersit y hospital SGA , L GA Under w eight 427 NR NR NR Normal w eight 5707 Ov er w eight 2756 Obese 2313 Park et al , 39 2011 (K orea) e 2005-2007, Retrospectiv e 2311 Univ ersit y hospital SGA , L GA , macrosomia, cesarean deliv er y Under w eight 385 NR NR NR Normal w eight 1666 Ov er w eight 221 Obese 39 (con tinued)
T able 2. Char ac teris tic s o f 19 Studie s T hat Str atif ied b y Prepregnanc y BMI Categ orie s a(continued) Source Study Period, Design T otal No . o f W omen Setting Outcomes Prepregnancy BMI Categor y W omen, No . No . o f E v ents/No . o f Liv e Bir ths (%) by Gestational W eight Gain Categor y b B elo w Guidelines Within Guidelines Abo v e Guidelines Park et al , 40 2011 (United States) 2004-2007, Retrospectiv e 560 672 Florida bir th cer tificate data SGA Under w eight 28 119 1987/7555 (26.3) 1815/11 676 (15.5) 865/8888 (9.7) Normal w eight 305 295 11 213/71 025 (15.8) 10 324/103 613 (10.0) 8460/130 657 (6.5) Ov er w eight 135 668 2167/16 723 (13.0) 3033/30 731 (9.9) 5516/88 214 (6.3) Obese 101 590 2157/19 740 (10.9) 1501/17 350 (8.7) 4147/64 500 (6.4) L G A Under w eight 28 119 84/7555 (1.1) 366/11 676 (3.1) 669/8888 (7.5) Normal w eight 305 295 2479/71 025 (3.5) 6183/103 613 (6.0) 15 146/130 657 (11.6) Ov er w eight 135 668 851/16 723 (5.1) 2329/30 731 (7.6) 12 417/88 214 (14.1) Obese 101 590 16 571/19 740 (83.9) 1906/17 350 (11.0) 10 794/64 500 (16.7) V esco et al , 41 2011 (United States) 2000-2005, Retrospectiv e 2080 Kaiser Permanente group pr actice SGA , L GA , macrosomia Under w eight 0 NR NR NR Normal w eight 0 Ov er w eight 0 Obese 2080 R ode et al , 42 2007 (Denmark) 1996-1998, Prospectiv e 2248 Univ ersit y hospital Macrosomia Under w eight 128 NR NR NR Normal w eight 1654 Ov er w eight 349 Obese 117 Abbre viations: BMI, body mass inde x (calculated as w eight in kilogr ams divided b y height in me ters squared); HAP O ,Hypergly cemia and Adv erse Pregnanc y Outcome; L G A ,large fo r g e stational a ge; NR ,not repor ted; SGA , small fo r g e stational a g e . aUnle ss indicated other wise ,prepregnanc y categorie s o f BMI categorie s w ere accordin g to W orld Health Organization (WHO) categorie s a s follo ws: BMI fo r under w eight ,l e ss than 18 .5; normal w eight ,1 8 .5 to 2 4 .9; o v e rw eight ,2 5 to 2 9 .9; and obe se ,3 0 o r higher . bR e fe r to e F igure 1 in the Supplement fo r odds ratios. cD ata accordin g to Chine se BMI categorie s only (BMI fo r under w eight ,<18 .5; normal w eight ,1 8 .5-23 .9 ; o v e rw eight ,2 4-28; and obe se ,ⱖ 28). dSample siz e chan ged when additional data w ere pro vided. eD ata accordin g to both K orean BMI categorie s (BMI fo r under w eight ,<18 .5; normal w eight ,1 8 .5-22. 9; o v e rw eight ,23-25; and obe se ⱖ 25) and WHO BMI categorie s (WHO repor ted herein). fD ata accordin g to both Chine se and WHO BMI categorie s (WHO repor ted herein).
T able 3 .Char ac teris tic s o f 4 Studie s T hat Str atif ied b y Prepregnanc y Obe sit y Class Source Study Period, Design T otal No . of W omen Setting Outcomes Prepregnancy Obesit y Class a W omen, No . No . o f E v ents/No . o f Liv e Bir ths (%) by Gestational W eight Gain Categor y Loss Gain B elo w Guidelines Gain Within Guidelines Gain Abo v e Guidelines B ogaer ts et al , 30 2015 (B elgium) 2009-2011, Retrospectiv e 18 053 Flemish Centre for the Study of Perinatal E pidemiology SGA 1 1 2 994 52/420 (12.4) 164/1554 (10.6) 316/3585 (8.8) 421/7435 (5.7) 2 3787 32/263 (12.2) 54/648 (8.3) 80/1156 (6.9) 95/1720 (5.5) 3 1272 16/171 (9.4) 1 6/291 (5.5) 22/379 (5.8) 20/431 (4.6) L G A 1 12 994 29/420 (6.9) 1 52/1554 (9.8) 474/3585 (13.2) 1468/7438 (19.7) 2 3787 28/263 (10.6) 78/648 (12.0) 189/1156 (16.3) 409/1720 (23.8) 3 1272 19/171 (11.1) 59/291 (20.3) 97/379 (25.6) 122/431 (28.3) Cesarean deliv er y 1 1 2 994 101/420 (24.0) 353/1554 (22.7) 844/3585 (23.5) 2020/7435 (27.2) 2 3787 65/263 (24.7) 153/648 (23.6) 344/1156 (29.8) 561/1720 (32.6) 3 1272 61/171 (35.7) 98/291 (33.7) 132/379 (34.8) 168/431 (39.0) Macrosomia 1 1 2 994 29/420 (6.9) 1 55/1554 (10.0) 435/3585 (12.1) 1384/7435 (18.6) 2 3787 23/263 (8.7) 7 6/648 (11.7) 165/1156 (14.3) 366/1720 (21.3) 3 1272 11/171 (6.4) 4 9/291 (16.8) 89/379 (23.5) 100/431 (23.2) S w ank et al , 35 2014 (United States) 2007, Retrospectiv e 1034 California bir th cer tificate data Cesarean deliv er y 3 1034 96/170 (56.5) 134/226 (59.3) 139/243 (57.2) 253/395 (64.1) Macrosomia 3 1034 14/170 (8.2) 3 5/226 (15.5) 52/243 (21.4) 104/395 (26.3) K ominiarek etal , 18 2013 (United States) b 2002-2008, Retrospectiv e 21 020 12 Institutions (19 hospitals) SGA 1 1 2 005 66/406 (16.3) 135/1352 (10.0) 187/1931 (9.7) 549/8316 (6.6) 2 5320 57/354 (16.1) 100/918 (10.9) 85/1018 (8.3) 193/3030 (6.4) 3 3695 57/486 (11.7) 72/748 (10.4) 51/664 (7.7) 119/1797 (6.6) L G A 1 12 005 13/406 (3.2) 7 6/1352 (5.6) 119/1931 (6.2) 1029/8316 (12.4) 2 5320 17/354 (4.8) 6 7/918 (7.3) 101/1018 (9.9) 435/3030 (14.4) 3 3695 31/486 (6.4) 7 7/748 (10.3) 85/664 (12.8) 315/1797 (17.5) Cesarean deliv er y 1 1 2 005 64/406 (15.8) 292/1352 (21.6) 425/1931 (22.0) 1816/8316 (21.8) 2 5320 86/354 (24.3) 237/918 (25.8) 277/1018 (27.2) 754/3030 (24.9) 3 3695 144/486 (29.6) 222/748 (29.7) 233/664 (35.1) 562/1797 (31.3) Macrosomia 1 1 2 005 2/406 (0.5) 7/1352 (0.5) 15/1931 (0.8) 191/8316 (2.3) 2 5320 1/354 (0.3) 8/918 (0.9) 13/1018 (1.3) 87/3030 (2.9) 3 3695 7/486 (1.4) 11/748 (1.5) 19/664 (2.9) 66/1797 (3.7) Blomberg, 17 2011 (Sw eden) 1993-2008, Retrospectiv e 46 595 S w edish Medical Bir th R egister SGA 1 3 2 991 51/1341 (3.8) 88/3105 (2.8) 162/8807 (1.8) 232/19 738 (1.2) 2 1 0 068 13/798 (1.6) 4 0/1466 (2.7) 58/2927 (2.0) 70/4877 (1.4) 3 3536 19/517 (3.7) 1 6/616 (2.6) 17/1002 (1.7) 27/1401 (1.9) L G A 1 32 991 87/1341 (6.5) 228/3105 (7.3) 757/8807 (8.6) 2674/19 738 (13.5) 2 1 0 068 57/798 (7.1) 1 42/1466 (9.7) 361/2927 (12.3) 853/4877 (17.5) 3 3536 57/517 (11.0) 88/616 (14.3) 155/1002 (15.5) 278/1401 (19.8) Cesarean deliv er y 1 32 991 206/1341 (15.4) 554/3105 (17.8) 1675/8807 (19.0) 4431/19 738 (22.4) 2 1 0 068 135/798 (16.9) 306/1466 (20.9) 713/2927 (24.4) 1312/4877 (26.9) 3 3536 125/517 (24.2) 148/616 (24.0) 289/1002 (28.8) 439/1401 (31.3) Abbre viations: L G A ,large fo r g e stational a ge; SGA ,small fo r g e stational a g e . aClass 1 indicate s a body mass inde x (BMI; calculated as w eight in kilogr ams divided b y height in me ters squared) of 30 to 34 .9 ;class 2, BMI of 35 to 3 9 .9 ;a nd class 3 ,BMI of 40 or higher . bSample siz e chan ged when additional data w ere pro vided, and the odds ratios w ere not recalculated.
Figure 2. Summary of Pooled Odds Ratios (ORs) for the Association Between Gestational Weight Gain Below and Above Guidelines With Adverse Outcomes
Below recommended gestational weight gain A I2, % Decreased Odds of Outcome Increased Odds of Outcome 0.2 1.0 5.0 OR (95% CI) Outcomes by BMI category SGA 11 1 019 805 OR (95% CI) 62.0 <18.5 9 28 551 1.89 (1.67-2.14) 61.6 18.5-24.9 9 162 331 1.63 (1.54-1.71) 15.5 25-29.9 9 27 634 1.34 (1.24-1.44) 49.7 ≥30 9 31 526 1.24 (1.06-1.45) 82.8 Overall 1.53 (1.44-1.64) Preterm birth 4 360 833 97.3 <18.5 4 19 941 2.41 (1.01-5.73) 99.0 18.5-24.9 4 79 537 1.96 (1.17-3.29) 86.5 25-29.9 4 6681 1.55 (1.10-2.19) 23.3 ≥30 4 8598 1.20 (1.03-1.40) 97.3 Overall 1.70 (1.32-2.20) LGA 13 1 041 399 44.2 <18.5 9 29 596 0.41 (0.34-0.50) 60.1 18.5-24.9 11 166 212 0.58 (0.54-0.62) 0 25-29.9 11 27 899 0.66 (0.62-0.70) 16.7 ≥30 12 31 675 0.70 (0.64-0.76) 78.9 Overall 0.59 (0.55-0.64) Macrosomia 11 241 665 42.0 <18.5 7 15 617 0.43 (0.27-0.69) 82.6 18.5-24.9 9 59 503 0.54 (0.43-0.68) 11.3 25-29.9 9 4935 0.73 (0.60-0.89) 10.8 ≥30 9 4740 0.70 (0.59-0.82) 66.3 Overall 0.60 (0.52-0.68) Cesarean delivery 8 218 207 40.8 <18.5 7 15 645 1.08 (0.94-1.26) 85.1 18.5-24.9 7 59 100 0.95 (0.84-1.06) 0 25-29.9 7 2186 1.07 (0.98-1.16) 20.7 ≥30 7 4336 0.89 (0.79-1.01)
Above recommended gestational weight gain B I2, % Decreased Odds of Outcome Increased Odds of Outcome 0.2 1.0 5.0 OR (95% CI) Outcomes by BMI category SGA 11 1 019 805 OR (95% CI) 44.5 <18.5 9 13 711 0.62 (0.53-0.72) 34.6 18.5-24.9 9 88 780 0.65 (0.62-0.68) 45.0 25-29.9 9 110 665 0.65 (0.59-0.71) 35.4 ≥30 10 103 820 0.72 (0.65-0.80) 55.6 Overall 0.66 (0.63-0.69) Preterm birth 4 360 833 61.2 <18.5 4 4063 0.80 (0.50-1.28) 90.4 18.5-24.9 4 60 324 0.76 (0.59-0.97) 83.5 25-29.9 4 11 162 0.70 (0.53-0.93) 40.8 ≥30 4 30 809 0.76 (0.62-0.93) 78.7 Overall 0.77 (0.69-0.86) LGA 13 1 041 399 40.7 <18.5 10 13 978 2.17 (1.81-2.60) 70.4 18.5-24.9 11 215 994 1.95 (1.83-2.08) 66.4 25-29.9 11 142 236 1.79 (1.61-1.98) 0 ≥30 11 104 459 1.63 (1.56-1.70) 74.6 Overall 1.85 (1.76-1.95) Macrosomia 11 241 665 41.9 <18.5 7 2214 2.31 (1.62-3.29) 71.0 18.5-24.9 9 35 928 2.01 (1.77-2.27) 60.2 25-29.9 9 17 627 1.90 (1.54-2.33) 52.1 ≥30 9 1035 1.83 (1.52-2.22) 58.2 Overall 1.95 (1.79-2.11) Cesarean delivery 8 218 207 24.0 <18.5 7 2227 1.45 (1.22-1.71) 23.5 18.5-24.9 7 35 416 1.30 (1.24-1.36) 0 25-29.9 7 17 419 1.29 (1.21-1.39) 46.3 ≥30 7 9012 1.22 (1.05-1.42) 21.9 Overall 1.30 (1.25-1.35) 62.6 Overall 0.98 (0.96-1.02) Studies, No. Women, No. Studies, No. Women, No.
Pooled ORs are shown for the association between gestational weight gain below (A) and above (B) guidelines with adverse outcomes. Reference group is women with recommended weight gain in each category of body mass index (BMI; calculated as weight in kilograms divided by height in meters squared). For each outcome, the sample size represents the total number of women in the studies that assessed the outcome. For each BMI category, the sample size represents the total number of women with gestational weight gain below or above the guidelines. LGA indicates large for gestational age; SGA, small for gestational age.
Gestational weight gain below guidelines was associated with lower risk of LGA than gestational weight gain within guidelines (OR, 0.59 [95% CI, 0.55 to 0.64]; I2
= 78.9%; ARD, −2% [95% CI, −10% to −6%]). This was significant for under-weight and normal-under-weight women (underunder-weight: OR, 0.41 [95% CI, 0.34 to 0.50]; ARD, −3% [95% CI, −5% to −1%]; nor-mal weight: OR, 0.58 [95% CI, 0.54-0.62]; ARD, −3% [95% CI, −4% to −2%]; overweight: OR, 0.66 [95% CI, 0.62 to 0.70]; ARD, −11% [95% CI, −33% to 10%]; and obese: OR, 0.70 [95% CI, 0.64 to 0.76]; ARD, 13% [95% CI, −34% to 60%]).
Gestational weight gain above guidelines was associated with higher risk of LGA (OR, 1.85 [95% CI, 1.76 to 1.95];
I2
= 74.6%; ARD, 4% [95% CI, 2% to 5%]). The association in-creased as BMI dein-creased (underweight: OR, 2.17 [95% CI, 1.81 to 2.60]; ARD, 4% [95% CI, 4% to 5%]; normal weight: OR, 1.95 [95% CI, 1.83 to 2.08]; ARD, 6% [95% CI, 5% to 7%]; over-weight: OR, 1.79 [95% CI, 1.61 to 1.98]; ARD, −2% [95% CI, −14% to 9%]; and obese: OR, 1.63 [95% CI, 1.56 to 1.70]; ARD, 7% [95% CI, 5% to 8%]).
Secondary Outcomes
MacrosomiaOf 11 studies assessing macrosomia, 10 defined macrosomia as birth weight greater than 4000 g,19,22-24,28,33,36,37,39,42and
1 defined it as birth weight greater than 4500 g.41
Gestational weight gain below guidelines was associated with lower risk of macrosomia (OR, 0.60 [95% CI, 0.52 to 0.68];
I2= 66.3%; ARD, −2% [95% CI, −3% to −1%]). The association
was strongest in underweight women (underweight: OR, 0.43 [95% CI, 0.27 to 0.69]; ARD, −1% [95% CI, −3% to 0%]; nor-mal weight: OR, 0.54 [95% CI, 0.43 to 0.68]; ARD, −2% [95% CI, −5% to 1%]; overweight: OR, 0.73 [95% CI, 0.60 to 0.89]; ARD, −2% [95% CI, −6% to 2%]; and obese: OR, 0.70 [95% CI, 0.59 to 0.82]; ARD, −3% [−4% to −2%]).
Gestational weight gain above guidelines was associated with higher risk of macrosomia (OR, 1.95 [95% CI, 1.79 to 2.11]; I2
= 58.2%; ARD, 6% [95% CI, 4% to 9%]). This associa-tion was strongest in underweight women according to the ORs, and all associations were significant according to the ARDs (underweight: OR, 2.31 [95% CI, 1.62 to 3.29]; ARD, 3% [95% CI, 2% to 4%]; normal weight: OR, 2.01 [95% CI, 1.77 to 2.27]; ARD, 10% [95% CI, 5% to 15%]; overweight: OR, 1.90 [95% CI, 1.54 to 2.33]; ARD, 5% [95% CI, 1% to 10%]; and obese: OR, 1.83 [95% CI, 1.52 to 2.22]; ARD, 6% [95% CI, 1% to 12%]).
Cesarean Delivery
Eight studies assessed cesarean delivery. Seven included emer-gency and elective deliveries,22,28,29,33,36,37,39and 1 did not
specify.24
One study28
included repeated cesarean delivery (total cesarean deliveries), 1 included primary cesarean deliv-ery only,24and 6 did not distinguish these.
Gestational weight gain below guidelines was not signifi-cantly associated with cesarean delivery (OR, 0.98 [95% CI, 0.96 to 1.02]; I2
= 62.6%; ARD, 0% [−2% to 1%]).
Gestational weight gain above guidelines was associated with higher risk of cesarean delivery (OR, 1.30 [95 CI, 1.25 to 1.35]; I2= 21.9%; ARD, 4% [95% CI, 3% to 6%]). The ARD was
significant for underweight women only (underweight: OR, 1.45 [95% CI, 1.22 to 1.71]; ARD, 6% [95% CI, 1% to 12%]; nor-mal weight: OR, 1.30 [95% CI, 1.24 to 1.36]; ARD, 0% [95% CI, −4% to 3%]; overweight: OR, 1.29 [95% CI, 1.21 to 1.39]; ARD, 1% [0% to 3%]; and obese: OR, 1.22 [95% CI, 1.05 to 1.42]; ARD, −2% [95% CI, −5% to 1%]).
Gestational Diabetes Mellitus
Six studies assessed GDM, but they did not use consistent definitions and had different findings for gestational weight gain above guidelines and GDM risk. Black et al28defined
GDM by International Association of Diabetes in Pregnancy Study Groups criteria and included only women not treated for hyperglycemia (the center used different criteria in clini-cal practice and excluded those treated). They found no association between weight gain above guidelines and GDM in the underweight, normal-weight, and obese groups but reported lower risk in overweight women. Enomoto et al22
used International Association of Diabetes in Pregnancy Study Groups criteria, with higher risk in normal-weight women and lower risk in overweight women. Durst et al23
used Carpenter-Coustan criteria and found no association. Hung and Hsieh24
used Carpenter-Coustan and Interna-tional Association of Diabetes in Pregnancy Study Groups criteria and found an association of gestational weight gain above guidelines with lower risk of GDM in overweight and obese women. Li et al36
included both impaired glucose tol-erance and type 2 diabetes by WHO criteria, with weight gain above guidelines associated with lower risk of GDM in all groups except obese women. Shin and Song31used
self-reported GDM and found an association of gestational weight gain above guidelines with lower risk in all groups except underweight women.
An intended meta-analysis of gestational weight gain and its relationship to GDM could not be completed because of in-consistent definitions and treatments.
Obese Subgroup Analysis Stratified by Obesity Class
Obesity classes include the following: class 1, BMI of 30 to 34.9; class 2, BMI of 35 to 39.9; and class 3, BMI of 40 or higher. Obese studies generally included a subgroup-defined weight loss as well as gestational weight gain below, within, or above guidelines. Three studies assessed outcomes strati-fied by BMI classes 1 through 3.17,18,30Another study35inves-tigated only superobese women (BMI ≥50) and was included in the obesity class 3 analysis. These 4 studies were included in the subgroup analysis only (not in the overall meta-analyses). Class 1 included 67% of women; class 2, 22%; and class 3, 11%. Weight loss and gestational weight gain below, within, or above recommendations occurred in 6%, 13%, 25%, and 57% of pregnancies, respectively.
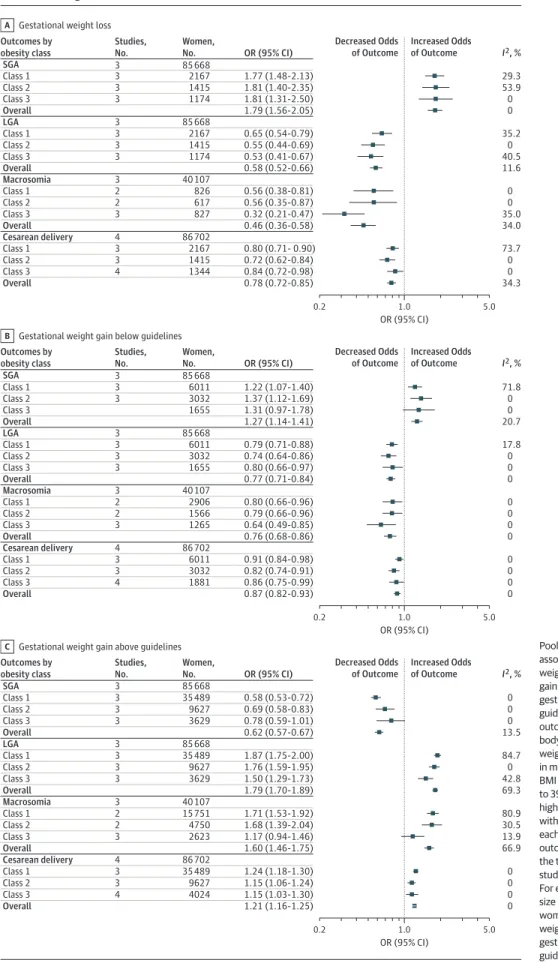
Figure 3 summarizes pooled ORs for primary (SGA and LGA) and secondary (macrosomia and cesarean delivery) outcomes. eFigure 3 in theSupplementshows pooled ORs for individual outcomes. eTable 4 in theSupplementreports ARDs and P values. Only 1 study35
assessed preterm birth and GDM in the obese subgroups, preventing meta-analysis. Kominiarek et al18provided separate ORs for nulliparous
Figure 3. Obese Subgroup Analysis With Summary of Pooled Odds Ratios (ORs) for the Association Between Gestational Weight Loss, Gain Below Guidelines, and Gain Above Guidelines With Adverse Outcomes
Gestational weight loss A I2, % Decreased Odds of Outcome Increased Odds of Outcome 0.2 1.0 5.0 OR (95% CI) Outcomes by obesity class Studies, No. Women, No. SGA 3 85 668 OR (95% CI) 29.3 Class 1 3 2167 1.77 (1.48-2.13) 53.9 Class 2 3 1415 1.81 (1.40-2.35) 0 Class 3 3 1174 1.81 (1.31-2.50) 0 Overall 1.79 (1.56-2.05) LGA 3 85 668 35.2 Class 1 3 2167 0.65 (0.54-0.79) 0 Class 2 3 1415 0.55 (0.44-0.69) 40.5 Class 3 3 1174 0.53 (0.41-0.67) 11.6 Overall 0.58 (0.52-0.66) Macrosomia 3 40 107 0 Class 1 2 826 0.56 (0.38-0.81) 0 Class 2 2 617 0.56 (0.35-0.87) 35.0 Class 3 3 827 0.32 (0.21-0.47) 34.0 Overall 0.46 (0.36-0.58) Cesarean delivery 4 86 702 73.7 Class 1 3 2167 0.80 (0.71- 0.90) 0 Class 2 3 1415 0.72 (0.62-0.84) 0 Class 3 4 1344 0.84 (0.72-0.98) 34.3 Overall 0.78 (0.72-0.85) Studies, No. Women, No. Gestational weight gain below guidelines B I2, % Decreased Odds of Outcome Increased Odds of Outcome 0.2 1.0 5.0 OR (95% CI) Outcomes by obesity class SGA 3 85 668 OR (95% CI) 71.8 Class 1 3 6011 1.22 (1.07-1.40) 0 Class 2 3 3032 1.37 (1.12-1.69) 0 Class 3 1655 1.31 (0.97-1.78) 20.7 Overall 1.27 (1.14-1.41) LGA 3 85 668 17.8 Class 1 3 6011 0.79 (0.71-0.88) 0 Class 2 3 3032 0.74 (0.64-0.86) 0 Class 3 3 1655 0.80 (0.66-0.97) 0 Overall 0.77 (0.71-0.84) Macrosomia 3 40 107 0 Class 1 2 2906 0.80 (0.66-0.96) 0 Class 2 2 1566 0.79 (0.66-0.96) 0 Class 3 3 1265 0.64 (0.49-0.85) 0 Overall 0.76 (0.68-0.86) Cesarean delivery 4 86 702 0 Class 1 3 6011 0.91 (0.84-0.98) 0 Class 2 3 3032 0.82 (0.74-0.91) 0 Class 3 4 1881 0.86 (0.75-0.99) 0 Overall 0.87 (0.82-0.93) Studies, No. Women, No. Gestational weight gain above guidelines C I2, % Decreased Odds of Outcome Increased Odds of Outcome 0.2 1.0 5.0 OR (95% CI) Outcomes by obesity class SGA 3 85 668 OR (95% CI) 0 Class 1 3 35 489 0.58 (0.53-0.72) 0 Class 2 3 9627 0.69 (0.58-0.83) 0 Class 3 3 3629 0.78 (0.59-1.01) 13.5 Overall 0.62 (0.57-0.67) LGA 3 85 668 84.7 Class 1 3 35 489 1.87 (1.75-2.00) 0 Class 2 3 9627 1.76 (1.59-1.95) 42.8 Class 3 3 3629 1.50 (1.29-1.73) 69.3 Overall 1.79 (1.70-1.89) Macrosomia 3 40 107 80.9 Class 1 2 15 751 1.71 (1.53-1.92) 30.5 Class 2 2 4750 1.68 (1.39-2.04) 13.9 Class 3 3 2623 1.17 (0.94-1.46) 66.9 Overall 1.60 (1.46-1.75) Cesarean delivery 4 86 702 0 Class 1 3 35 489 1.24 (1.18-1.30) 0 Class 2 3 9627 1.15 (1.06-1.24) 0 Class 3 4 4024 1.15 (1.03-1.30) 0 Overall 1.21 (1.16-1.25)
Pooled ORs are shown for the association between gestational weight loss (A), gestational weight gain below guidelines (B), and gestational weight gain above guidelines (C) with adverse outcomes. Obesity classes indicate body mass index (BMI; calculated as weight in kilograms divided by height in meters squared) as follows: class 1, BMI of 30 to 34.9; class 2, BMI of 35 to 39.9; and class 3, BMI of 40 or higher. Reference group is women with recommended weight gain in each category of BMI. For each outcome, the sample size represents the total number of women in the studies that assessed the outcome. For each obesity category, the sample size represents the total number of women with weight loss, gestational weight gain below the guidelines, or gestational weight gain above the guidelines.
and multiparous women (multiparous values used herein), whereas other studies combined women with different par-ity into 1 group.
SGA by Obesity Class
Three studies assessed SGA. One defined SGA as birth weight less than the 10th percentile for gestational age alone,18
and 2 also used sex and parity to define SGA.17,30
Weight loss and weight gain below guidelines were asso-ciated with higher SGA risk (weight loss: OR, 1.79 [95% CI, 1.56 to 2.05]; I2= 0%; ARD, 3% [95% CI, 1% to 5%]; weight gain
be-low guidelines: OR, 1.27 [95% CI, 1.14 to 1.41]; I2
= 20.7%; ARD, 1% [95% CI, 1% to 1%]). Gestational weight gain above guide-lines was associated with lower SGA risk (OR, 0.62 [95% CI, 0.57 to 0.67]; I2= 13.5%; ARD, −1% [−2% to 0%]). Weight gain
in class 1 had the strongest association with lower SGA risk (lowest OR, 0.58; 95% CI, 0.53 to 0.72]; P for trend < .001). LGA by Obesity Class
Three studies assessed LGA. One defined LGA as birth weight greater than the 90th percentile for gestational age alone,18and
2 also used sex and parity to define LGA.17,30
Weight loss and gestational weight gain below guidelines were associated with lower LGA risk (weight loss: OR, 0.58 [95% CI, 0.52 to 0.66]; I2= 11.6%; ARD, −5% [95% CI, −7% to −3%];
weight gain below guidelines: OR, 0.77 [95% CI, 0.71 to 0.84];
I2
= 0%; ARD, −2% [95% CI, −3% to −1%]). Weight loss in class 3 had the strongest association with lower LGA risk (lowest OR, 0.53 [95% CI, 0.41 to 0.67]; P for trend < .001). Weight gain above guidelines was associated with higher LGA risk (OR, 1.79 [95% CI, 1.70 to 1.89]; I2
= 69.3%; ARD, 5% [95% CI, 5% to 6%]). LGA was most strongly associated with class 1 obesity com-pared with the other classes (highest OR, 1.87 [95% CI, 1.75 to 2.00]; P for trend < .001).
Macrosomia by Obesity Class
Three studies assessed macrosomia, defined as birth weight greater than 4000 g in 1 study,30greater than 4500 g in 1
study,18and both greater than 4000 g and greater than 4500 g
in 1 study.35
Meta-analysis used data for birth weight greater than 4000 g.
Weight loss and gestational weight gain below guidelines were associated with lower macrosomia risk (weight loss: OR, 0.46 [95% CI, 0.36 to 0.58]; I2= 34.0%; ARD, −5% [95% CI, −9%
to −2%]; weight gain below guidelines: OR, 0.76 [95% CI, 0.68 to 0.86]; I2
= 0%; ARD, −2% [95% CI, −3% to 0%]). Low weight gain in class 3 had the strongest association with lower mac-rosomia risk (lowest OR, 0.64 [95% CI, 0.49 to 0.85]; P for trend = .046). Gestational weight gain above guidelines was associated with higher risk of macrosomia (OR, 1.60 [95% CI, 1.46 to 1.75]; I2
= 66.9%; ARD, 3% [95% CI, 0% to 6%]). Cesarean Delivery by Obesity Class
Four studies assessed cesarean delivery. They included emergency,30
emergency and elective,18,35
and undefined17
in-dications for cesarean delivery.
Weight loss and gestational weight gain below guidelines were associated with lower risk of cesarean delivery (weight
loss: OR, 0.78 [95% CI, 0.72 to 0.85]; I2= 34.3%; ARD, −4% [95%
CI, −6% to −3%]; weight gain below guidelines: OR, 0.87 [95% CI, 0.82 to 0.93]; I2
= 0%; ARD, −2% [95% CI, −3% to −1%]). Ges-tational weight gain above guidelines was associated with higher risk of cesarean delivery (OR, 1.21 [95% CI, 1.16 to 1.25];
I2= 0%; ARD, 2% [95% CI, 0% to 3%]).
Metaregression
Substantial heterogeneity (I2> 50%) was present for
gesta-tional weight gain below and above guidelines for SGA, pre-term birth, LGA, and macrosomia and for gestational weight gain above guidelines for cesarean delivery. When sufficient data were available, metaregression analysis was performed to investigate possible sources of heterogeneity: percentage of smokers during pregnancy, mean age, and percentage of nul-liparous women (eTable 5 in theSupplement). The obese sub-groups had insufficient studies to perform metaregression.
Gestational weight gain above guidelines and LGA dem-onstrated a source for heterogeneity (P = .04); specifically, there was an association between the treatment effect and the co-variate smoking (P = .02). For gestational weight gain below guidelines and preterm birth, mean maternal age was the only covariate associated with outcome, where the risk for pre-term birth varied by maternal age due to the heterogeneity in maternal age in included studies (P = .03); however, the over-all P value was not significant (P = .09). Heterogeneity was un-explained for remaining outcomes.
Publication Bias
There was no evidence of publication bias for SGA, LGA, mac-rosomia or cesarean delivery (eFigure 4 in theSupplement). Assessment for publication bias was not performed for pre-term births (<5 studies).
Risk of Bias
Participants were selected from maternity clinics or from large data sets (Table 4). Apart from 3 studies,19,23,32
inclusion and exclusion criteria were adequately described. Performance bias (a potential difference in the care provided between BMI groups) was difficult to assess. Very few studies provided in-formation regarding diet and/or exercise advice given and whether this differed between groups. Overweight and obese women were possibly treated more intensively, which could introduce bias.
Three studies demonstrated moderate bias risk19,21,31
and 20 demonstrated low bias risk.17,18,20,22-24,28-30,32-42
Reasons for moderate bias risk included self-reported final weight (detection bias), self-reported outcome measures (detection bias), failure to report all outcomes (report bias), and insufficient adjustment for confounding variables (confounding bias). Nineteen studies reported no conflict of interest.
Discussion
In this analysis of 1 309 136 pregnancies from diverse interna-tional cohorts, gestainterna-tional weight gain below or above 2009
IOM guidelines among women across the BMI range was as-sociated with greater risk for maternal and infant adverse out-comes. Underweight women composed 7%; normal-weight women, 55%; overweight women, 18%; and obese women, 20%. For gestational weight gain, 23% gained below and 47% gained above guidelines. Compared with recommended ges-tational weight gain, gain below guidelines was associated with 5% higher risk of both SGA and preterm birth and 2% lower risk of both LGA and macrosomia. Weight gain above guidelines was associated with 3% lower risk of SGA and 2% lower risk of preterm birth and 4%, 6%, and 4% higher risk of LGA, mac-rosomia, and cesarean delivery, respectively.
Gestational weight gain below guidelines was associated with higher SGA risk, with greatest risk in underweight women, as shown previously.43,44
Obesity was associated with higher risk of SGA, with weight loss and gestational weight gain be-low guidelines increasing risks, similar to prior systematic reviews.26,45,46Underweight status combined with
gesta-tional weight gain below recommendations as well as obese status combined with gestational weight loss present the high-est risk groups for SGA, at 8% and 3%, respectively.
Gestational weight gain below guidelines was as-sociated with a 5% increase in preterm birth across the included populations. With 23% having weight gain below Table 4. Summary of Risk of Bias Assessment
Source
Selection Bias, Exposed Cohort Representative
Detection Bias Reporting Bias,
Free of Selective Outcome Reporting Assessment of Confounding in Original Analysis Conflict of Interest Overall Risk of Bias Adequate Exposure Measures Adequate Outcome Measures Durst et al,23 2016
Yes Yes Yes Yes Yes No Low
Enomoto et al,222016
Yes NR Yes Yes Yes No Low
Hung and
Hsieh,242016 Yes Yes Yes Yes Yes No Low
Xiong et al,29
2016
Yes Yes Yes Yes Yes No Low
Bogaerts et al,302015
Yes Yes Yes Yes Yes No Low
Shin and
Song,312015 Yes Yes No(self-reported) Yes Partial (did not adjustfor parity) No Moderate
Wen and Lv,21
2015
NR Yes NR Partial (not all
outcomes reported)
Partial (did not adjust for required number of confounders)
No Moderate
Yang et al,32
2015
Yes Yes Yes Yes Yes No Low
Badon et al,20
2014
Yes Yes Yes Yes Yes No Low
Chihara et al,19
2014
Yes Partial (self-reported final weight)
No
(self-reported)
Yes Yes NR Moderate
Haugen et al,33
2014
Yes Partial (self-reported final weight)
Yes Yes Yes No Low
Lee et al,34
2014
NR Yes Yes Yes Yes No Low
Swank et al,35
2014
Yes Yes Yes Yes Yes No Low
Black et al,28
2013
Yes Yes Yes Yes Yes No Low
Kominiarek
et al,182013 Yes Yes Yes Yes Yes No Low
Li et al,362013 Yes Yes Yes Yes Yes No Low
Di Benedetto et al,372012
Yes Yes Yes Yes Partial (did not adjust
for parity)
No Low
Simas et al,38
2012
Yes Partial (some self-reported final weight)
Yes Yes Yes No Low
Blomberg,17
2011
Yes Yes Yes Yes Yes No Low
Park et al,39
2011
Yes Yes Yes Partial (not all
outcomes reported)
Yes NR Low
Park et al,40
2011
Partial NR Yes Yes Yes NR Low
Vesco et al,41
2011
Yes Yes Yes Yes Yes No Low
Rode et al,42
2007
NR Partial (self-reported final weight)
Yes Yes Partial (did not adjust
for parity)
NR Low
recommendations, this could correspond to 15 000 more preterm birth events. Weight gain above guidelines was associated with lower risk of preterm birth. Prior reviews have shown similar associations, but they did not stratify by prepregnancy BMI and gestational weight gain.47,48One
small systematic review in obese women did not find asso-ciations between preterm birth and weight gain outside guidelines.49
With larger sample sizes and stratification by BMI and prepregnancy weight gain, the current review adds to prior work and has greater clinical applicability. Also, as maternal BMI increased, the association between gesta-tional weight gain below guidelines and preterm birth risk was weakened, consistent with an earlier review.3
Gestational weight gain below guidelines was associated with lower risks of LGA and macrosomia. This association was lowest in underweight women. Weight gain above guidelines was associated with higher risks of LGA and macrosomia, with ARDs of 4% and 6% greater risks, respectively. Underweight status was associated with the greatest risk. This is similar to the 2009 IOM report6that stated, “the lower the
prepreg-nancy BMI, the stronger the association between increased ges-tational weight gain and birthweight”; it may be related to higher absolute weight gain in underweight women.1
Animal studies suggest that baseline maternal BMI and gestational weight gain are associated with changes in the hormonal mi-lieu, including insulin resistance.50
Similarly, excess weight gain in underweight women may be associated with greater changes in the hormonal milieu and placental function than in normal-weight or overweight women. Weight gain above guidelines was associated with increased risk of cesarean de-livery across the BMI spectrum.
Similarly, within the obese subgroups, weight loss was as-sociated with a 5% lower risk for both LGA and macrosomia and 4% lower risk for cesarean delivery. Weight gain below guidelines was associated with 2% lower risk across all these outcomes. Class 3 obesity combined with weight loss was as-sociated with the greatest LGA risk reduction. Gestational weight gain above guidelines was associated with increased LGA risk. Class 1 obesity was associated with the greatest risk for LGA, which may be partly due to higher absolute weight gain in less obese women.10
While other systematic reviews have assessed gestational weight gain below guidelines,26to
our knowledge, this is the first review exploring relation-ships between weight gain above guidelines and outcomes within obesity classes.
While GDM has adverse maternal and infant outcomes51
and is related to maternal BMI and possibly to gestational weight gain, associations could not be assessed because of heterogeneity of diagnosis and treatment as well as the po-tential effect of GDM treatment on gestational weight gain. Prior systematic reviews have not demonstrated that healthy life-style and gestational weight gain reduced rates of GDM,14even
in high-risk populations.52Consistent diagnostic criteria and
reporting of gestational weight gain at GDM diagnosis are needed to study associations between gestational weight gain and GDM.
Lifestyle interventions in pregnancy can help women at-tain recommended gestational weight gain.14Optimal
inter-ventions and effects on outcomes are currently being studied in a large-scale international individual patient data meta-analysis.53
The WHO has prioritized achievement of ideal BMI prior to conception and prevention of excess gestational weight gain.54Identification of women prior to conception and
implementing healthy lifestyle strategies before and during pregnancy have yet to be integrated into routine health care,55
requiring research implementation.
Strengths of this review are the inclusion of common ma-ternal and infant risks associated with gestational weight gain below and above the 2009 IOM guidelines in women across the prepregnancy BMI spectrum and across international co-horts. Four databases were searched, a risk of bias appraisal was performed, and reanalyses were undertaken, allowing in-clusion of data from more than 1.3 million pregnant women globally. Collaboration with other authors facilitated more ho-mogeneous data, data integration, and meta-analysis.
Limitations
This study has limitations. It lacks studies from developing countries and excluded non-English-language articles. Fif-teen of 31 authors contacted were unable to reanalyze data, so these studies were excluded from the meta-analysis. A meta-analysis could not be performed for GDM because of inconsistent primary data. Some outcomes were assessed in only 1 study, precluding meta-analysis. Inconsistent defini-tions of preterm birth, cesarean delivery, and macrosomia limited interpretation of findings. Study heterogeneity may have affected reliability of results, although the metaregres-sion did not identify characteristics responsible for this heterogeneity. Studies published before 2009 IOM guide-lines were included, and gestational weight gain targets before and after these guidelines may have differed. Pre-term birth was not adjusted for gestational age, potentially resulting in less total gestational weight gain than would have been otherwise attained. Spontaneous and induced preterm birth were not clearly differentiated, and studies did not distinguish between emergency and elective or pri-mary and repeated cesarean deliveries. These factors may limit interpretation and underscore the importance of improving outcome definition reporting. Event rates were not available for all studies, limiting interpretation of ARDs. Findings from this review are based on observational data and no causal links may be concluded. They may be appli-cable on a population level, but recommendations need to be individualized when applied clinically.
Conclusions
In this systematic review and meta-analysis of more than 1 mil-lion pregnant women, 47% had gestational weight gain greater than IOM recommendations and 23% had gestational weight gain less than IOM recommendations. Gestational weight gain greater than or less than guideline recommendations, com-pared with gestational weight gain within recommended lev-els, was associated with higher risk of adverse maternal and infant outcomes.