Original Paper
Explanatory Model of Dry Eye Disease Using Health and Nutrition
Examinations: Machine Learning and Network-Based Factor
Analysis From a National Survey
Sang Min Nam1*, MD, PhD; Thomas A Peterson2*, PhD; Atul J Butte2, MD, PhD; Kyoung Yul Seo3, MD, PhD; Hyun Wook Han4, MD, PhD
1Department of Ophthalmology, CHA Bundang Medical Center, CHA University, Seongnam, Republic of Korea 2
Bakar Computational Health Sciences Institute, University of California San Francisco, San Francisco, CA, United States
3Department of Ophthalmology, Institute of Vision Research, Eye and Ear Hospital, Severance Hospital, Yonsei University College of Medicine, Seoul, Republic of Korea
4Department of Biomedical Informatics, CHA University School of Medicine, CHA University, Seongnam, Republic of Korea *these authors contributed equally
Corresponding Author: Hyun Wook Han, MD, PhD
Department of Biomedical Informatics, CHA University School of Medicine, CHA University 335 Pangyo-ro Seongnam, 13488 Republic of Korea Phone: 82 318817109 Email: hwhan@chamc.co.kr
Abstract
Background: Dry eye disease (DED) is a complex disease of the ocular surface, and its associated factors are important for understanding and effectively treating DED.
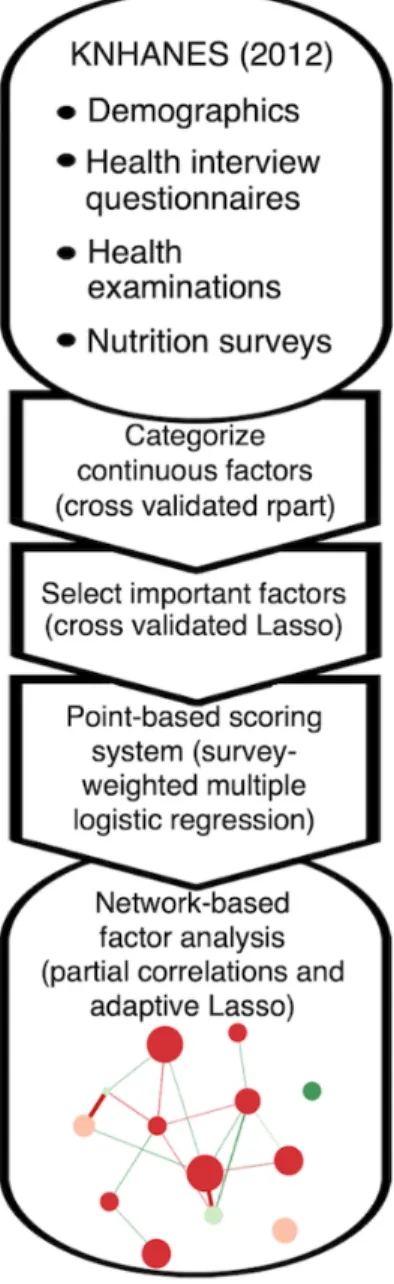
Objective: This study aimed to provide an integrative and personalized model of DED by making an explanatory model of DED using as many factors as possible from the Korea National Health and Nutrition Examination Survey (KNHANES) data. Methods: Using KNHANES data for 2012 (4391 sample cases), a point-based scoring system was created for ranking factors associated with DED and assessing patient-specific DED risk. First, decision trees and lasso were used to classify continuous factors and to select important factors, respectively. Next, a survey-weighted multiple logistic regression was trained using these factors, and points were assigned using the regression coefficients. Finally, network graphs of partial correlations between factors were utilized to study the interrelatedness of DED-associated factors.
Results: The point-based model achieved an area under the curve of 0.70 (95% CI 0.61-0.78), and 13 of 78 factors considered were chosen. Important factors included sex (+9 points for women), corneal refractive surgery (+9 points), current depression (+7 points), cataract surgery (+7 points), stress (+6 points), age (54-66 years; +4 points), rhinitis (+4 points), lipid-lowering medication (+4 points), and intake of omega-3 (0.43%-0.65% kcal/day; −4 points). Among these, the age group 54 to 66 years had high centrality in the network, whereas omega-3 had low centrality.
Conclusions: Integrative understanding of DED was possible using the machine learning–based model and network-based factor analysis. This method for finding important risk factors and identifying patient-specific risk could be applied to other multifactorial diseases.
(JMIR Med Inform 2020;8(2):e16153) doi: 10.2196/16153
KEYWORDS
Introduction
Background and Related Studies
Dry eye disease (DED) is defined as “a multifactorial disease of the ocular surface characterized by a loss of homeostasis of the tear film, and accompanied by ocular symptoms” [1]. Due to its multifactorial etiology, DED cannot be characterized by a single process and its management is complicated, in which finding the major causative factors behind DED is critical to appropriate treatment [1]. Therefore, identification of DED-related factors may enable advances in diagnosis, elucidative pathophysiology, therapy, and public education, as well as improvement of general and ocular health [2]. Indeed, various nonmodifiable, modifiable, environmental, and medical factors related to DED have been reported by observational studies and population-based, cross-sectional epidemiological studies [2]. DED risk factors are categorized as consistent, probable, and inconclusive; age, sex, Meibomian gland dysfunction (MGD), connective tissue disease, Sjogren syndrome, androgen deficiency, computer use, contact lens wear, estrogen replacement therapy, and medication use (eg, antihistamines, antidepressants, and anxiolytics) are identified as consistent risk factors [2].
Previously, a limited number of DED-associated factors were investigated using the Korea National Health and Nutrition Examination Survey (KNHANES) [3]. Although KNHANES consists of a large number of variables from health interview questionnaires, health examinations, and nutrition surveys, they were not fully utilized [3]. In addition, previous studies on DED have identified DED-related factors, instead of building a DED model to assess the risk of DED for new individuals [3-7].
Highlights of This Study
In this study, we generated a point-based model with DED-associated factors from KNHANES using machine learning algorithms and Lasso regularization. These methods can improve the model performance to predict DED by selecting features from a large number of variables from a large dataset without overfitting while preserving complex interactions among features [8]. Furthermore, interactions among the factors were explored by network analysis. When the network analysis was applied to the model, a systemic understanding of DED, which cannot be achieved by conventional methods, was possible by showing the linkages between the relevant factors. To the best
of our knowledge, this was the first attempt at building a machine learning–based model to evaluate the individual risks of DED and visualize the state using the network graph of DED-associated factors.
Methods
Overview of Survey Data
The design, methods, and data resource profile of KNHANES are available on the Web and in publications [9-11]. In short, KNHANES is an annual survey performed by the Korea Centers for Disease Control and Prevention (KCDC) in the Republic of Korea, which assesses the health and nutritional status of the population [10]. KNHANES is a nationwide cross-sectional survey of a representative set of 10,000 noninstitutionalized civilian individuals who are aged 1 year and older. Both DED assessment and food frequency surveys were conducted only in 2012. In the 2012 KNHANES, 192 primary sampling units (PSUs) were drawn from about 200,000 geographically defined PSUs nationwide; 20 final target households were sampled for each PSU as secondary sampling units [9]. KNHANES V (2012) was approved by the KCDC Research Ethics Committee (2012-01EXP-01-2C), and written informed consent was obtained from all subjects.
Variable Inclusion
Four data files, HN12_ALL (health examination, health survey, and nutrient survey), HN12_ENT (ear, nose, and throat examination), HN12_EYE (eye examination), and HN12_FFQ (food frequency survey), were combined. DED was considered to be present when a subject had been diagnosed with DED by an ophthalmologist (the variable E_DES_dg) and was experiencing dryness (E_DES_ds). Conversely, patients were defined as DED-negative in the absence of both a diagnosis and symptoms. E_DES_dg and E_DES_ds are available for persons who are aged 19 years and older [11].
The included variables are listed in Textbox 1, and the overall analysis is summarized in Figure 1.
All variables were available for subjects aged 19 years and older except those of food frequency (19-64 years) and osteoarthritis radiology (≥50 years) [9]. The LDL level was calculated using the Friedewald equation, LDL=total cholesterol−(HDL+TG/5), with exclusion of TG levels of higher than 400 mg/dL [12].
Textbox 1. Included study variables of the Korea National Health and Nutrition Examination Survey data (2012). Health examination data
Physical examination
• Body mass index (BMI), rhinitis, sinusitis, blepharoptosis [11], and cataract Blood test results
• Anemia, hemoglobin, hematocrit, iron, total iron-binding capacity, ferritin, hemoglobin A1c, white blood cell count, platelet count, red blood cell count, aspartate aminotransferase, alanine aminotransferase, creatinine, urea nitrogen, and vitamin D
Fasting (≥8 hours) blood parameters
• Sugar level, low-density lipoprotein cholesterol (LDL) level, high-density lipoprotein cholesterol (HDL) level, triglyceride (TG) level Hypercholesterolemia definition: total cholesterol (TC)≥240 mg/dL or lipid-lowering medication
Hypertension definition: systolic blood pressure≥140 mm Hg, or diastolic blood pressure ≥ 90 mm Hg, or medication Diabetes mellitus definition: fasting blood sugar level≥126 mg/dL, or diagnosis, or medication, or insulin injection Fundus photography
• age-related macular degeneration, diabetic retinopathy Osteoarthritis on radiology
Health survey data
• Age, educational stage, occupational class, household income, weight changes in the last year, mean duration of sleep per day, stress recognition, current smoker, frequency of drinking alcohol, activity level, lipid-lowering medications, diagnosed glaucoma, eye surgery, and menstruation
Diagnosed current diseases
• dyslipidemia, depression, stroke, myocardial infarction or angina, rheumatoid arthritis, thyroid disease, atopic dermatitis, and asthma Diagnosed cancers
• stomach, colon, breast, cervix, and thyroid Food frequency survey data (daily intake)
• Energy, carbohydrate, protein, total fat, n-3 polyunsaturated fatty acid, n-6 polyunsaturated fatty acid, saturated fatty acid, cholesterol, fiber, vitamin A, vitamin B1, vitamin B2, vitamin C, niacin, iron, calcium, potassium, phosphorus, and sodium
Figure 1. Flowchart of overall analysis steps. KNHANES: Korea National Health and Nutrition Examination Survey.
Subsampling of Training and Test Sets and Categorization of Factors
Most DED cases (80.00%, 3513/4391) were used as training, and the other cases were used for testing. Likewise, non-DED cases were subsampled into training and test sets in the same way. Next, the categorization or recategorization of the factors was performed for the training set in consideration of reference values. Here, optimal cutoffs were determined by training a decision tree on the training data and using binarized decision tree rules as factors in the final regression model [13,14]. Missing values of each variable were classified as a separate class.
Factor Selection Using Lasso (Least Absolute Shrinkage and Selection Operator)
Factors were transformed into dummy-coded variables, in which the largest category was used as reference and was excluded during model construction, and missing values were not included in the Lasso procedure.
Lasso trained using cross validation was applied to the transformed dummy variables with area under the curve (AUC) as a stopping metric and wt_tot as the sample weight for the analysis of the associations between the health interview, health examination, and nutrition survey. To regularize the model, we selected the optimal lambda using cross validation (lambda.1se in glmnet, ie, the lambda that yields an error one standard error away from the minimum error).
Construction of a Model for Dry Eye Disease
Using the lasso-selected factors, a survey-weighted multiple logistic regression model was constructed from the complex survey design of KNHANES. The survey design was represented using the variable psu for PSU and ID_fam for the secondary sampling unit, kstrata for strata, and wt_tot for weights.
Developing a Point-Based Scoring System for Dry Eye Disease
A point-based scoring system was developed by multiplying the coefficients of factors in the survey-weighted regression model by 10 and rounding to the nearest integer [15]. The total
score of each individual in the training set was determined by summing the points for factors accurately describing that individual. Next, performance was assessed using weighted receiver-operating characteristic (ROC) curves and the AUCs with survey sample weight (wt_tot). An optimal cutoff for the point-based system was determined by maximizing Youden’s index value (sensitivity+specificity−1).
Testing the Point-Based Scoring System for Dry Eye Disease
The model’s performance was assessed using the test set. The AUC’s confidence interval was calculated; sensitivity and specificity were reported using the point-based system’s cutoff determined from the training set.
Analysis of Dry Eye Disease-Risk Factors
A survey-weighted multiple logistic regression analysis was performed using the factors selected by lasso. Odds ratios (ORs) were calculated by exponentiating the coefficient derived by logistic regression. Estimated population counts and proportions for categories were computed.
Network Analysis of Dry Eye Disease-Associated Factors
With the training set, a correlation matrix for the DED-associated factors was created. Weighted Pearson correlation coefficients between two variables were calculated. Next, a network graph was plotted by setting the graph argument to “glasso” and the layout to “spring.” A partial correlation network was drawn using the graphical lasso algorithm and the Extended Bayesian Information Criterion by which false positive edges were controlled. Each edge represents the relationship between 2 nodes after controlling for all other relationships in the network [16,17]. The Fruchterman-Reingold algorithm is applied with the “spring” layout, in which the lengths of edges are dependent on their absolute weights [16]. Green edges indicate positive weights (correlations) and red edges indicate negative weights. Color saturation and edge width correspond to the absolute weight relative to the strongest weight in the graph. Node size was proportional to the z-score for the absolute
point of the factor. Nodes were grouped as significant (P<.05, risk factor analysis) or possible (P≥.05, risk factor analysis). Three centrality indices (strength, closeness, and betweenness) were computed. Centrality is the absolute sum of the edge weights connected to the node, closeness is the sum of the shortest distances from the node to all other nodes in the network, and betweenness is the number of times in which the node lies on the shortest path between 2 other nodes [17,18].
Statistics and Software
R version 3.6.1 and variable functions from its packages were used: decision tree, “rpart” in the caret package (using down-sampling and cross-validation) [19,20]; dummy-coded variables, “dummy.code” in the psych package [21]; cross-validation for Lasso, “cv.glmnet” in the glmnet package [22]; survey-weighted multiple logistic regression, “svyglm” in the survey package [23]; weighted ROC curve and AUC, “WeightedROC” and “WeightedAUC,” respectively, in the WeightedROC package [24]; confidence interval of AUC, “withReplicates” in the survey package [23]; estimation of population counts and proportions, the survey package [23]; general graphs, the ggplot2 package [25]; weighted correlation, “wtd.cor” in the weights package [26]; network graph, “qgraph” in the qgraph package [16]; and centrality indices, “qgraph” and “centralityTable” in the qgraph package [16].
Results
Point-Based Scoring Model for Dry Eye Disease
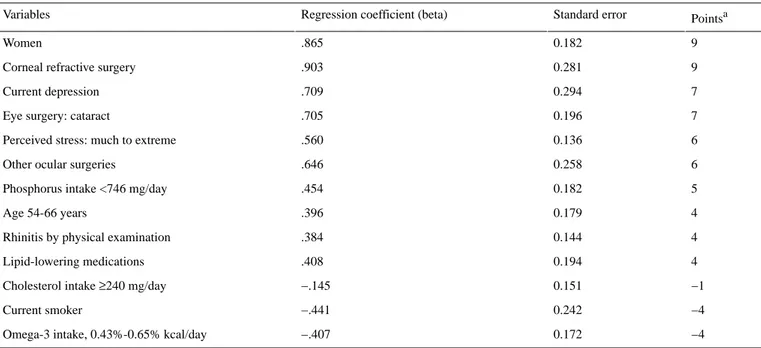
Total sample sizes for DED and non-DED were 575 and 3816 cases, respectively. The estimated prevalence of DED was 10.5% (SE 1.0%): 5.3% (SE 1.0%) for men and 15.9% for women (SE 1.0%). A total of 13 factors were selected by lasso and the point-based scoring system for each factor is outlined in Table 1.
Using this scoring system on the test set achieved an AUC of 0.70 (95% CI 0.61-0.78; Figure 2). Sensitivity and the specificity were 0.66 and 0.68, respectively, at a cutoff of 10 points.
Table 1. Point-based scoring system for assessing individual risk of dry eye disease using coefficients from a survey-weighted multiple logistic regression model.
Pointsa Standard error
Regression coefficient (beta) Variables 9 0.182 .865 Women 9 0.281 .903 Corneal refractive surgery
7 0.294 .709 Current depression 7 0.196 .705 Eye surgery: cataract
6 0.136
.560 Perceived stress: much to extreme
6 0.258
.646 Other ocular surgeries
5 0.182
.454 Phosphorus intake <746 mg/day
4 0.179 .396 Age 54-66 years 4 0.144 .384 Rhinitis by physical examination
4 0.194 .408 Lipid-lowering medications −1 0.151 −.145 Cholesterol intake ≥240 mg/day
−4 0.242 −.441 Current smoker −4 0.172 −.407 Omega-3 intake, 0.43%-0.65% kcal/day
aCalculated by multiplying the coefficient of the variable by 10 and rounding to the nearest integer. A positive point means a positive predictor for dry eye disease. Dry eye disease is indicated when the sum of all points is 10 or higher.
Figure 2. Weighted receiver-operating characteristic (ROC) of the point-based scoring system for predicting dry eye disease. ROCs for train and test sets were compared. AUC: area under the curve.
Risk Factor Analysis For Dry Eye Disease
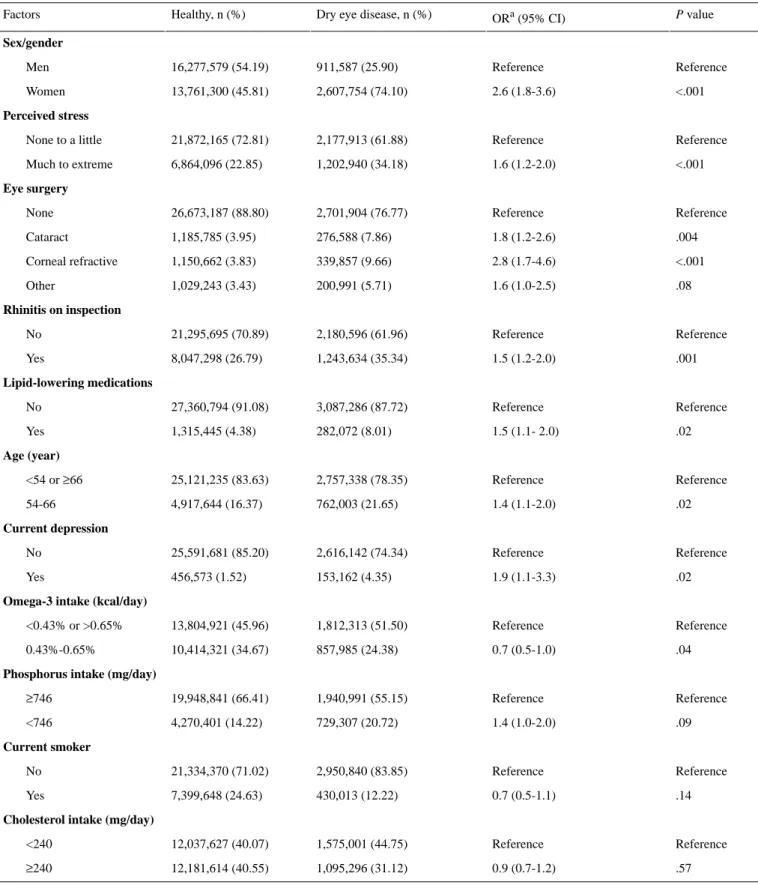
In the risk factor analysis, 10 of the 13 variables were significant (P<.05; Table 2). The top 3 significant risk factors in the
point-based model were women, corneal refractive surgery, and current depression (Tables 1 and 2). Omega-3 intake between
0.43% (1003 mg for total 2100 kcal) and 0.65% (1517 mg for total 2100 kcal) was a significant protective factor.
Population counts (n), proportions (%), and ORs were estimated according to complex survey design. ORs and P values were
calculated by multiple logistic regression including all listed variables. The missing data category for each variable were included for calculation but not shown in the table.
Table 2. Population counts (n), proportions (%), and odds ratios of variables in the points-based scoring system for dry eye disease.
P value
ORa (95% CI) Dry eye disease, n (%)
Healthy, n (%) Factors Sex/gender Reference Reference 911,587 (25.90) 16,277,579 (54.19) Men <.001 2.6 (1.8-3.6) 2,607,754 (74.10) 13,761,300 (45.81) Women Perceived stress Reference Reference 2,177,913 (61.88) 21,872,165 (72.81) None to a little <.001 1.6 (1.2-2.0) 1,202,940 (34.18) 6,864,096 (22.85) Much to extreme Eye surgery Reference Reference 2,701,904 (76.77) 26,673,187 (88.80) None .004 1.8 (1.2-2.6) 276,588 (7.86) 1,185,785 (3.95) Cataract <.001 2.8 (1.7-4.6) 339,857 (9.66) 1,150,662 (3.83) Corneal refractive .08 1.6 (1.0-2.5) 200,991 (5.71) 1,029,243 (3.43) Other Rhinitis on inspection Reference Reference 2,180,596 (61.96) 21,295,695 (70.89) No .001 1.5 (1.2-2.0) 1,243,634 (35.34) 8,047,298 (26.79) Yes Lipid-lowering medications Reference Reference 3,087,286 (87.72) 27,360,794 (91.08) No .02 1.5 (1.1- 2.0) 282,072 (8.01) 1,315,445 (4.38) Yes Age (year) Reference Reference 2,757,338 (78.35) 25,121,235 (83.63) <54 or ≥66 .02 1.4 (1.1-2.0) 762,003 (21.65) 4,917,644 (16.37) 54-66 Current depression Reference Reference 2,616,142 (74.34) 25,591,681 (85.20) No .02 1.9 (1.1-3.3) 153,162 (4.35) 456,573 (1.52) Yes
Omega-3 intake (kcal/day)
Reference Reference 1,812,313 (51.50) 13,804,921 (45.96) <0.43% or >0.65% .04 0.7 (0.5-1.0) 857,985 (24.38) 10,414,321 (34.67) 0.43%-0.65%
Phosphorus intake (mg/day)
Reference Reference 1,940,991 (55.15) 19,948,841 (66.41) ≥746 .09 1.4 (1.0-2.0) 729,307 (20.72) 4,270,401 (14.22) <746 Current smoker Reference Reference 2,950,840 (83.85) 21,334,370 (71.02) No .14 0.7 (0.5-1.1) 430,013 (12.22) 7,399,648 (24.63) Yes
Cholesterol intake (mg/day)
Reference Reference 1,575,001 (44.75) 12,037,627 (40.07) <240 .57 0.9 (0.7-1.2) 1,095,296 (31.12) 12,181,614 (40.55) ≥240 aOR: odds ratio.
Network Analysis for Dry Eye Disease Model
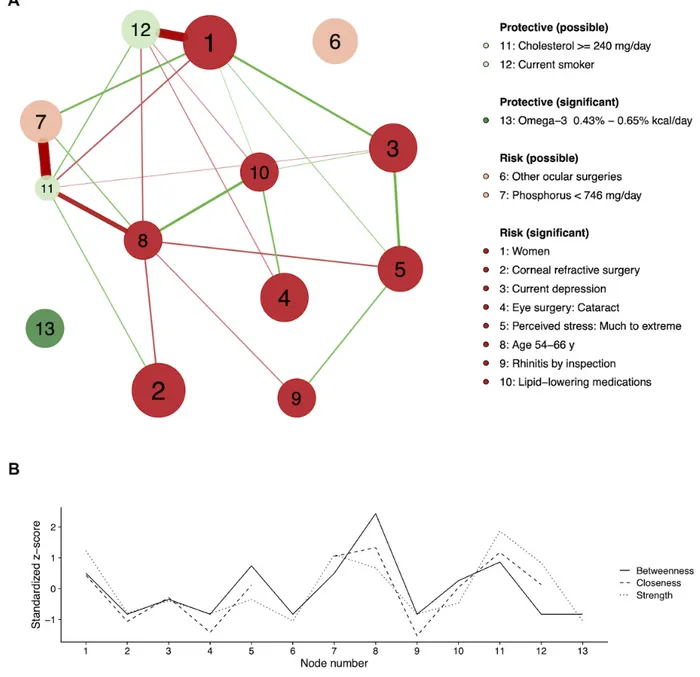
In Figure 3, model factors are depicted in a partial correlation network with centrality indices. The network-based factor analysis in Figure 3 allows for the interrogation of the interrelatedness of factors associated with DED, with larger nodes representing factors’ importance (points), green nodes
representing protective factors, and red nodes representing risk factors. According to centrality indices (Figure 3), Age 54-66y (node 8) had high centrality in the network. For other ocular
surgeries (node 6) and omega-3 (node 13), the closeness indices
were too low to calculate owing to lack of the connections to other nodes.
Figure 3. The partial correlation (adaptive LASSO) network (A) and the centrality indices (betweenness, closeness, and strength) (B) of the factors associated with the dry eye disease. Factors were positively (risk) or negatively (protective) associated with dry eye disease. Factors can be significant (P<.05) or possible (P≥.05) according to the risk factor analysis. The node size is proportional to the absolute value of the point for the node’s variable. Green and red edges mean positive and negative connections, respectively. The edge with the highest absolute weight will have full color saturation and be the widest.
Four significant risk factors were linked in succession from
women (node 1) to current depression (node 3), much to extreme stress (node 5), and rhinitis (node 9). Other serial connections
were found in three significant risk factors, age 54-66y,
lipid-lowering medication (node 10), and cataract surgery (node
4). Nonsignificant factors were strongly connected with other significant factors, for example, current smoker (node 12) to
women, and cholesterol intake (node 11) to age 54-66y. Another
nonsignificant factor, phosphorous intake (node 7), was closely associated with the cholesterol intake.
Discussion
Principal FindingsOur model showed moderate performance for DED prediction with a point-based scoring system in which the maximum AUC
might reach 0.78. Our study chose a stricter definition of DED because the individuals were not only required to be symptomatic but also have a physician diagnosis. In addition, the absence of DED was rigorously defined as a lack of symptoms and no physician diagnosis in the past. According to the TFOS DEWS II report, DED is diagnosed on the basis of the presence of a symptom and positivity for one or more homeostatic markers [1]. Our DED definition more reflected a diagnosis of DED, and thus, the prevalence could be lower than that of prior studies that used a symptomatic definition [2]. However, even our definition was imperfect because diagnostic tests were not performed and might be biased by the availability of a clinic in the local area or by the respondent’s condition. This may explain, in part, the moderate diagnostic performance of our DED model.
Reasoning for Machine Learning and Point-Based Scoring Model
Machine learning algorithms and techniques were used for several purposes. First, tree-based machine learning was applied to categorize continuous variables. Second, Lasso was implemented to select important factors to simplify the model and to reduce overfitting. Third, the models were generated using a training sample and validated with a separate test sample, which enabled estimation of predictive power. This technique is preferred because standard regression modeling and automated variable selection (eg, stepwise selection, pretesting of candidate predictors) can result in overfitting [27,28]. As a result, our model was robust enough to generalize to populations not used during training without overfitting (Figure 2).
Point-based scoring systems are useful for describing the relationship between multiple factors and the risk of the development of a disease [15]. Likewise, using our point-based model, DED can be assessed by summing the points accurately describing an individual with a cutoff of 10 points, indicating high risk for DED. In addition, the node size was determined by its point, and interrelatedness of DED risk factors was interrogated. Because DED was predicted by the sum of points, larger nodes might be prioritized in evaluating DED.
Interpretation for Indirect Model Factors With Network Analysis
By risk factor and network analyses, significant factors were presumed to be directedly associated with DED, whereas nonsignificant factors might be indirectly associated. Conventionally, nonsignificant factors might have been confounding variables that are related to DED via other significant factors. The network graph showed that nonsignificant factors such as phosphorus <746 mg/day (node 7), current smoker (node 12), and cholesterol ≥240 mg/day
(node 11) were connected to significant factors such as women (node 1) and age 54-66y (node 8; Figure 3). However, those nonsignificant factors were necessary to maximize the model performance and selected by a machine learning–based Lasso regression. Therefore, they seemed to be included to tune points of other significant factors without a causal effect on DED. For example, current smoker (node 12) had a negative effect on
risk factor for DED, and our study did not suggest smoking as a risk factor [2].
Known Factors in Dry Eye Disease Model
In the network-based analysis in Figure 3, age 54-66y (node 8) showed high centrality in the network, which means that it has more connections (strength), it is closer to other nodes (closeness), or makes connections between other nodes (betweenness). This high-centrality node exists at the center of the network and acts as hubs that connect disparate nodes [18]. In contrast, omega-3 intake (node 13) and other ocular surgeries (node 6) were independent nodes with low centrality.
In the previous study with KNHANES 2010-2011 by Ahn et al [3], 50- to 59-year-old and 60- to 69-year-old groups are presented as risk factors, which are in agreement with our age factor of 54 to 66 years. Other risk factors suggested (women, extreme stress, cataract surgery, refractive surgery, other ocular surgery) were also picked up in our model except for thyroid disease and educational level [3]. Thyroid disease is a possible risk factor, and the previous study argues an ambiguous link between thyroid disease and DED [2,3]. The difference between our work and the previous study can come from different definitions of DED because we used both the diagnosis and symptoms to classify an individual as having DED, whereas the previous study used the criteria of having either the diagnosis or symptoms [3].
Female sex is consistently associated with DED throughout the studies, but the prevalence of DED is considerably variable in these studies with respect to sex and age [2]. Stress has been associated with DED as a trigger or an immune response modulator [2,3]. Ocular surgery can cause DED in various ways, for example, the exposure to strong light of the microscope during the surgery, use of anesthetic or postoperative eyedrops, and the corneal nerve damage [3]. Specifically, refractive surgery leads to neuropathic dry eye by sensory nerve damage, decreased tear secretion, and induced neurogenic inflammation [2].
New Factors in Dry Eye Disease Model
Depression, rhinitis, lipid-lowering medication, and omega-3 intake were new DED-associated factors in our model that were added to previously reported factors of KNHASES [3]. Those factors have not been evaluated in the previous KNHASES study on DED [3]. Depression (node 3) was positively connected to node 1 (women), and a close association between depression and DED in women has been reported [7]. Depression is more prevalent in patients with DED partly because of somatization and perceptional changes in ocular discomfort [29]. In addition, depression was serially connected to other risk factors (Figure 3), such as female sex, stress, and rhinitis, which may be utilized for DED risk evaluation and control because positively connected serial factors can occur together with possible causalities. For rhinitis, allergic rhinitis was reported to be significantly associated with DED, and inflammation is related to both [30,31]. Notably, rhinitis was a clinically reliable factor because it was diagnosed by physician’s examination.
4). Dyslipidemia and its treatment might be an issue for the 54-to 66-year-old group, which could explain the negative connection between node 8 and node 11 (cholesterol >240
mg/day). Dyslipidemia has been suggested to induce MGD, a
major cause of DED [5,32]. However, oral statin therapy, not hypercholesterolemia, were recently reported to be associated with the symptoms of DED [33]. Interestingly, sterols have been reported to reduce cataract severity [34,35], and cholesterol metabolism might be linked to cataract formation [36]. The results of randomized controlled trials for DED treatment effect of omega-3 have been inconsistent, and larger studies suggest no statistically significant improvement compared with placebo [37,38]. Nonetheless, omega-3 has been commonly used to treat DED in the clinic because essential fatty acids, including omega-3, display anti-inflammatory properties [39], enhance the lipid layer of the tear film, and improve tear secretion while lacking association with substantial side effects [2]. However, it remains a problem that there is no consensus on the dose of supplementation, and our study suggested that 1000 to 1500 mg daily intake of omega-3 (for 2100 kcal average calorie intake) helped to prevent DED. It was noteworthy that
omega-3 intake might be used to treat DED without possible
effects on other factors because it did not have a connection in the network (Figure 3).
Limitations
This study has several limitations. Eye-related factors (blepharitis, lid abnormalities, low blink rate, other ocular surface disease, or conjunctivochalasis) and Sjögren syndrome could not be assessed [40]. In addition, some nutrient factors might have been missed because nutrient intake data were available only for subjects younger than 65 years [9].
Conclusions
In summary, the machine learning–based model to assess the individual risks of DED was successfully created from a large-scale national survey data. With this model, additional DED-associated factors could be suggested, and personalized medical advice was possible using the network graph of the model factors. These approaches allowed integrative understanding of DED and may be applied to other multifactorial diseases.
Acknowledgments
The authors would like to thank Jeremy D Keenan (Department of Ophthalmology, University of California San Francisco, San Francisco, CA) who inspired the authors to incorporate network analysis to show medical relevance. This work was supported by the National Research Foundation of Korea (NRF) grant funded by the Korean government (NRF-2019R1C1C1007663 and NRF-2017R1E1A1A03070934).
Conflicts of Interest
None declared.
References
1. Craig JP, Nelson JD, Azar DT, Belmonte C, Bron AJ, Chauhan SK, et al. TFOS DEWS II Report Executive Summary. Ocul Surf 2017 Oct;15(4):802-812. [doi: 10.1016/j.jtos.2017.08.003] [Medline: 28797892]
2. Stapleton F, Alves M, Bunya VY, Jalbert I, Lekhanont K, Malet F, et al. TFOS DEWS II Epidemiology Report. Ocul Surf 2017 Jul;15(3):334-365. [doi: 10.1016/j.jtos.2017.05.003] [Medline: 28736337]
3. Ahn JM, Lee SH, Rim THT, Park RJ, Yang HS, Kim TI, Epidemiologic Survey Committee of the Korean Ophthalmological Society. Prevalence of and risk factors associated with dry eye: the Korea National Health and Nutrition Examination Survey 2010-2011. Am J Ophthalmol 2014 Dec;158(6):1205-14.e7. [doi: 10.1016/j.ajo.2014.08.021] [Medline: 25149910] 4. Lee W, Lim SS, Won JU, Roh J, Lee JH, Seok H, et al. The association between sleep duration and dry eye syndrome
among Korean adults. Sleep Med 2015 Nov;16(11):1327-1331. [doi: 10.1016/j.sleep.2015.06.021] [Medline: 26498231] 5. Chun YH, Kim HR, Han K, Park YG, Song HJ, Na KS. Total cholesterol and lipoprotein composition are associated with
dry eye disease in Korean women. Lipids Health Dis 2013 Jun 5;12:84 [FREE Full text] [doi: 10.1186/1476-511X-12-84] [Medline: 23734839]
6. Chung SH, Myong JP. Are higher blood mercury levels associated with dry eye symptoms in adult Koreans? A population-based cross-sectional study. BMJ Open 2016 Apr 27;6(4):e010985 [FREE Full text] [doi:
10.1136/bmjopen-2015-010985] [Medline: 27121705]
7. Na KS, Han K, Park YG, Na C, Joo C. Depression, stress, quality of life, and dry eye disease in Korean women: a population-based study. Cornea 2015 Jul;34(7):733-738. [doi: 10.1097/ICO.0000000000000464] [Medline: 26002151] 8. Consejo A, Melcer T, Rozema JJ. Introduction to Machine Learning for Ophthalmologists. Semin Ophthalmol 2018 Nov
30:1-23. [doi: 10.1080/08820538.2018.1551496] [Medline: 30500302]
9. Korea Centers for Disease Control and Prevention. Korea National Health & Nutrition Examination Survey URL: https:/ /knhanes.cdc.go.kr/knhanes/eng/index.do [accessed 2019-12-31]
10. Kweon S, Kim Y, Jang MJ, Kim Y, Kim K, Choi S, et al. Data resource profile: the Korea National Health and Nutrition Examination Survey (KNHANES). Int J Epidemiol 2014 Feb;43(1):69-77 [FREE Full text] [doi: 10.1093/ije/dyt228] [Medline: 24585853]
11. Yoon KC, Choi W, Lee HS, Kim SD, Kim SH, Kim CY, et al. An overview of Ophthalmologic survey methodology in the 2008-2015 Korean National Health and Nutrition Examination Surveys. Korean J Ophthalmol 2015 Dec;29(6):359-367 [FREE Full text] [doi: 10.3341/kjo.2015.29.6.359] [Medline: 26635451]
12. Friedewald WT, Levy RI, Fredrickson DS. Estimation of the concentration of low-density lipoprotein cholesterol in plasma, without use of the preparative ultracentrifuge. Clin Chem 1972 Jun;18(6):499-502 [FREE Full text] [Medline: 4337382] 13. Padilla O. Merck Manuals. Blood Tests: Normal Values URL: https://www.merckmanuals.com/professional/appendixes/
normal-laboratory-values/blood-tests-normal-values#v8508809 [accessed 2019-12-31]
14. Ministry of Health and Welfare, The Korean Nutrition Society. Dietary reference intakes for Koreans 2015. Sejong: Ministry of Health and Welfare; Dec 31, 2015. URL: http://www.mohw.go.kr/react/jb/sjb030301vw.
jsp?PAR_MENU_ID=03&MENU_ID=032901&CONT_SEQ=337356
15. Austin PC, Lee DS, D'Agostino RB, Fine JP. Developing points-based risk-scoring systems in the presence of competing risks. Stat Med 2016 Sep 30;35(22):4056-4072 [FREE Full text] [doi: 10.1002/sim.6994] [Medline: 27197622]
16. Epskamp S, Cramer AO, Waldorp LJ, Schmittmann VD, Borsboom D. qgraph: network visualizations of relationships in psychometric data. J Stat Soft 2012;48(4):1639-1641. [doi: 10.18637/jss.v048.i04]
17. Pereira-Morales AJ, Adan A, Forero DA. Network analysis of multiple risk factors for mental health in young Colombian adults. J Ment Health 2019 Apr;28(2):153-160. [doi: 10.1080/09638237.2017.1417568] [Medline: 29265896]
18. Robinaugh DJ, Millner AJ, McNally RJ. Identifying highly influential nodes in the complicated grief network. J Abnorm Psychol 2016 Aug;125(6):747-757 [FREE Full text] [doi: 10.1037/abn0000181] [Medline: 27505622]
19. Therneau T, Atkinson B. 2019. rpart: Recursive Partitioning and Regression Trees URL: https://CRAN.R-project.org/ package=rpart [accessed 2019-12-31]
20. Kuhn M. 2019. caret: Classification and Regression Training URL: https://CRAN.R-project.org/package=caret [accessed 2019-12-31]
21. Revelle W. 2019. 2019. psych: Procedures for Psychological, Psychometric, and Personality Research URL: https://CRAN. R-project.org/package=psych [accessed 2019-12-31]
22. Friedman J, Hastie T, Tibshirani R. Regularization paths for generalized linear models via coordinate descent. J Stat Softw 2010;33(1):1-22 [FREE Full text] [Medline: 20808728]
23. Lumley T. 2019. survey: Analysis of Complex Survey Samples URL: https://CRAN.R-project.org/package=survey [accessed 2019-12-31]
24. Hocking TD. 2019. WeightedROC: Fast, Weighted ROC Curves URL: https://CRAN.R-project.org/package=WeightedROC [accessed 2019-12-31]
25. Wickham H. ggplot2: Elegant Graphics for Data Analysis. New York: Springer-Verlag; 2016.
26. Pasek J. 2018. weights: Weighting and Weighted Statistics URL: https://CRAN.R-project.org/package=weights [accessed 2019-12-31]
27. McNeish DM. Using Lasso for predictor selection and to assuage overfitting: a method long overlooked in behavioral sciences. Multivariate Behav Res 2015;50(5):471-484. [doi: 10.1080/00273171.2015.1036965] [Medline: 26610247] 28. Babyak MA. What you see may not be what you get: a brief, nontechnical introduction to overfitting in regression-type
models. Psychosom Med 2004;66(3):411-421. [doi: 10.1097/01.psy.0000127692.23278.a9] [Medline: 15184705] 29. Wan KH, Chen LJ, Young AL. Depression and anxiety in dry eye disease: a systematic review and meta-analysis. Eye
(Lond) 2016 Dec;30(12):1558-1567 [FREE Full text] [doi: 10.1038/eye.2016.186] [Medline: 27518547]
30. Yenigun A, Dadaci Z, Sahin GO, Elbay A. Prevalence of allergic rhinitis symptoms and positive skin-prick test results in patients with dry eye. Am J Rhinol Allergy 2016;30(2):e26-e29. [doi: 10.2500/ajra.2016.30.4275] [Medline: 26980382] 31. Yenigun A, Elbay A, Dogan R, Ozturan O, Ozdemir MH. A pilot study investigating the impact of topical nasal steroid
spray in allergic rhinitis patients with dry eye. Int Arch Allergy Immunol 2018;176(2):157-162. [doi: 10.1159/000488599] [Medline: 29734186]
32. Rathnakumar K, Ramachandran K, Baba D, Ramesh V, Anebaracy V, Vidhya R, et al. Prevalence of dry eye disease and its association with dyslipidemia. J Basic Clin Physiol Pharmacol 2018 Mar 28;29(2):195-199. [doi:
10.1515/jbcpp-2017-0001] [Medline: 29150990]
33. Ooi KG, Lee MH, Burlutsky G, Gopinath B, Mitchell P, Watson S. Association of dyslipidaemia and oral statin use, and dry eye disease symptoms in the Blue Mountains Eye Study. Clin Exp Ophthalmol 2019 Mar;47(2):187-192. [doi: 10.1111/ceo.13388] [Medline: 30203595]
34. Zhao L, Chen X, Zhu J, Xi Y, Yang X, Hu L, et al. Lanosterol reverses protein aggregation in cataracts. Nature 2015 Jul 30;523(7562):607-611. [doi: 10.1038/nature14650] [Medline: 26200341]
35. Makley LN, McMenimen KA, DeVree BT, Goldman JW, McGlasson BN, Rajagopal P, et al. Pharmacological chaperone for α-crystallin partially restores transparency in cataract models. Science 2015 Nov 6;350(6261):674-677 [FREE Full text] [doi: 10.1126/science.aac9145] [Medline: 26542570]
36. Yamauchi Y, Rogers MA. Sterol Metabolism and Transport in Atherosclerosis and Cancer. Front Endocrinol (Lausanne) 2018;9:509 [FREE Full text] [doi: 10.3389/fendo.2018.00509] [Medline: 30283400]
38. Dry Eye Assessment and Management Study Research Group, Asbell PA, Maguire MG, Pistilli M, Ying GS, Szczotka-Flynn LB, et al. n-3 Fatty Acid Supplementation for the Treatment of Dry Eye Disease. N Engl J Med 2018 May
3;378(18):1681-1690 [FREE Full text] [doi: 10.1056/NEJMoa1709691] [Medline: 29652551]
39. Serhan CN, Chiang N, van Dyke TE. Resolving inflammation: dual anti-inflammatory and pro-resolution lipid mediators. Nat Rev Immunol 2008 May;8(5):349-361 [FREE Full text] [doi: 10.1038/nri2294] [Medline: 18437155]
40. Clayton JA. Dry Eye. N Engl J Med 2018 Jun 7;378(23):2212-2223. [doi: 10.1056/NEJMra1407936] [Medline: 29874529]
Abbreviations
AUC: area under the curve DED: dry eye disease
KCDC: Korea Centers for Disease Control and Prevention
KNHANES: Korea National Health and Nutrition Examination Survey MGD: Meibomian gland dysfunction
NRF: National Research Foundation of Korea OR: odds ratio
ROC: receiver-operating characteristic
Edited by G Eysenbach; submitted 06.09.19; peer-reviewed by DA Forero, J Bian; comments to author 29.10.19; revised version received 23.11.19; accepted 16.12.19; published 20.02.20
Please cite as:
Nam SM, Peterson TA, Butte AJ, Seo KY, Han HW
Explanatory Model of Dry Eye Disease Using Health and Nutrition Examinations: Machine Learning and Network-Based Factor Analysis From a National Survey
JMIR Med Inform 2020;8(2):e16153
URL: http://medinform.jmir.org/2020/2/e16153/
doi: 10.2196/16153
PMID:
©Sang Min Nam, Thomas A Peterson, Atul J Butte, Kyoung Yul Seo, Hyun Wook Han. Originally published in JMIR Medical Informatics (http://medinform.jmir.org), 20.02.2020. This is an open-access article distributed under the terms of the Creative Commons Attribution License (https://creativecommons.org/licenses/by/4.0/), which permits unrestricted use, distribution, and reproduction in any medium, provided the original work, first published in JMIR Medical Informatics, is properly cited. The complete bibliographic information, a link to the original publication on http://medinform.jmir.org/, as well as this copyright and license information must be included.