Received: 7 January 2014 Revised: 29 December 2014 Accepted: 20 January 2015 doi: 10.1259/bjr.20140040
Cite this article as:
Shim SS, Oh Y-W, Kong KA, Ryu YJ, Kim Y, Jang DH. Pulmonary nodule size evaluation with chest tomosynthesis and CT: a phantom study. Br J Radiol 2015;88:20140040.
FULL PAPER
Pulmonary nodule size evaluation with chest tomosynthesis
and CT: a phantom study
1S S SHIM,2Y-W OH,3K A KONG,4Y J RYU,1Y KIM and1D H JANG
1Department of Radiology, Mokdong Hospital, Ewha Womans University School of Medicine, Seoul, Republic of Korea 2
Department of Radiology, Korea University Anam Hospital and Korea University College of Medicine, Seoul, Republic of Korea 3Clinical Trial Center, Ewha Womans University Medical Center, Seoul, Republic of Korea
4Department of Internal Medicine, Mokdong Hospital, Ewha Womans University School of Medicine, Seoul, Republic of Korea
Address correspondence to: Yu-Whan Oh E-mail:yuwhan@kumc.or.kr
Objective: We compared digital tomosynthesis (TOMO) and chest CT in terms of assessing the sizes of nodules located in zones where evaluation by simple radiography is limited. Methods: A total of 48 images comprising phantom nodules of four sizes in six different locations were used. Nodule size measurement errors for measurements using TOMO and CT images compared with the actual size from each observer were calculated. The inter- and intra-observer repeatability of the measured values and the agreement between the two techniques were assessed using the method described by Bland and Altman. Results: The mean measurement errors for all of the nodules and four observers were 20.84 mm [standard deviation (SD), 0.60 mm] on TOMO and20.18 mm (SD,
0.71 mm) on CT images. The mean measurement errors for the different observers ranged from21.11 to 20.55 mm for TOMO and from20.39 to 0.08 mm for CT. Assessing the agreement between nodule size measurements using TOMO and CT resulted in mean measurement errors of 20.65 mm, with a 95% limit of agreement of 22.53 to 1.22 mm for comparison of TOMO with CT.
Conclusion: Our results suggest that nodule sizes obtained using TOMO and chest CT are comparable, even for nodules located in areas where the size measurement is limited on simple radiography.
Advances in knowledge: TOMO and CT can be used interchangeably, even for nodules located in a blind area on simple radiography.
Solitary lung nodule detection has increased owing to the widespread use of CT imaging. Nevertheless, the most commonly used routine examination for lung nodules continues to be chest radiography, because it uses low ra-diation doses, is economical and is easy to use. Because chest radiographic images are two-dimensional projections of three-dimensional structures, early lung cancer detection on chest radiographs is often challenging. The projection of pulmonary vessels, bones and part of the mediastinum on lungfields often partially or completely obscures the pul-monary nodules, resulting in failure by the radiologist to detect lung nodules.1,2
Digital tomosynthesis (TOMO) has recently been applied to chest imaging for the detection of subtle nodules on simple radiography, with promising results.3,4 It has been introduced as a modality with the potential to provide images similar to CT but at a comparably reduced cost and radiation exposure.4James et al5reported that 74% of lung nodules$4 mm in diameter that can be identified on CT
reported that 92% of nodules $4 mm in diameter are detectable using TOMO. In 2012, Johnsson et al7compared the ability of TOMO and CT to detect nodule size in 20 patients and found that both methods could be used interchangeably for these measurements. This result calls for caution, however, because the limit of agreement (LOA) between the modalities is wider than for the intraobserver variability of each modality.
Based on these studies, we hypothesized that TOMO is comparable to CT imaging for the detection of nodules located in areas where size measurement is limited using simple chest radiography because of overlapping structures. The purpose of this study was to assess the size de-termination of nodules located in these zones by TOMO and chest CT.
METHODS AND MATERIALS
Thorax phantom and model nodule preparation The thorax phantom N1 (Kyoto Kagaku Co., Ltd,
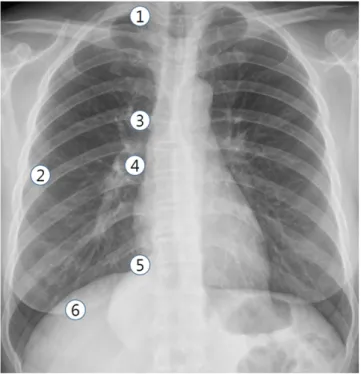
(i.e. polyurethane, epoxy resin, calcium carbonate). Model nodules with a homogeneous composition of solid-type ure-thane foam nodules of four sizes (3, 5, 8 and 10 mm) were used. Nodules were placed in six lung zones: the right apex, middle of the right subpleural lung parenchyma, right upper hilum, right lower hilum, right diaphragmatic angle of the heart (right car-diophrenic angle) and the right lower retrohepatic lung paren-chyma (Figure 1).
Chest CT
A total of 48 phantom sets, comprising 4 nodule sizes, 6 loca-tions and 2 imaging modalities, were included in the present study. We used a 64-channel CT scanner (Somatom® Definition scanner; Siemens Healthcare, Forchheim, Germany) for chest CT. The scanning parameters were as follows: individual de-tector width, 0.625 mm; gantry rotation time, 0.5 s; tube voltage, 120 kVp; tube current, 30 mA; and pitch, 1. Axial images were reconstructed using a section of 2 mm in thickness, the B70 kernel (Siemens Healthcare) and a 345-mmfield of view. Digital tomosynthesis
TOMO examinations were performed using a commercially available unit (Sonialvision Safire II; Shimadzu Co., Kyoto, Japan) with aflat-panel detector system. We altered the digital TOMO parameters to establish a lower radiation dose condition that was suitable for chest imaging. 74 low-dose projection images were acquired within 4.85 s using a tube voltage of 120 kVp and 0.04 mA. The detector was fixed into position, whereas the X-ray tube was subjected to vertical continuous movement, from220° to 120°, around the standard orthogonal posteroanterior position, and image data were acquired. A total
of 74 projection images were obtained from 1 examination and were used to reconstruct 84 coronal images with a 2-mm re-construction interval.
Radiation dose
For the radiation dose assessment in TOMO, a dosemeter (UnforsThinX Intra; Unfors Instruments AB, Billdal, Sweden) that was attached to the centre and surface of the chest phantom (N1) recorded the absorption dose. The absorbed dose at the phantom surface for TOMO was 0.7 mGy, and the absorbed dose at the phantom centre was 0.2 mGy.
Pulmonary nodule measurement
Four radiologists with 15, 4, 3 and 1 years’ experience in chest image interpretation participated in the study. A total of 48 images, comprising nodules of 4 sizes in 6 different loca-tions and arranged in random order by the ViewDEX soft-ware (S¨odra ¨Alvsborgs Sjukhus, Sahlgrenska University and University of Gothenburg, Gothenburg, Sweden), were used. Observers were blinded to the location and size of the nodules in the phantom model (Figure 2). They measured the left-to-right diameter and recorded the longest length. The use of zoom or enlarge tool was freely available, and the window
Figure 1. Six locations of phantom nodules: (1) right apex; (2) middle of the right subpleural lung parenchyma; (3) right upper hilum; (4) right lower hilum; (5) right cardiophrenic angle; and (6) right retrohepatic lung parenchyma.
Figure 2. Images of the thorax phantom performed with chest tomosynthesis (TOMO) (a, c) and chest CT (b, d) with a phantom nodule (arrows). (a, b) A 3-mm nodule in the right apex is observed on TOMO (measured as 2.38 mm) (a) and also noted on CT (2.28 mm) (b). (c, d) A 5-mm nodule in the middle of the right subpleural lung parenchyma is seen on TOMO (4.36 mm) (c) and CT (5.00 mm) (d).
centre/width for CT was2750/1500 HU, whereas the window width for TOMO was 3000–4500 HU. These values are clin-ically relevant. All of the measurements were repeated at 20-day intervals to assess intraobserver variation.
Statistical analysis
Nodule size measurement errors for measurement on TOMO and CT images compared with the actual size from each ob-server were calculated. The results are presented as means6 standard deviations (SDs) and 95% confidence intervals (95% CI) of the mean. For the inter- and intraobserver repeatability of the measured values, the agreement between the two techniques was assessed using the method described by Bland and Altman.8
The 95% LOA was calculated as the mean difference6 1.96 SD of the difference.
RESULTS
Upon initial measurement, one observer judged two of the 3-mm nodules as being missed on the TOMO modality; one observer judged three of the 3-mm nodules as being missed on the CT modality; while another observer judged one of these nodules as being missed on CT. Upon their second evaluation, one observer judged two of the 3-mm nodules as being missed on TOMO and one 3-mm nodule as being missed on CT.
The number of measured phantom nodules and mean relative errors for CT and TOMO measurements for each observer are
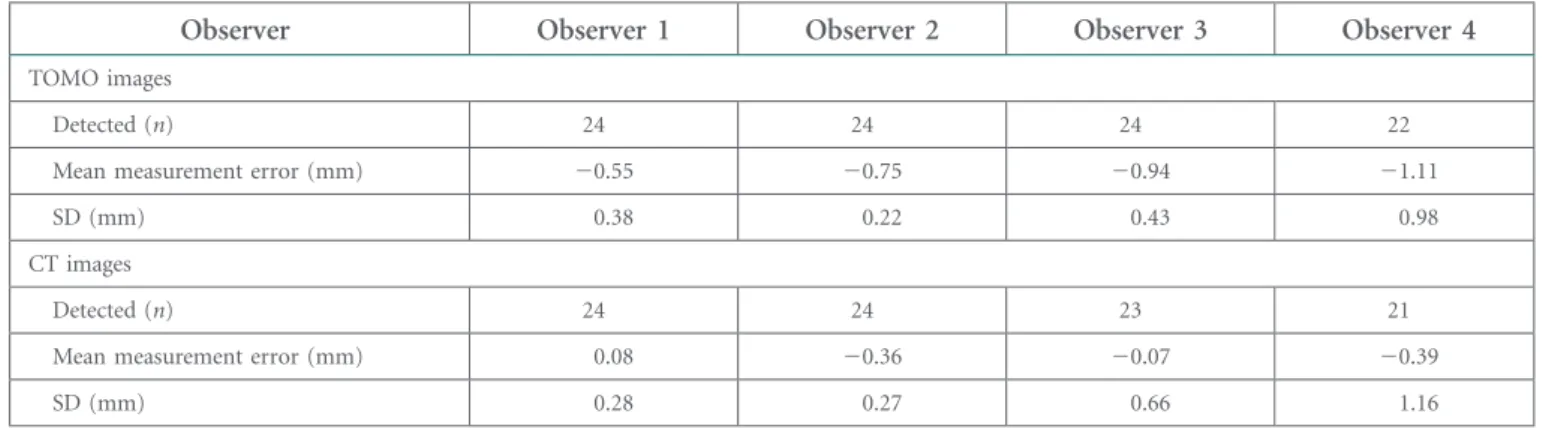
Table 1. Number of detected nodules, mean relative error and standard deviation (SD) for each observer regarding measurements on tomosynthesis (TOMO) and CT images
Observer Observer 1 Observer 2 Observer 3 Observer 4
TOMO images
Detected (n) 24 24 24 22
Mean measurement error (mm) 20.55 20.75 20.94 21.11
SD (mm) 0.38 0.22 0.43 0.98
CT images
Detected (n) 24 24 23 21
Mean measurement error (mm) 0.08 20.36 20.07 20.39
SD (mm) 0.28 0.27 0.66 1.16
Figure 3. Measurement error for each observer and each nodule on tomosynthesis images compared with the known diameter of the nodule. Dashed line (centre) represents the mean measurement error for all nodules and observers. Small dashed lines (top and bottom) represent the mean measure-ment error62 standard deviation.
Figure 4. Measurement error for each observer and each nodule on CT images compared with the known diameter of the nodules. Dashed line (centre) represents the mean measurement error for all nodules and observers. Small dashed lines (top and bottom) represent the mean measurement error 62 standard deviation.
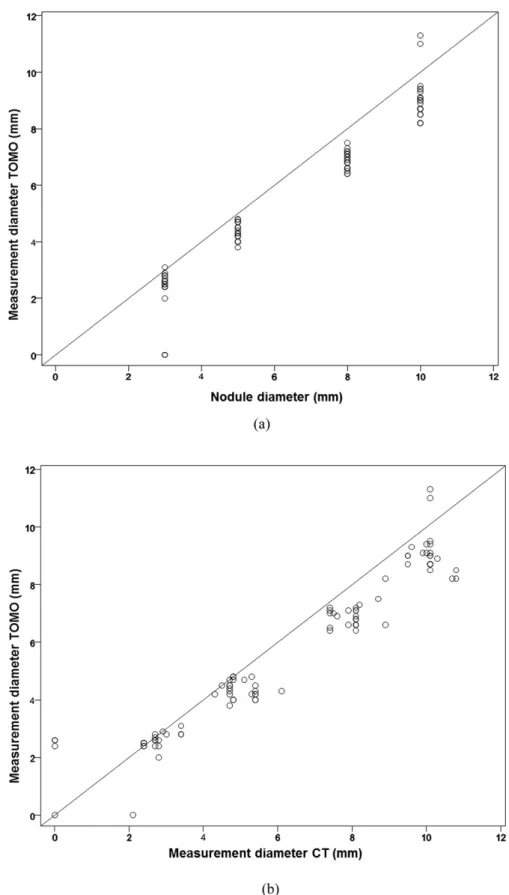
Figure 5. Plots show (a) manual measurement data from tomosynthesis (TOMO) images for the diameters of all nodules and observers plotted against the actual size and (b) manual measurement data from CT images. In the plots, the 45° line of equality is drawn to help assess the agreement between the measurements. Plots illustrate that the agreement between measurements on TOMO and the actual nodule size show a similar pattern with the agreement between measurement on TOMO and CT.
provided inTable 1. The mean measurement error for all of the nodules and observers was20.84 mm (SD, 0.60; 95% CI, 20.96 to20.72 mm) on TOMO and 20.18 mm (SD, 0.71; 95% CI, 20.33 to 20.04 mm) on CT images.
The absolute measurement errors for each observer and each nodule on TOMO and CT images are provided inFigures 3and
4. On average, all of the manual measurements on both chest TOMO and CT images underestimated the nodule size, with the exception of one observer using CT.Figure 5shows the manual measurement data from TOMO images for the diameters of all nodules and observers plotted against the actual size and manual
measurement data from CT images. The mean measurement errors for the different observers ranged from 21.11 to 20.55 mm for TOMO and from 20.39 to 0.08 for CT. The mean measurement errors with an LOA for each observer and size are provided inTable 2.
The intra- and interobserver 95% LOA for each imaging type are provided inTable 3. The intraobserver 95% LOA for the diameter measurements calculated using the mean of the two measurements as a reference ranged from20.42 to 0.50 mm for the least variable observer to21.85 to 2.31 mm for the most variable observer using the TOMO modality. For CT measurements, the intraobserver
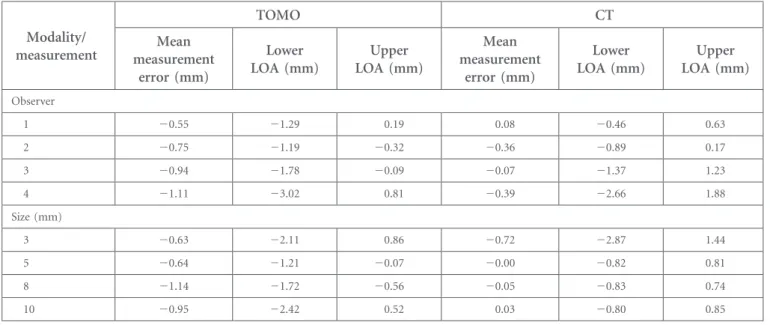
Table 2. Mean measurement error and limit of agreement (LOA) for real size of the nodules by each observer and size
Modality/ measurement TOMO CT Mean measurement error (mm) Lower LOA (mm) Upper LOA (mm) Mean measurement error (mm) Lower LOA (mm) Upper LOA (mm) Observer 1 20.55 21.29 0.19 0.08 20.46 0.63 2 20.75 21.19 20.32 20.36 20.89 0.17 3 20.94 21.78 20.09 20.07 21.37 1.23 4 21.11 23.02 0.81 20.39 22.66 1.88 Size (mm) 3 20.63 22.11 0.86 20.72 22.87 1.44 5 20.64 21.21 20.07 20.00 20.82 0.81 8 21.14 21.72 20.56 20.05 20.83 0.74 10 20.95 22.42 0.52 0.03 20.80 0.85 TOMO, tomosynthesis.
Table 3. Intra- and interobserver mean measurement error by observer
Modality/ measurement TOMO CT Mean measurement error (mm) Lower LOA (mm) Upper LOA (mm) Mean measurement error (mm) Lower LOA (mm) Upper LOA (mm) Intraobserver 1 0.04 20.42 0.50 20.08 20.75 0.58 2 20.20 20.68 0.28 20.43 21.01 0.16 3 0.06 20.44 0.57 20.14 21.30 1.03 4 0.23 21.85 2.31 20.01 22.47 2.45 Interobserver 1 and 2 0.20 20.31 0.71 0.44 20.34 0.22 1 and 3 0.38 20.06 0.83 0.15 21.22 1.53 1 and 4 0.55 21.49 2.59 0.48 21.72 2.67 2 and 3 0.18 20.46 0.83 20.29 21.58 1.00 2 and 4 0.35 21.52 2.22 0.03 22.12 2.19 3 and 4 0.17 22.02 2.36 0.32 21.49 2.13
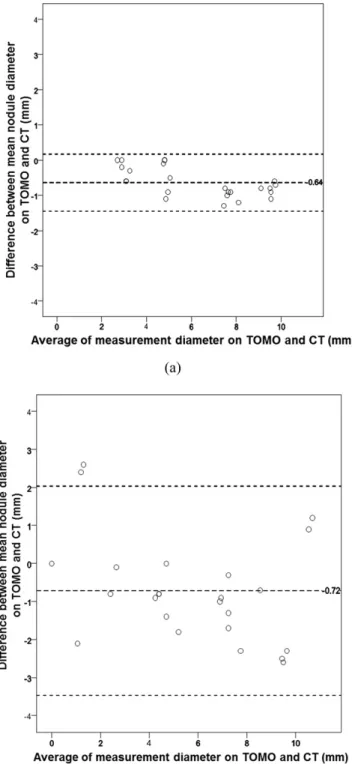
95% LOA ranged from 20.75 to 0.58 mm and 22.47 to 2.45 mm for the least and most variable observer, respectively. The interobserver 95% LOA concerning the diameter estimates for each possible pair of radiologists ranged from 20.06 to 0.83 mm for the least variable pair of radiologists to22.02 to 2.36 mm for the most variable pair of radiologists using the TOMO modality. For measurements using the CT modality, the interobserver 95% LOA ranged from 20.34 to 0.22 mm and from22.12 to 2.19 mm for the least and most variable observer pairs, respectively. Assessing the agreement between the nodule size measurements using TOMO and CT by the difference be-tween the observers’ mean diameter measurement for the two modalities resulted in mean measurement errors of20.65 mm (95% CI, 20.91 to 20.40) with a 95% LOA of 22.53 to 1.22 mm for the comparison of TOMO and CT. Bland–Altman plots illustrating the agreement are provided inFigure 6.
The 95% LOA of the diameter measurements for individual observers using TOMO and CT images ranged from21.16 to 0.37 mm for the least variable observer to23.47 to 2.04 mm for the most variable observer. The 95% LOA for all of the observers and sizes regarding the measurement of the nodule diameter on TOMO and CT are provided inTable 4. Bland–Altman plots of
the agreement between measurements on TOMO and CT images for the most and least experienced radiologists are shown inFigure 7.
DISCUSSION
We evaluated TOMO-derived parameters, including nodule di-ameter, repeatability of TOMO observations and the extent of
agreement between TOMO data and those acquired by CT. A recent study found that the repeatability values of manual measurements made by TOMO and CT were comparable.7 In the cited study, clinical nodules that were considered adequately segmented were investigated. However, missed nodules on simple radiography are usually at the apices, lung bases or in central locations adjacent to vessels. It is difficult to perform adequate segmentation (not to get confused by the adjacent structures inside or beside the lesion) of such nodules.9 Several TOMO phantom studies have reported limited un-derestimation of the actual size, whereas studies using CT have found underestimated or overestimated nodule sizes.7,10,11In the present study, both modalities underestimated the diameters of phantom nodules. TOMO appeared to slightly underestimate the nodule size (mean measurement error, 20.84 mm); how-ever, such an error is clinically relevant because nodule man-agement is based on an absolute nodule size threshold. In addition, we found that CT slightly underestimated the nodule size (mean measurement error,20.18 mm).
The extent of nodule size underestimation by TOMO was somewhat more marked than that affected by nodule de-lineation.12,13 Such artefacts were mostly investigated in TOMO images for the breasts.14,15Although we measured the nodule diameters from left to right (thus, not in the direction of the scan), darker areas created a halo around the nodule. This halo was not included in manual measurements of the nodule diameter, a factor that affected the results. A more relevant issue is the possible effect of in-plane artefacts on clinical images. Recently, underestimation of nodule size as-sociated with manual measurement of clinical nodules on TOMO has been reported.7
Svahn et al16found that the extent of in-plane artefacts varied
linearly with the spherical diameter and relative contrast of
Figure 6. A Bland–Altman plot illustrating the agreement between two modalities. Dashed line (centre), mean difference [20.65 mm (95% confidence interval, –0.91 to –0.40)]. Dashed lines (top and bottom), upper and lower limits of agreement. TOMO, tomosynthesis.
Table 4. Mean measurement error at tomosynthesis (TOMO) in comparison with CT by observer and size
TOMO compared with CT Mean measurement error (mm) Lower LOA (mm) Upper LOA (mm) Observer 1 20.64 21.45 0.17 2 20.40 21.16 0.37 3 20.87 22.69 0.96 4 20.72 23.47 2.04 Size (mm) 3 0.09 22.46 2.64 5 20.64 21.63 0.35 8 21.09 22.07 20.12 10 20.98 22.60 0.64
nodules. Their finding that the tendency towards size un-derestimation on TOMO images escalated with an increase in nodule diameter seems to be consistent with our results. The contrast afforded by the 40° acquisition angle of our TOMO images may be greater than that of the images produced in the study by Johnsson et al17 in 2010, who used an acquisition
angle of 30°. This contrast might aggravate in-plane artefacts and underestimate the size of larger nodules because the contrast in TOMO images increases as acquisition angle rises. Despite these limitations of TOMO, our present phantom study suggested that the measurement values on CT and TOMO were comparable; the mean difference was20.65 mm. Even with larger nodules ($5 mm in diameter), the mean difference was less than21.1 mm.
Regarding repeatability, the interobserver 95% LOA for mea-suring TOMO diameters by the pair of radiologists who recor-ded the most similar results was20.06 to 0.83 mm, the values were similar to the CT data. These values were slightly less than the variation of21.3 to 1.5 mm in the measurement of clinical nodules reported by Johnsson et al7in 2012. The intraobserver agreement was of similar magnitude. It is possible that the even shape of the phantom nodules was associated with less variation in measurements than in clinical nodules. We found that TOMO data, including measurement errors, intra- and interobserver agreement levels and LOAs, improved in proportion to the years of experience. This is also true of CT measurements.
Our study had several limitations. One major drawback in the measurement study in the phantom nodule was that the observers could guess the true sizes of the studied objects during the two observations, resulting in increased repeatability; thus, we sought to make observers completely unaware of the nodule size and location by presenting random images taken using ei-ther imaging modality. In addition, the intrinsic limitation of TOMO discussed above has affected our results. Optimization of TOMO technique, including the plane and angle of acquisition, and construction of the phantom nodule require further work. A clinical nodule may vary in shape. Thus, a limitation of TOMO is that the size can be estimated only in a single plane, whereas multidetector CT is three dimensional. However, the thoracic coronal projection of TOMO is larger than the routine axial image afforded by CT; therefore, it is possible to measure the superior to inferior nodule diameter on TOMO images more rapidly than is possible using CT data. Moreover, the entire thorax is presented by TOMO with less radiation and a shorter study time than by CT. Therefore, TOMO should be considered for nodule detection and follow up for young patients (particularly young women with a risk of breast cancer), and probable benign lesions.
CONCLUSIONS
Our results suggest that the nodule sizes obtained using TOMO and chest CT are comparable, even for nodules located in areas where size measurement is limited on simple radiography, because the size difference was ,1 mm, the LOAs were of similar width and the repeatability values were similar. How-ever, measurements made by TOMO tended to be smaller than those by CT, and this tendency amplified as the nodule di-ameter increased, which may be of concern if TOMO and CT are to be used interchangeably during nodule follow-up. These concerns may be alleviated in the near future by upgrading TOMO to reduce the number of artefacts encountered in clinical practice.
Figure 7. The plots show the difference between the nodule diameter measurement on tomosynthesis (TOMO) and CT against the average of the measurements for (a) the most experienced radiologist and (b) the least experienced radiologist.
REFERENCES
1. Brogdon BG, Kelsey CA, Moseley RD Jr. Factors affecting perception of pulmonary lesions. Radiol Clin North Am 1983;21: 633–54.
2. Shah PK, Austin JH, White CS, Patel P, Haramati LB, Pearson GD, et al. Missed non-small cell lung cancer: radiographicfindings of potentially resectable lesions evident only in retrospect. Radiology 2003;226: 235–41. 3. Gomi T, Nakajima M, Fujiwara H, Takeda T,
Saito K, Umeda T, et al. Comparison between chest digital tomosynthesis and CT as a screening method to detect artificial pulmonary nodules: a phantom study. Br J Radiol 2012;85: e622–9. doi:10.1259/bjr/ 12643098
4. Svalkvist A, Johnsson AA, Vikgren J, Hakansson M, Ullman G, Boijsen M, et al. Evaluation of an improved method of simulating lung nodules in chest tomosyn-thesis. Acta Radiol 2012;53: 874–84. doi: 10.1258/ar.2012.120230
5. James TD, McAdams HP, Song JW, Li CM, Godfrey DJ, DeLong DM, et al. Digital tomosynthesis of the chest for lung nodule detection: interim sensitivity results from an ongoing NIH-sponsored trial. Med Phys 2008;35: 2554–7.
6. Vikgren J, Zachrisson S, Svalkvist A, Johnsson AA, Boijsen M, Flinck A, et al. Comparison of chest tomosynthesis and
chest radiography for detection of pulmo-nary nodules: human observer study of clinical cases. Radiology 2008;249: 1034–41. doi:10.1148/radiol.2492080304
7. Johnsson AA, Fagman E, Vikgren J, Fisichella VA, Boijsen M, Flinck A, et al. Pulmonary nodule size evaluation with chest tomosynthesis. Radiology 2012;265: 273–82. 8. Bland JM, Altman DG. Statistical methods for assessing agreement between two methods of clinical measurement. Lancet 1986;1: 307–10. 9. Girvin F, Ko JP. Pulmonary nodules:
de-tection, assessment, and CAD. AJR Am J Roentgenol 2008;191: 1057–69. doi:10.2214/ AJR.07.3472
10. Willemink MJ, Leiner T, Budde RP, de Kort FP, Vliegenthart R, van Ooijen PM, et al. Systematic error in lung nodule volumetry: effect of iterative reconstruction versusfiltered back projection at different CT parameters. AJR Am J Roentgenol 2012;199: 1241–6. doi:10.2214/AJR.12.8727
11. Revel MP, Bissery A, Bienvenu M, Aycard L, Lefort C, Frija G. Are two-dimensional CT measurements of small noncalcified pulmo-nary nodules reliable? Radiology 2004;231: 453–8.
12. Tingberg A, Zackrisson S. Digital mammog-raphy and tomosynthesis for breast cancer diagnosis. Expert Opin Med Diagn 2011;5: 517–26. doi:10.1517/17530059.2011.616492
13. Hu YH, Zhao B, Zhao W. Image artifacts in digital breast tomosynthesis: investiga-tion of the effects of system geometry and reconstruction parameters using a linear system approach. Med Phys 2008;35: 5242–52.
14. Svahn T, Ruschin M, Hemdal B, Nyhlen L, Andersson I, Timberg P, et al. Inplane artifacts in breast tomosynthesis quantified with a novel contrast-detail phantom. Proc SPIE 2007;6510: 65104R.
15. Tucker AW, Lu J, Zhou O. Dependency of image quality on system configuration parameters in a stationary digital breast tomosynthesis system. Med Phys 2013;40: 031917. doi:10.1118/1.4792296
16. Svahn T, Hemdal B, Ruschin M,
Chakraborty DP, Andersson I, Tingberg A, et al. Dose reduction and its influence on diagnostic accuracy and radiation risk in digital mammography: an observer perfor-mance study using an anthropomorphic breast phantom. Br J Radiol 2007;80: 557–62.
17. Johnsson AA, Svalkvist A, Vikgren J, Boijsen M, Flinck A, Kheddache S, et al. A phantom study of nodule size evaluation with chest tomosynthesis and computed tomography. Radiat Prot Do-simetry 2010;139: 140–3. doi:10.1093/ rpd/ncq003
![Figure 6. A Bland –Altman plot illustrating the agreement between two modalities. Dashed line (centre), mean difference [ 20.65 mm (95% confidence interval, –0.91 to –0.40)]](https://thumb-ap.123doks.com/thumbv2/123dokinfo/5113439.83758/6.892.67.422.211.580/figure-altman-illustrating-agreement-modalities-difference-confidence-interval.webp)