저작자표시-비영리-변경금지 2.0 대한민국 이용자는 아래의 조건을 따르는 경우에 한하여 자유롭게 l 이 저작물을 복제, 배포, 전송, 전시, 공연 및 방송할 수 있습니다. 다음과 같은 조건을 따라야 합니다: l 귀하는, 이 저작물의 재이용이나 배포의 경우, 이 저작물에 적용된 이용허락조건 을 명확하게 나타내어야 합니다. l 저작권자로부터 별도의 허가를 받으면 이러한 조건들은 적용되지 않습니다. 저작권법에 따른 이용자의 권리는 위의 내용에 의하여 영향을 받지 않습니다. 이것은 이용허락규약(Legal Code)을 이해하기 쉽게 요약한 것입니다. Disclaimer 저작자표시. 귀하는 원저작자를 표시하여야 합니다. 비영리. 귀하는 이 저작물을 영리 목적으로 이용할 수 없습니다. 변경금지. 귀하는 이 저작물을 개작, 변형 또는 가공할 수 없습니다.
농학석사 학위논문
Spatial distribution analysis of
Black-legged Kittiwakes and Northern Fulmars
in Svalbard coastal cliffs
using remotely piloted aircraft system
원격조종항공기시스템을 활용한 스발바르 해안절벽의
세가락갈매기 및 풀머갈매기에 대한 공간 분포 분석
2020 년 8 월
서울대학교 대학원
산림과학부 산림환경학전공
박 미 진
Spatial distribution analysis of
Black-legged Kittiwakes and Northern Fulmars
in Svalbard coastal cliffs
using remotely piloted aircraft system
원격조종항공기시스템을 활용한 스발바르 해안절벽의
세가락갈매기 및 풀머갈매기에 대한 공간 분포 분석
지도 교수 임 상 준
이 논문을 농학석사 학위논문으로 제출함
2020 년 8 월
서울대학교 대학원
산림과학부 산림환경학전공
박 미 진
박미진의 농학석사 학위논문을 인준함
2020 년 7 월
위 원 장 (인)
부위원장 (인)
위 원 (인)
Abstract
It is crucial to estimate the exact number of individuals and to understand population dynamics in conservation biology. Although seabirds play an important role as top predators in marine ecosystems, low accessibility often limits effective monitoring on colonial cliff-nesting seabirds in coastal cliffs. In this study, the remotely piloted aircraft system (RPAS) was applied to investigate colonial cliff-nesting seabirds, especially Black-legged Kittiwakes (Rissa tridactyla) and Northern Fulmars (Fulmarus glacialis), in the extreme environment of the Norwegian Svalbard archipelago in the Arctic Ocean.
During the breeding season in 2018 and 2019, RGB (red, green, and blue) and thermal images of coastal cliffs were acquired from RPAS to construct three-dimensional models of study sites. These models were then used to count total seabirds and analyze spatial distribution of kittiwakes and fulmars. The models composed of RPAS-driven RGB and thermal images were compared with the photos taken by a researcher on the ground, where visible or hidden areas on the observer points were determined by viewshed analysis of GIS (Geographic Information System) software. Thermal images were processed according to temperature values and pixel sizes, and examples of composite uses with RGB images were also suggested. The density, which was defined as the mean value of the number of neighboring adult kittiwakes within a radius of 0.8m distance, was calculated, and the relationship between the density and each colony size was examined. Also, the fulmar chicks were observed to investigate the occupation of similar nest site in Steinflåstupet where the surveys were conducted over two years in the same way.
The counting result of the Irgensfjellet colony suggested that on average 1.6 times more kittiwakes were detected in the RPAS-driven RGB image model than in merged photos taken by a ground observer. On the other hand, the counts were not significantly different among models at Krykkjefjellet, which had a higher proportion of visible areas than Irgensfjellet, because topography was accessible enough to observe. This study also confirmed the complementary potential of
thermal images in seabird monitoring associated with RGB images to discover cryptic individuals. In addition, semi-automated counting of seabirds was possible when the range of the temperature values and pixel sizes were properly adjusted and sorted. RPAS data to estimate the densities of adult kittiwakes demonstrated that the traditional observation may commit errors, which may lead to overestimate the kittiwake density than that of three-dimensional models. Same nest sites were occupied over two years in that seven fulmar chicks detected in 2019 were all settled in the already observed nest site of 2018.
In conclusion, RPAS may act as a considerable tool for monitoring of cliff-nesting seabirds when RGB and thermal camera were combined. An analysis on the density and spatial distribution would be extendedly applied on other cliff-nesting seabirds. Like fulmars with high nest site preferences, nest site changes over the years could be recorded by RPAS with respect to long-term monitoring.
Keyword: RPAS, Svalbard seabird, coastal cliff, cliff-nesting, colonial breeding,
Black-legged Kittiwake, Northern Fulmar
Table of contents
Abstract ... i
Table of contents ... iii
List of tables ... v
List of figures ... vi
Chapter 1. Introduction ... 1
1.1. Study background ... 1
1.2. Purpose of research ... 2
Chapter 2. Literature review ... 4
2.1. Seabirds in the Svalbard Archipelago ... 4
2.2. Cliff-nesting adaptation ... 6
2.3. Colonial breeding ... 6
2.4. Precedent monitoring method ... 7
Chapter 3. Materials and methods ... 9
3.1. Study sites and period ... 9
3.2. Image acquisition ... 11
3.3. Model construction and manual counting ... 14
3.4. Seabird identification through RGB and thermal images .. 15
3.5. Comparison among colonies and inter-annual change ... 16
Chapter 4. Results ... 18
4.1. Image acquisition and model construction ... 18
4.2. Reliable counts through post processing ... 20
4.3. Seabird identification and survey results ... 23
Chapter 5. Discussion ... 36
5.1. Applicability of RPAS on monitoring seabirds ... 36
5.2. Usage of thermal images ... 37
5.3. Density measurements ... 38
5.4. Long-term monitoring ... 39
Chapter 6. Conclusions ... 40
References ... 41
Appendix ... 47
Abstract in Korean ... 69
List of tables
Table 1. Precedent studies of colonial cliff-nesting seabirds ... 8
Table 2. Population sizes of the Black-legged Kittiwake (Rissa
tridactyla) near Ny-Ålesund in the summer seasons ... 28
Table 3. Population sizes of the Northern Fulmar (Fulmarus glacialis)
near Ny-Ålesund in the summer seasons ... 29
Table 4. Population sizes of other seabird species near Ny-Ålesund in
this study ... 30
Table 5. The comparison of inter-annual nest site changes in
Steinflåstupet ... 37
List of figures
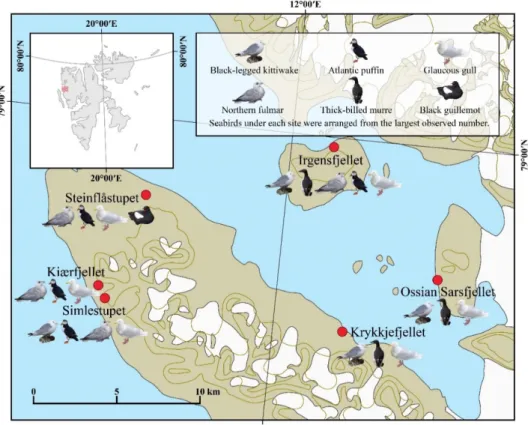
Figure 1. The map of the Svalbard Archipelago and six study sites of
Svalbard coastal cliffs. ... 11
Figure 2. Overall flight scheme to a targeted colony. ... 14
Figure 3. Two ways to calculate the density of adult kittiwakes within
a small colony in Krykkjefjellet. ... 17
Figure 4. Site images during the flight, taken on the coastal cliff. ..
... 21
Figure 5. Box-whisker plots of manual counts with different images
in Krykkjefjellet and (B). ... 23
Figure 6. The calculation of viewsheds in (A) Krykkjefjellet (visible
area: 34.3% of DEM raster grid) and (B) Irgensfjellet (visible area: 17.6%
of DEM raster grid). ... 24
Figure 7. Examples of complementary use of thermal images in (A)
Irgensfjellet and (B) Kiærfjellet. ... 26
Figure 8. Examples of semi-automated counts with thermal images in
Ossian Sarsfjellet (A) subcolony D and (B) subcolony A. ... 28
Figure 9. The map of observed species observed by ground-based and
RPAS-based survey in the six study sites. ... 29
Figure 10. The scatter plot of calculated densities and size of colony.
... 34
Figure 11. (A) A histogram of the distribution of the number of
neighbors in captured view (2D) and exported markers (3D) and (B)
suggested reason of the difference. ... 35
Figure 12. Examples of image sets exhibiting inter-annual nest sites
in Steinflåstupet. ... 37
Chapter 1. Introduction
1.1. Study background
Keeping track of the exact number of individuals is crucial to understand the population dynamics of wild animal and to establish a conservation plan (Morrison 1994). As avian species occupy highly different types of habitat from forest to ocean, birds were used to evaluate the integrity of ecosystem (Jaspers et al. 2007). In the Arctic marine ecosystem, seabirds have been used as an indicator to reflect the marine food availability (Cairns 1988) or contaminants like plastic debris (Mallory 2008) and to predict the increase or decrease in sea-ice coverage (Mallory et al. 2006).
However, researchers have had difficulties in surveying birds because of low accessibility to their extreme habitats (Rush et al. 2018). Colonial seabirds inhabiting cliffs are one of the difficult groups to monitor because seabirds distribute vertically along the irregular cliff surface, and the approach to seabirds is perilous due to the possibility of erosion (Bird 1994). In spite of dangerousness, researchers have estimated the densities (Harris et al. 1997; Massaro et al. 2001; Birkhead 1977) and measured the topographical features manually (Kildaw 1999; Squibb and Hunt Jr 1983). The problem still remains even for indirect approaches; cliff is a characterful topography in that conventional ground mapping could less reflect the horizontal ruggedness. Restricted observations may result in biases for the estimates of seabird abundance (Buckland et al. 2008). Colonial breeding is another obstacle because the survey results would vary depending on the reliability of monitoring technique (Hutchinson 1980) and demand labor-intensive works.
In many recent instances, those traditional monitoring techniques would be replaced by remotely piloted aircraft system (RPAS) to some extent (Gonzalez et al. 2016). The diverse sizes and designs of aircraft were developed (Anderson and Gaston 2013; Mackenzie 2012a, 2012b), and the declining cost of aircrafts lead to the explosive increase of utilizing RPAS on such ecological studies (Weissensteiner et al. 2015).
In bird monitoring, RPAS has been applied over the last decade (Sardà‐ Palomera et al. 2012; Chabot and Bird 2012). RPAS is in multifaceted use of monitoring a large colony of the Common Tern (Sterna hirundo) (Chabot et al. 2015) and detecting cryptic nests of the Field Sparrow (Spizella pusilla) (Scholten et al. 2019) and the Northern Lapwing (Vanellus nanellus) (Israel and Reinhard 2017). In other previous studies, penguins were considered as the suitable model species to estimate the population size because the nests of penguin family (Spheniscidae) are relatively prominent. Almost 4,300 breeding individuals of Adélie (Pygoscelis adeliae) and Chinstrap Penguins (Pygoscelis antarcticus) were surveyed in King George Island, but the limitation was that aerial images taken at a height of 550m above sea level were unsatisfactory to distinguish two species (Korczak-Abshire et al. 2019). In case of a flight altitude of 30m, the colony dominated by a thousand Gentoo Penguins (Pygoscelis papua) was individually discriminated (Ratcliffe et al. 2015). The survey conducted by Goebel et al. (2015) showed the photograph counts were quite reliable, 2.4% to 3.9% less estimated in total, compared to ground counts. By adopting RPAS, fine-spatial analysis would also be accomplished in cliff-nesting seabirds. The coastal cliffs have been frequently surveyed by civil engineers and geographers in the perspective of risk management (Jaud et al. 2019; Fazio et al. 2019). RPAS combined with high-resolution camera would help to reduce variances with off-site error checking (Hodgson et al. 2016). One empirical research presented that the counts in images were more approximate to actual figures of the replica seabird colonies than in the study site (Hodgson et al. 2018).
1.2. Purpose of research
In this study, I endeavored to survey Arctic seabird species, which have both colonial breeding and cliff-nesting behavior. Because Arctic seabirds are the main consumers in the Arctic ecosystem, they have been rigorously monitored in the Norwegian Svalbard Archipelago on a regular basis under the SEAPOP (SEAbird POPulations) programme since 2005 (Anker-Nilssen et al. 2008). However, the key
parameters of seabird population such as population change, annual adult survival, and reproductive performance have been generally derived only from a few plot counts (Anker-Nilssen et al. 2019). Thus, I aimed to operate RPAS to successfully acquire the image of seabirds and coastal cliffs as a newly adapted monitoring technique. With the increased accessibility, three-dimensional (3D) model could be constructed from obtained images and then used in the identification of seabirds, quantitative analysis of spatial density, and inter-annual comparison of nest sites.
Chapter 2. Literature review
2.1. Seabirds in the Svalbard Archipelago
The Svalbard Archipelago ranges from 74°N to 81°N and 10°E to 35°E in the Arctic Ocean. As Svalbard shows a typical High Arctic climate, many parts of the land are covered with glaciers. Spitsbergen, Nordaustlandet, Edgerøya, and Barentsrøya are the four main islands of Svalbard, but they are different in the vegetation cover. The central and northern Spitsbergen where the long and wide fjords established have the relatively low percentage of glaciers and the high percentage of non-vegetated areas and shadows instead (Johansen et al. 2012).
Ny-Ålesund (78.92342°N, 11.93196°E) is located on the north part of Brøggerhalvøya, which is situated on the western coast of Spitsbergen, and abuts the shore of Kongsfjorden. Kongsfjorden primarily carries Northern Shrimps (Pandalus borealis), Polar Cods (Boreogadus saida), Atlantic cods (Gadus morhua), and Greenland Halibuts (Reinhardtius hippoglossoides), which support marine mammals and seabirds (Hop et al. 2002). In particular, the West Spitsbergen Current from Atlantic Water and the East Spitsbergen Current from Arctic Water influence the sea ice extent around Svalbard and ultimately the whole food webs (Descamps et al. 2017; Svendsen et al. 2002).
The occupation history of a colony could be proposed by analyzing the sediments (Liguang et al. 2004), and seabirds in Ny-Ålesund were known to colonize more than 9,400 years ago after the deglaciation of Kongsfjorden (Yuan et al. 2010). Nine species were reported go breed in summer in the marine ecosystem of Kongsfjorden: Common Eider (Somateria mollissima), Little Auk (Alle alle), Black Guillemot (Cepphus grille), Atlantic Puffin (Fratercula arctica), Thick-billed Murre (Uria lomvia), Northern Fulmar (Fulmarus glacialis), Black-legged Kittiwake (Rissa tridactyla), Glaucous Gull (Larus hyperboreus), and Arctic Tern (Sterna paradisaea) (Hop et al. 2002).
The seabirds near Ny-Ålesund can be classified according to foraging strategies; guillemots and puffins are pursuit divers, eiders are benthic feeders, and gull-like species are surface feeders (Hop et al. 2002; Dahl et al. 2003). Because the diet represents the ecological niche they occupy, seabirds were used to reveal the food web structure (Iverson et al. 2007). Black-legged Kittiwakes in Svalbard were used as a bioindicator of Atlantification in the Arctic Ocean (Vihtakari et al. 2018). Other species such as the Thick-billed Murre, Little Auk, Black Guillemot, Northern Fulmar, and Glaucous Gull were also suggested as bioindicators from stable isotope analysis which reflect diet and trophic position (Hobson and Bond 2012).
Abundance, species-specific properties, and residency patterns were investigated to estimate the consumed biomass by seabirds (Hop et al. 2002). A total of 4,000 pairs of eiders, 1,000 pairs of Little Auks, 100 pairs of Black Guillemots, 50 pairs of puffins, 1,700 pairs of Thick-billed Murres, 1,000 pairs of fulmars, 5,200 pairs of kittiwakes, 100 pairs of Glaucous Gulls, and 1,500 pairs of terns were estimated (Hop et al. 2002). The more exact estimates could be produced by the more precise population data.
The population sizes of each seabird were available at SEAPOP data portal (http://www2.nina.no/Seapop/), and the detailed last observation records of seabird near Ny-Ålesund in summer could be downloaded under the geographical selection of Kongsfjorden municipality (Appendix 1). The main coastal cliffs were in Blomstrandhalvøya, Brøggerfjellet, Kiærsstranda, Krykkjefjellet, Ossian Sarsfjellet, and Stuphallet. In Blomstrandhalvøya or Blomstrandhamna except for Bird Sanctuary, Black-legged Kittiwake and Thick-billed Murre were the dominant species; 908 apparently occupied nests (AONs) of kittiwakes and 239 pairs of Thick-billed Murres were observed in 2011. Approximate 300 pairs of puffins were mainly counted in Brøggerfjellet in 1973. In Kiærsstranda or Kiærfjellet, approximate 700 AONs of fulmars were counted in 1973, and 400 pairs of puffins in 1983. 806 pairs of kittiwakes were detected in Krykkjefjellet in 1992, and Little Auks also colonized in 1985. Ossian Sarsfjellet was the largest habitat containing 1,936 AONs of kittiwakes and 1,358 individuals of Thick-billed Murres in 2011. Fulmar was dominant in Stuphallet or Steinflåstupet in 2011.
2.2. Cliff-nesting adaptation
Recent phylogenetic approach suggested that cliff-nesting is likely to appear later in the evolutionary history (Fang et al. 2018). Nevertheless, distinctive behavioral adaption to cliff-nesting is observed in some avian taxa such as the kittiwake (Cullen 1957), Swallow-tailed Gull (Creagrus furcatus) (Hailman 1965), Black Noddy (Anous tenuirostris) (Cullen and Ashmole 1963; Ashmole 1962) and the Norther Gannet (Sula bassana) (Danchin and Nelson 1991; Nelson 1965).
Cullen was one of the first researchers who reported cliff-nesting adaptation in Black-legged Kittiwakes. Kittiwakes are known to nest on narrow ledges by elaborate nest-building technique with mud and fibrous materials, so that deeply cupped nests would contribute to the lower predation on kittiwake eggs and chicks (Cullen 1957).
The Northern Fulmar and Thick-billed Murre are also cliff-nesting species, but these two seabirds do not build conspicuous nests unlike kittiwakes (Squibb and Hunt Jr 1983). The observation in Alaska elucidated the spatial segregation between the kittiwakes and the fulmars, in that the fulmars locate higher cliffs with vegetation (Fisher 1966). However, the kittiwakes are usually more competitive than the fulmars to deprive of breeding sites (Coulson and Horobin 1972). Such competition would give rise to displacement in order not to overlap similar nest sites even within relative species (Kildaw 1999).
2.3. Colonial breeding
Coulson (2002) stated seabirds that live and breed close would have at least long-term advantages, and many researchers have suggested various hypotheses on the coloniality. Some seabirds may be forced to colonially breed owing to the lack of adequate nest sites (Rowan 1952), but the main advantage of large colonies would be the reduced predation risk (Coulson 2002). The fortunate young would have a
higher chance of avoiding predators with synchronized breeding, resulting in a higher breeding success (Hailman 1964; Darling 1938).
Almost all seabird species have evolved to breed colonially (Danchin and Wagner 1997), and the colony size may vary (Brown et al. 1990). Northern Fulmars can be more gregarious than 100,000 nests, Thick-billed Murres up to 800,000 nests, and Atlantic Puffins up to 148,000 nests (Brown et al. 1990; Birkhead and Nettleship 1985; Fisher 1952).
2.4. Precedent monitoring method
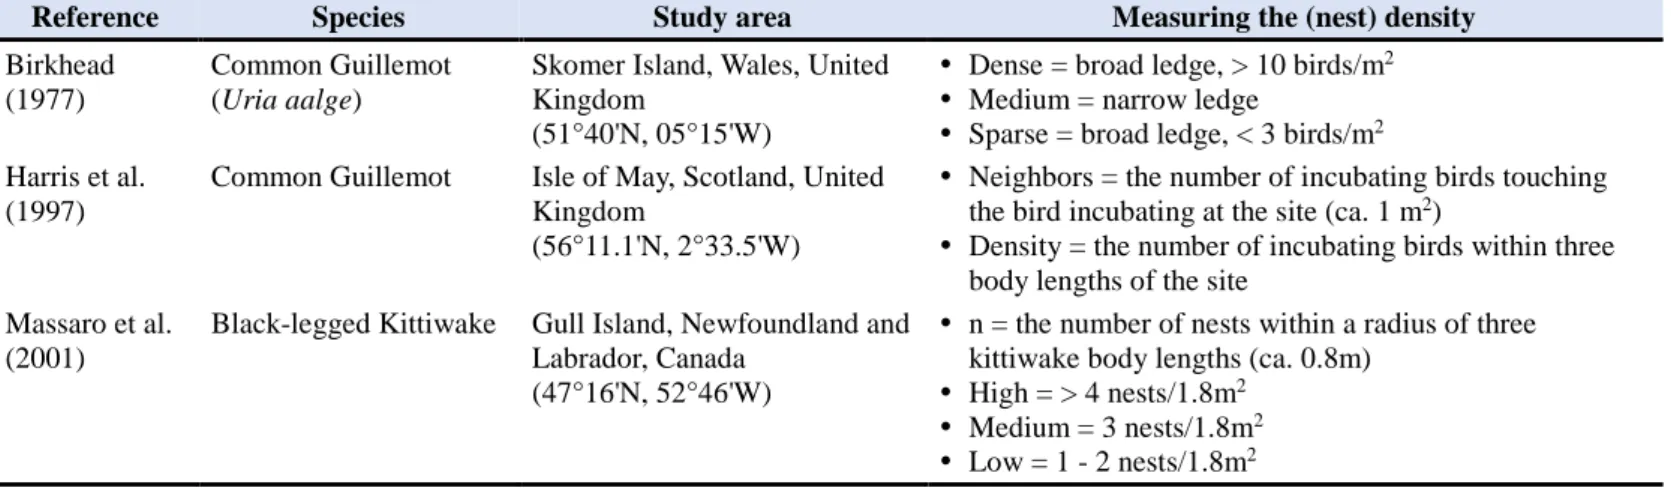
The fundamental way to monitor seabirds was to individually mark them with metal or colored plastic leg-ring, so that the continuous monitoring of a colony could be conducted (Aebischer and Coulson 1990). The nest density was produced based on a virtual surface or simply classified into qualitative description in the precedent studies (Table 1). Harris et al. (1997) and Massaro et al. (2001) respectively measured the incubating birds and nests within three body lengths, designated as unit area. Other topographical features regarding nest site characteristics such as ledge width, length, or slope were measured point by point because the ledges were demonstrated to be one factor of nest site preferences among different species (Kildaw 1999; Squibb and Hunt Jr 1983). The density along with broad and narrow ledge was emphasized because those factors combined with the density and topographical features were closely relevant to breeding success (Birkhead 1977).
Table 1. Precedent studies of colonial cliff-nesting seabirds
Reference Species Study area Measuring the (nest) density
Birkhead (1977)
Common Guillemot (Uria aalge)
Skomer Island, Wales, United Kingdom
(51°40'N, 05°15'W)
Dense = broad ledge, > 10 birds/m2 Medium = narrow ledge
Sparse = broad ledge, < 3 birds/m2 Harris et al.
(1997)
Common Guillemot Isle of May, Scotland, United Kingdom
(56°11.1'N, 2°33.5'W)
Neighbors = the number of incubating birds touching the bird incubating at the site (ca. 1 m2)
Density = the number of incubating birds within three body lengths of the site
Massaro et al. (2001)
Black-legged Kittiwake Gull Island, Newfoundland and Labrador, Canada
(47°16'N, 52°46'W)
n = the number of nests within a radius of three kittiwake body lengths (ca. 0.8m)
High = > 4 nests/1.8m2 Medium = 3 nests/1.8m2 Low = 1 - 2 nests/1.8m2
Chapter 3. Materials and methods
3.1. Study sites and period
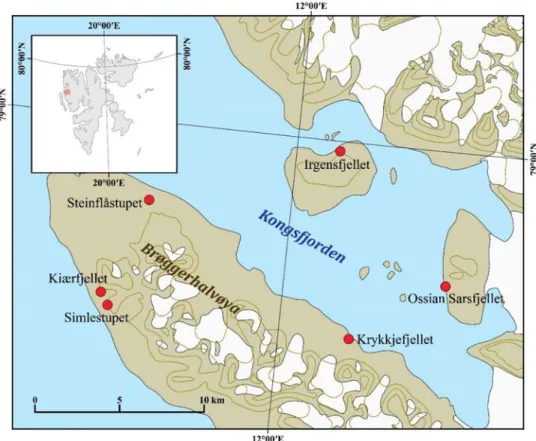
From the late July to early August of 2018 and 2019, I visited the coastal cliffs near Ny-Ålesund in the Svalbard Archipelago, Norway (Fig 1). Based on the published population data, I observed six seabird colonies with various sizes: Krykkjefjellet (78.89632°N, 12.19484°E), Ossian Sarsfjellet (78.93280°N, 12.44011°E), Irgensfjellet (78.99408°N, 12.11681°E), Steinflåstupet (78.95809°N, 11.60749°E), Kiærfjellet (78.90680°N, 11.50234°E), and Simlestupet (78.99408°N, 12.11681°E) (Fig 1). The biggest colony was in the Ossian Sars Nature Reserve (Ossian Sarsfjellet), and the smallest ones were in Steinflåstupet and Kiærfjellet.
Figure 1. The map of the Svalbard Archipelago and six study sites of Svalbard coastal cliffs. Study sites are located in Brøggerhalvøya or surrounded by the shore of Kongsfjorden.
3.2. Image acquisition
3.2.2. RPAS equipment and flight conditions
I deployed a customized commercial aircraft model (DAYA-550 Alien Carbon Fiber Folding Quadcopter Frame Kit; DAYA, China) powered with four motors (MN3508 KV700; T-Motor, Jiangxi, China) and 12-inch propellers. Flight controller (Pixhawk 2; PX4 AutoPilot, Zürich, Switzerland) was used within radio telemetry system (Transceiver Telemetry Radio V3 433MHz; Holybro, Guangdong, China). A long-range radio system (FrSky R9 & R9M 900MHz; FrSky Electronic Co., Jiangsu, China) and a controller (FrSky Taranis Q K7; FrSky Electronic Co., Jiangsu, China) were selected to meet the working frequency band of EU version. A distance sensor measurable up to 120m (SF11/C LIDAR Range Sensor; Lightware Visual Engineering, Budapest, Hungary) was compatible with the flight controller. Two types of camera were attached under the quadcopter: visible light (SONY DSC-RX0 4800x3200; Sony Corporation, Tokyo, Japan) and thermal imaging infrared camera (FLIR Vue Pro R 640x512; FLIR Systems, Oregon, USA). The weight of aircraft with battery was approximately 1,500g and the other detachable payload was about 500g. Maximum flight time was 20 minutes per a lithium polymer battery (PT-B4200N-UKP45; Poly-Tronics, China).
The six coastal cliffs were investigated by an aircraft under a speed of 5m/s when the wind is light and the sunshine is not too bright (Appendix 2). A series of RGB (red, green, and blue) and thermal images were programmed to snap: one RGB image per two seconds and one thermal image per second, considering their camera angles. In addition, I included geographical identification metadata while piloting the aircraft. However, not all images were geotagged because it was almost impossible to plan the automatic flights due to obstacles or unexpected wind.
All kinds of disturbance could not be excluded, but the aircraft was skillfully maneuvered in order not to disturb the targeted birds following the protocol (Ditmer et al. 2015; Hodgson and Koh 2016; Rush et al. 2018; Kellenberger et al. 2018). I first designed to approach a small colony in the margin of each cliff and recorded the response of seabirds toward flying aircraft. Taking pictures of the main colony was
continued only if they did not express any aggressive behavior. While inspecting the distance sensor, the aircraft was operated as close to the cliff as possible. In general, the aircraft kept the distance of 50m and then zigzaggedly approached closer to the distance of 20m (Fig 2). I was greatly watchful to any sudden shift in the surroundings and ready to abort the flight at any time as a countermeasure.
Figure 2. Overall flight scheme to a targeted colony. The aircraft was launched on the ground and slowly approached to colonies from a distance 50m to 20m and even closer.
3.2.2. Ethical statements
This research was conducted under permissions from the Governor of Svalbard and other Norwegian authorities, complying the guideline stated by Kings Bay. I was notified from the Governor of Svalbard that I should abide by general rules under the Svalbard Environmental Protection Act (ref. 1091212-2). I declared the type of RPAS (RO1) to the Norwegian Civil Aviation Authority (CAA), which had to be light-weight under 2.5kg and slowly piloted under 120 meters (NO.RPAS.5720). I obtained the temporary permission from Norwegian Communications Authority (Nkom) for use of radio frequencies ranging from 433.05 to 434.79MHz, available within 20 km from Ny-Ålesund (ref. 1903705-4-533). I consulted with the Norwegian National Security Authority (NSM) and Norwegian Mapping Authority (NMA) and registered the airborne sensor usage. Regarding aviation safety, the flight activities were insured by liability and property coverage. I signed a coordination agreement with Ny-Ålesund Airport and daily informed the planned flight schedule prior to use. All procedures were reported to Ny-Ålesund Science Managers Committee (NySMAC) project information and discussion (PID) forum, and the overview could be simply accessed in Research in Svalbard (RiS) database under RiS-ID 11249.
3.3. Model construction and manual counting
3.3.1. Three-dimensional model constructionVarious software has made it simple to construct 3D models of coastal cliffs by Structure-from-Motion (SfM) photogrammetry (Forsmoo et al. 2019). A software, Agisoft Metashape 1.6.2 (LLC Agisoft, St. Petersburg, Russia), was used to overlap the RPAS-driven RGB and thermal images. All RGB images were taken with 4800x3200 pixels, and thermal images were 640x512 pixels in a lump during flights. I followed the four steps to generate as other studies achieved (Burns et al. 2015; Ventura et al. 2018): (i) align photos, (ii) build dense cloud, (iii) build mesh, and (iv) build texture. If the images were geotagged, they were automatically aligned; otherwise, I manually designated the coordinates and elevation of several noticeable terrain features, which were obtained from the digital maps in TopoSvalbard (https://toposvalbard.npolar.no/) of the Norwegian Polar Institute.
3.3.2. Different methods for manual counting
I compared the seabird monitoring method between traditional ground photographic counting and RPAS-based model counting. I took RGB photos (SONY DSC-RX10M4 5472x3648; Sony Corporation, Tokyo, Japan) on the ground while the aircraft was piloted, and I merged these ground-taken photos with Adobe Photoshop CS6 (Adobe Inc., California, USA) to represent the observer’s view. The seabird figurations in the constructed models were pinpointed, utilizing “Add Marker” function in Metashape. To confirm these enumerated counts, I tested if the reliable figures could be consistently derived from other people. The two subsets of Krykkjefjellet and Irgensfjellet images were presented to several independent researchers. Each subset comprised three image groups: (i) the merged photos taken by a researcher on the ground, (ii) the constructed model from RPAS-driven RGB images, and (iii) the constructed model from RPAS-driven thermal images.
The manual counting was conducted, and the counts were recorded. The counts were plotted with ggplot2 package (Wickham 2011) in R 3.6.2. (R Core Team, Vienna, Austria) and statistically tested among three image groups in each subset.
First, Shapiro-Wilk normality test was used to test the univariate normality in each group. Second, if the data meet normality, one-way analysis of variance (ANOVA) followed by all pairwise multiple comparison procedures (Tukey test) could be processed to exclude the effect of individual researcher. Otherwise, non-parametric alternatives of Kruskal-Wallis test and Tukey test would be gone through if normality was not satisfied.
3.3.3. Viewshed analysis
To support the result from different monitoring methods above, the viewsheds from an observer point were analyzed. The two RPAS-driven RGB image models and markers of Krykkjefjellet and Irgensfjellet were exported as digital elevation models (DEM) of 1cm pixel resolution from Metashape. The models were imported in ArcGIS Pro 2.5 (Esri, California, USA), and the markers of seabird were plotted as points in the same way. The seabirds were hypothesized as the spheres within the radius of 0.1m, so that the spheres were created by “Buffer 3D”. DEMs were analyzed by “Viewshed” function with the designated observer point, and the buffered points (spheres) containing the viewshed value were counted with QGIS 3.10.4 “Zonal statistics”.
3.4. Seabird identification through RGB and thermal images
Thermal images, simultaneously taken with RGB images, were selected and converted with FLIR ResearchIR software (FLIR Systems, Oregon, USA). Contours were constructed with ArcGIS “Contour List” and “Feature to polygon” function, and tiny (< 3 pixel sizes) or extremely large contour polygons (> 40 – 100 pixel sizes depending on the distance) which did not indicate the size of seabirds were removed. Processed thermal images were compared with RGB images to validate the presence of seabirds. Same method as described above was used for semi-automated counts.3.5. Comparison among colonies and inter-annual change
3.5.1. Density calculationsI compared the four densities of the kittiwake, which was a dominant species at Krykkjefjellet, Ossian Sarsfjellet, Irgensfjellet, and Simlestupet. In this study, I would count the neighbors as the number of adult kittiwakes within a spherical radius of three kittiwake body lengths (ca. 0.8m) modified form Massaro et al. (2001) (Fig 3A). I also defined the density as the mean value of the neighbors within each colony. I exported the estimated coordinates and altitude of each marker from the models to three-dimensionally analyze the distance between markers. The initial coordination system of markers was transformed from WGS 84 (EPSG 4326) into ETRS 89/UTM zone 33N (EPSG 25833) with Pyproj package (https://github.com/pyproj4/pyproj) in Python 3.7.6 (Python Software Foundation, Delaware, USA). Distances between markers were calculated, and neighboring markers within 0.8m were recorded with python NumPy package (Oliphant 2007). The calculated densities were adopted to all 3D habitat models and plotted with regression model to show a tendency between the density and colony size by python matplotlib (Hunter 2007) and statsmodels package (Seabold and Perktold 2010).
To compare the result following the traditional method of Massaro et al. (2001), I captured the 3D model of Krykkjefjellet subcolony to simulate field survey (Fig 3B). The number of adult kittiwakes within a radius of three kittiwake body lengths was counted on the captured view. The densities calculated by “exported markers” and from “captured view” were displayed as histogram and compared by the Chi-square test with python matplotlib and SciPy package (Virtanen et al. 2020).
3.5.2. Nest site detections
A Northern Fulmar colony in Steinflåstupet was monitored in consecutive two years during the summer in 2018 and 2019. I pinpointed the location of fulmar chicks as marker in Metashape to check if fulmars had occupied similar nest site over the years. The detected nest sites were named, and ground-taken RGB images were paired to figure out the re-occupation of each nest site.
Figure 3. Two ways to calculate the density of adult kittiwakes within a small colony in Krykkjefjellet. (A) The distance between each marker representing the location of adult kittiwakes was three-dimensionally calculated, and markers within a spherical radius of 0.8m were counted; (B) adult kittiwakes were manually counted within the radius of three kittiwake body lengths on the simulated view of a ground observer.
Chapter 4. Results
4.1. Image acquisition and model construction
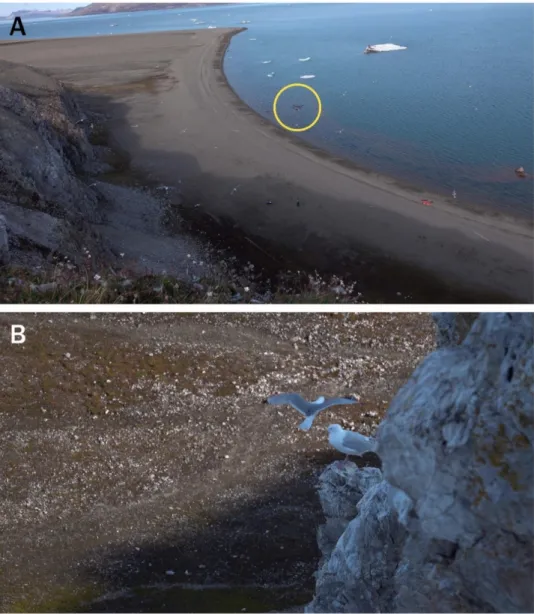
No noticeable movement of kittiwakes was observed during the flight of RPAS, and the number of circling kittiwakes was relatively constant shown in the site image (Fig 4A). However, some individual kittiwakes continuously tried to chase away the aerial predator, the Glaucous Gull, from the nest sites with the aggressive behavior (Fig 4B).
Total 35 flights were successfully launched to cover six coastal cliffs (Appendix 2), and 17 3D habitat models containing RGB images were constructed (Appendix 3). These models were mosaicked from the photos taken with the same camera on the same day. Some cliffs had subcolonies which were at least 20m apart from the main colony, and the subcolonies in Irgensfjellet were called right and left according to the relative location. Ossian Sarsfjellet stretched 600m, so this study site was not able to be covered by one flight. Therefore, disconnected colonies were arbitrarily named: subcolony A, B, C, and D.
Figure 4. Site images during the flight, taken on the coastal cliff. (A) Kittiwakes did not show any behavioral difference while a remotely piloted aircraft took a series of images, but (B) kittiwakes showed aggressive behavior toward a Glaucous Gull.
4.2. Reliable counts through post processing
4.2.1. Comparison between ground-taken RGB images and constructed models Seven independent researchers manually counted kittiwakes in Krykkjefjellet and Irgensfjellet images. The counts in each group did not meet the univariate normality, so the Kruskal-Wallis test was used and followed by all pairwise multiple comparison procedures using the Tukey test (p < 0.05). The results were presented with box-whisker plots (Fig 5), Counts from three different methods were not significantly different at Krykkjefjellet (H = 5.388 df = 2, p = 0.068), while there was a significant difference in count data among methods at Irgensfjellet (H = 16.179, df = 2, p = <0.001). The following pairwise multiple comparison on ranks indicated that all three count methods produced different results (p < 0.05) at Irgensfjellet.
4.2.2. Viewshed analysis
Under ArcGIS viewshed function, the binary viewsheds of Krykkjefjellet and Irgensfjellet were created from each observer point (Fig 6): visible raster grid reclassified into ‘1’, and invisible into ‘0’. The visible area in Krykkjefjellet occupied 34.3% of DEM raster grid, and 49 out of 73 adult kittiwake buffered points touched or included the visible area (Fig 6A). Viewshed in Irgensfjellet was about 17.6% of the raster grid, and 63 out of 103 points were counted in visible area (Fig 6B).
Figure 5. Box-whisker plots of manual counts with different images in Krykkjefjellet and Irgensfjellet. The Kruskal-Wallis test was significant (p < 0.001) at Irgensfjellet, which manual counts were statistically different by image sets, supported by the Tukey test. Asterisk indicates a significant difference (p < 0.05).
Figure 6. The calculation of viewsheds in (A) Krykkjefjellet (visible area: 34.3% of DEM raster grid) and (B) Irgensfjellet (visible area: 17.6% of DEM raster grid). (A) 16 out of 73 and (B) 40 out of 103 kittiwake points were situated on the invisible viewshed.
4.3. Seabird identification and survey results
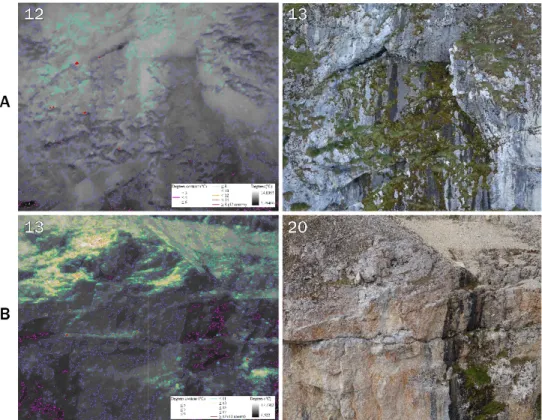
4.3.1. Complementary use of thermal imagesThermal images were helpful in detecting cryptic fulmars. Fig 7 showed that fulmars are somewhat indistinguishable in RGB images because of the similarity of color between fulmar chicks and the bedrock. The first thermal image taken in Irgensfjellet presented 12 isothermal polygons higher than 8℃, and these 12 polygons were matched with the position of fulmars in the first RGB image (Fig 7A). However, not all fulmars were correctly discovered; one adult was omitted as below 8℃ isothermal line, another adult contained two separated polygons, and the other case was one gathered polygon of adjacent adult and chick. The second thermal image taken in Kiærfjellet also presented 13 isothermal polygons higher than 12℃, fitted to the second RGB image (Fig 7B). Same problem occurred; 7 fulmars were missing with 12℃ contour polygons.
Figure 7. Examples of complementary use of thermal images in (A) Irgensfjellet and (B) Kiærfjellet. (A) 12 and 13, (B) 13 and 20 fulmars were respectively detected in a thermal and RGB image of the same angle.
4.3.2. Semi-automated counts in thermal images
The first set of RGB and thermal image was taken 8m apart from the cliff of Ossian Sarsfjellet D subcolony (Fig 8A). The thermal image provided 42 semi-automated counts, and it was soundly matched with the RGB image which was clearly taken. However, the actual number of adult kittiwakes was 37, implying the overestimated result in this case. It seemed that several contour polygons in thermal images were actually part of one kittiwake. Because eyes and feet are not feathered and display highest temperature, the contour setting higher than 16℃ would exclude feathered body whose temperature was closer to the surroundings. Also, some pairs were just next to each other and made the bigger merged polygons.
The second set of RGB and thermal image was taken 13m apart in subcolony A that kittiwakes were almost in half size of the first RGB image (Fig 8B). A total of 58 out of 72 semi-automated counts in thermal image were validated to be actual adult kittiwake in RGB image. Meanwhile, 87 adult kittiwakes were observed in the RGB image, as well as five billed Murres and a Glaucous Gull chick. Thick-billed Murres and Glaucous Gulls were also included as contour polygons in the thermal image, implying that distinguishing kittiwakes from other species was not enough with two filters.
Figure 8. Examples of semi-automated counts with thermal images in Ossian Sarsfjellet (A) subcolony D and (B) subcolony A. (A) 42 and 37, (B) 72 and 87 kittiwakes were respectively detected in a thermal and RGB image of the same angle.
4.3.3. Overall survey results
The seabirds were marked individually with the 3D habitat models, and six species were detected (Fig 9). Krykkjefjellet, Ossian Sarsfjellet, Irgensfjellet, and Simlestupet were dominated by Black-legged Kittiwakes, and this dominance was also recorded in the past SEAPOP data (Table 2). On the other hand, Northern Fulmars and Atlantic Puffins mainly consisted of the colonies in Steinflåstupet and Kiærfjellet, and SEAPOP data supported this community composition (Table 3). The population sizes of the Atlantic Puffin, Black Guillemot, Glaucous Gull, and the Thick-billed Murre were listed in each study site (Table 4).
Figure 9. The map of seabird species observed by ground-based and RPAS-based survey in the six study sites.
Table 2. Population sizes of the Black-legged Kittiwake (Rissa tridactyla) near Ny-Ålesund in the summer seasons
Study site Detailed location Period Counts Count unit* Reference
Krykkjefjellet Tyskleir 13.07.1992 154 Pair SEAPOP
Franskleir 14.07.1992 652 Pair SEAPOP
Main 25.07.2019 563 Individual This study
Sub 26.07.2019 79 Individual This study
Main 04.08.2019 652 Individual This study
Sub 04.08.2019 73 Individual This study
Irgensfjellet Blomstrandhamna 3 24.07.1981 194 Pair SEAPOP
Blomstrandhamna 1 23.06.2011 908 AON SEAPOP
Main 30.07.2019 786 Individual This study
Main 02.08.2019 836 Individual This study
Right 02.08.2019 124 Individual This study
Left 02.08.2019 137 Individual This study
Ossian Sarsfjellet Ossian Sarsfjellet 18.07.2011 1936 AON SEAPOP
C 27.07.2019 1860 Individual This study
D 27.07.2019 323 Individual This study
C 29.07.2019 1879 Individual This study
D 29.07.2019 357 Individual This study
A 30.07.2019 1446 Individual This study
B 30.07.2019 1469 Individual This study
Simlestupet 31.07.2019 1070 Individual This study
Table 3. Population sizes of the Northern Fulmar (Fulmarus glacialis) near Ny-Ålesund in the summer seasons
Study site Detailed location Period Counts Count unit* Reference
Kiærfjellet Kiærsstranda 21.07.1973 700 AON SEAPOP
31.07.2019 28 Individual This study
Irgensfjellet Blomstrandhamna 3 24.07.1981 50 AON SEAPOP
Blomstrandhamna 1 23.06.2011 10 AON SEAPOP
Blomstrandhalvøya SW 15.07.2011 32 AON SEAPOP
Main 30.07.2019 14 Individual This study
Main 02.08.2019 27 Individual This study
Right 02.08.2019 27 Individual This study
Steinflåstupet Stuphallet 15.07.2011 127 AON SEAPOP
04.08.2018 38 Individual This study 24.07.2019 57 Individual This study
Simlestupet 31.07.2019 14 Individual This study
Table 4. Population sizes of other seabird species near Ny-Ålesund in this study
Study site Colony Species Period Counts*
Krykkjefjellet Main Glaucous Gull 25.07.2019 1
Thick-billed Murre 43
Sub Glaucous Gull 26.07.2019 2
Main Thick-billed Murre 04.08.2019 9
Ossian Sarsfjellet C Glaucous Gull 27.07.2019 20
Thick-billed Murre 127 D Thick-billed Murre 27.07.2019 91 C Black Guillemot 29.07.2019 1 Glaucous Gull 7 Thick-billed Murre 130 D Thick-billed Murre 29.07.2019 87 A Glaucous Gull 30.07.2019 2 Thick-billed Murre 318 B Glaucous Gull 30.07.2019 1 Thick-billed Murre 316
Irgensfjellet Main Glaucous Gull 30.07.2019 2
Thick-billed Murre 1
Atlantic Puffin 9
Main Atlantic Puffin 02.08.2019 3
Right Thick-billed Murre 02.08.2019 16
Steinflåstupet Atlantic Puffin 04.08.2018 19
Atlantic Puffin 24.07.2019 18
Glaucous Gull 2
Kiærfjellet Atlantic Puffin 31.07.2019 16
Glaucous Gull 2
Simlestupet Atlantic Puffin 31.07.2019 20
Glaucous Gull 13
4.4. Density measurements
4.4.1. Calculated densitiesThe densities calculated from 15 kittiwake-dominant habitat models were plotted with the x-axis of size of colony in a log scale with a linear regression line of ordinary least squares method [Y = 0.514 (p = 0.0507) × X + 1.138 (p = 0.101), R2 = 0.263, p = 0.507, n = 15] (Fig 10). The density was inclinable to increase in larger colony size; the highest density was 3.04, calculated in subcolony C of Ossian Sarsfjellet containing 1879 individuals, and the lowest density was 1.54 in right subcolony of Krykkjefjellet with 73 individuals.
Histogram on the number of neighbors was plotted to compare two different counting methods (Fig 11A). From the simulated perspective or “captured view”, the number of kittiwakes which do not have any neighbor was 15, but 22 in spherical analysis by “exported markers” (Fig 11A). This difference was statistically proved according to the Chi-square test (χ2 = 166.962, df = 1, p = 0.0137). To explain this difference, a plausible situation was proposed as observation errors from the captured view may occur because of a similar effect of projection (Fig 11B). In other words, the difference would be narrowed down when the cliff wall is almost vertically flat, so a real 3D distance between each marker was similar to a projected distance despite fine-spatial surface ruggedness.
Figure 10. The scatter plot of calculated densities and size of colony. A linear regression line of ordinary least squares method [Y = 0.514 (p = 0.0507) × X + 1.138 (p = 0.101), R2 = 0.263, p = 0.507, n = 15] was also illustrated.
(A)
(B)
Figure 11. (A) A histogram of the distribution of the number of neighbors in captured view (2D) and exported markers (3D) and (B) suggested reason of the difference.
4.4.2. Inter-annual nest site monitoring
The 12 fulmar chicks were located on RPAS-driven RGB image models of Steinflåstupet in 2018, and 7 in 2019. Fulmar chicks were settled in the horizontal crack of bedrock (Fig 12). The nest sites were matched with the compared sets of ground-taken RGB images whose resolution was high enough to distinguish cryptic fulmar chicks from grayish bedrock (Table 5; Fig 12).
Table 5. The comparison of inter-annual nest site changes in Steinflåstupet 2018 2019 Nest site A ○ ○ Nest site B ○ Nest site C ○ ○ Nest site D ○ Nest site E ○ ○ Nest site F ○ Nest site G ○ Nest site H ○ Nest site I ○ ○ Nest site J ○ ○ Nest site K ○ ○ Nest site L ○ ○
Chapter 5. Discussion
5.1. Applicability of RPAS on monitoring seabirds
The results showed that RPAS may successfully produce sufficient RGB images for 3D habitat model construction through SfM photogrammetry (Appendix 3). The least 68 images could cover the left colony in Irgensfjellet, which horizontally stretched about 70m (Appendix 3-17), and the most 613 images were aligned to build the main colony of 127m high Irgensfjellet (Appendix 3-14). The processing time relied on the number of images, so that the quality should be economically adjusted from the lowest to medium.
Coastal cliffs would be especially dangerous to approach, but RPAS made it practicable to observe colonial cliff-nesting seabirds. One concern was the wind speed because cliff-nesting seabirds may have advantage of strong wind (Gilchrist and Gaston 1997). An unexpected gust would lead to a catastrophic event such as a crash of an aircraft against a cliff wall or even seabirds. Therefore, the operator should check a weather forecast in advance and an onsite wind speed prior to the launch.
3D habitat models constructed by SfM photogrammetry produced reliable and more counts especially in remote and steep cliff (Fig 4; Fig 5). The observer stood at approachable location at 75m far away from the colony in Irgensfjellet, but only 20m away in Krykkjefjellet. The visual field was restricted by topographical obstacles in Irgensfjellet, so almost 40% of kittiwakes were not detected by ground-taken RGB images. The viewshed analysis also supported this result that the percentages of visible area ‘1’ in binary classification (Wheatley and Gillings 2000) was almost double in Krykkjefjellet than in Irgensfjellet (Fig 6B).
3D habitat models provided available platform for a total census of colonial seabirds (Rush et al. 2018). The colony size in Ossian Sarsfjellet was approximate 5,000 with an individual adult count unit, and 16 to 30 minutes of flight time were required to cover the subcolony C and D (Appendix 2). It is important to select proper
type and size of aircraft considering the targeted colony size, and a fixed-wing aircraft would be beneficial in possessing longer survey time (Ratcliffe et al. 2015). The exact number of seabirds were counted through 3D habitat models, but the existing survey results were sometimes based on the count unit of AON or pair, not in individual. This mismatch generated from different count units has been dealt with the use of correction factor k, which is breeding pairs divided by total count of birds (Harris et al. 2015; Harris 1989; Birkhead and Nettleship 1980; Birkhead 1978). The practicable value of k was estimated as 0.67 for the Common Guillemot (Uria aalge) in Britain and Ireland even if the correction factor varied in colonies and yearly fluctuated (Harris et al. 2015).
Simply multiplying this value to Thick-billed Murres, a species in the same genus of the Common Guillemot, in Ossian Sarsfjellet, approximate 570 pairs would be estimated as 850 individuals were observed (Table 4). The value could be adjusted to 0.61 which was used in mainland Norway (Barrett et al. 2006; Bakken 1986). Similarly, the composite nest to adult ratio of the Black-legged Kittiwake was 0.68 (Kildaw 1998), so the 3200 pairs would be estimated in Ossian Sarsfjellet, which are larger population estimates than the recent census in 2011 (Table 2). On the other hand, estimated 400 pairs of kittiwakes would be shrunk in size in the main colony of Krykkjefjellet, compared to 652 pairs recorded in 1992 (Table 2).
5.2. Usage of thermal images
As thermal images were maximized with RGB images, an exclusive usage of thermal images would be inadequate. The main reason in this study would be because the thermal camera had far fewer pixels (640x512) than the visible light camera (4800x3200). Although a high-resolution thermal camera at an equivalent level of visible light camera was used, it would not be such cost-effective (Gade and Moeslund 2014). In this respect, the counting results in RPAS-driven thermal image model expressed the larger variance than mosaicked image or RPAS-driven RGB image model, representing that even skilled researchers would be confused (Fig 5).
Moreover, other background hotspots or false-positive shapes such as warm feet and eyes (McCafferty 2013) would still mislead the count results.
When processing thermal images to display complementary use and semi-automated count, I only adopted two filters through isothermal line and size of pixels for processing thermal images. The two filters were implemental in quickly discovering cryptic seabirds, which contributed to precise monitoring. Because the surface temperature of chicks was generally higher than adults, the brightest hotspots in thermal images were used to represent the presence of chicks, serving as a good reference.
However, there were also various limitations. It was restrictive to distinguish other species in thermal images, so that RGB images were needed for validation. For example, the Thick-billed Murre had a lengthwise elongated shape, so the shapes in thermal images were separately recognized in naked eyes. Moreover, some false-negative polygons were revealed as the heated bedrock or vegetated covers, which may distort the results. Nevertheless, many image processing algorithms were recently developed to find local maximum temperature (Lhoest et al. 2015; Burke et al. 2019; Shao et al. 2020) or automated peak picking (Klukowski et al. 2018), improving the detection rate.
5.3. Density measurements
The 3D density calculated with the exported markers in this study. One of the advantages of calculating 3D density was to reflect an actual 3D distance. Precedent density measurement slightly tended to include additional kittiwake due to projection error even though both methods showed the subcolony in Krykkjefjellet had a low density (Fig 11). Moreover, the observer’s interpretation on which kittiwake was included or not within the radius of three body length would be excluded in calculating 3D density.
The exported markers enabled to briefly calculate 3D density even in large colony with python script. Density monitoring in large colonies would be
labor-intensive to count each neighbor in the field. Counting and recording each neighbor might be confused by moving seabirds. However, the 3D density was quantitatively measured by one criterion and made it possible to grasp the relationship between abundance and density with sufficiently pre-identified markers (Fig 10).
Finally, 3D density estimates could compare the overall densities among the kittiwake colonies (Fig 11). In other words, an intra-specific comparison among the kittiwake colonies was only considered in this study, but the densities of other species such as the Thick-billed Murre could also be calculated under proper criteria. In addition, the distribution pattern with a factor of elevation would be suggested as fulmars occupied the higher cliff (Fisher 1952), so the spatial segregation could be detected.
5.4. Long-term monitoring
3D habitat models presented the possibility of inter-annual monitoring of fine-spatially detected nest site in Steinflåstupet. Fulmars sometimes occupy the same nests which were used in the previous years (Coulson and Horobin 1972). In this study, the entire seven fulmar chicks detected in 2019 settled in the same nest sites in 2018 (Table 5). However, it was unascertained that the detected adult fulmars in 2019 were whether same individuals in 2018 or not. 3D habitat models would provide a clue on nest site preferences associated with vegetation (Fisher 1966).
Since not only fulmars but also kittiwakes have been monitored with the count unit of AON, long-term monitoring on the nest site would be useful in comprehending the breeding status. 3D habitat models would supply long-term data on the nest site carrying low and high breeding success in regard of topographical features. Several factors such as density, roof, and ledge were suggested to affect the breeding success in that kittiwakes select nest sites to protect the predators (Massaro et al. 2001; Regehr et al. 1998).
Chapter 6. Conclusions
RPAS-based monitoring is a growing field on conservation biology, and ethical issues regarding disturbance on wildlife has also dealt. In this study, RPAS was deployed in Svalbard coastal cliffs to survey colonial cliff-nesting seabirds such as kittiwakes and fulmars, obeying the guidelines and regulations of aviation safety. Kittiwakes showed minimal vigilance on the aircraft compared to the response of predators, but it should not be hastily concluded that RPAS did not make any immediate or continuous impact on physiological changes.
A total of 35 flights were completed, and thousands of images were obtained. RPAS-driven RGB images (4800x3200) taken within 50m from colonies were clear enough to distinguish every species. These images were used to construct fine-spatial 3D habitat models of each study through SfM photogrammetry. On the other hand, RPAS-driven thermal images (640x512) were much lower in resolution than RGB images, so the aircraft should approach coastal cliffs closer to obtain interpretable thermal images. For this reason, it was difficult to draw a reliable count only with use of thermal images. Thermal cameras still could be used to help the detection of cryptic seabirds and the semi-automated counts.
3D habitat models enabled it simple to calculate and compare densities among colonies. I developed the python script to count each neighbor modified from Massaro et al. (2001), and this method provided quantitative way to understand the relationship between the density and colony size. Application on other species is also promising.
Finally, long-term nest site monitoring would be suggested from a fulmar case study. This fulmar colony was small enough to determine the exact nest site one by one, and fulmars showed high nest site preferences. However, unless fulmars were marked individually, occupations of same nest sites by same pairs could not be guaranteed. If individual identification data exited, RPAS would go further and provide a simple platform to imply nest site fidelity.
References
Aebischer, N., and J. Coulson (1990). Survival of the kittiwake in relation to sex, year, breeding experience and position in the colony. The Journal of Animal Ecology:1063-1071.
Anderson, K., and K. J. Gaston (2013). Lightweight unmanned aerial vehicles will revolutionize spatial ecology. Front Ecol Environ 11:138-146.
Anker-Nilssen, T., R. Barrett, B. Moe, T. K. Reiertsen, G. H. Systad, J. O. Bustnes, S. Christensen-Dalsgaard, S. Descamps, K.-E. Erikstad, A. Follestad, S. A. Hanssen, et al. (2019). Key-site monitoring in Norway 2018, including Svalbard and Jan Mayen. SEAPOP Short Report 1-2019:15.
Anker-Nilssen, T., R. T. Barrett, J. O. Bustnes, S. Christensen-Dalsgaard, K. E. Erikstad, P. Fauchald, S.-H. Lorentsen, H. Steen, H. Strøm, and G. H. Systad (2008). SEAPOP studies in the Barents and Norwegian Seas in 2007. NINA rapport.
Ashmole, N. (1962). The Black Noddy Anous teruirostris on Ascension Island. Part 1. General biology. Ibis 103:235-273.
Bakken, V. (1986). A method for assessing changes in the breeding population of guillemots Uria aalge on Vedoey, Roest. Fauna Norvegica, Series C 9:25-34.
Barrett, R. T., S.-H. Lorentsen, and T. Anker-Nilssen (2006). The status of breeding seabirds in mainland Norway. Atlantic Seabirds 8:97-126.
Bird, E. C. (1994). Cliff hazards and coastal management. Journal of Coastal Research:299-309.
Birkhead, T. (1978). Attendance patterns of guillemots Uria aalge at breeding colonies on Skomer Island. Ibis 120:219-229.
Birkhead, T., and D. Nettleship (1985). The Atlantic Alcidae. London: Academic Press Inc. Birkhead, T. R. (1977). The effect of habitat and density on breeding success in the common
guillemot (Uria aalge). The Journal of Animal Ecology:751-764.
Birkhead, T. R., and D. N. Nettleship (1980). Census methods for murres, Uria species: a unified approach. Canadian Wildlife Service.
Brown, C. R., B. J. Stutchbury, and P. D. Walsh (1990). Choice of colony size in birds. Trends in Ecology & Evolution 5:398-403.
Buckland, S. T., S. J. Marsden, and R. E. Green (2008). Estimating bird abundance: making methods work. Bird Conservation International 18:S91-S108.
Burke, C., M. Rashman, S. Wich, A. Symons, C. Theron, and S. Longmore (2019). Optimizing observing strategies for monitoring animals using drone-mounted thermal infrared cameras. International Journal of Remote Sensing 40:439-467.
Burns, J., D. Delparte, R. Gates, and M. Takabayashi (2015). Integrating structure-from-motion photogrammetry with geospatial software as a novel technique for quantifying 3D ecological characteristics of coral reefs. PeerJ 3:e1077.
Cairns, D. (1988). Seabirds as indicators of marine food supplies. Biological oceanography 5:261-271.
Chabot, D., and D. M. Bird (2012). Evaluation of an off-the-shelf unmanned aircraft system for surveying flocks of geese. Waterbirds 35:170-174.
Chabot, D., S. Craik, and D. M. Bird (2015). Population census of a large Common Tern colony with a small unmanned aircraft. PLoS One 10:e0122588.
Coulson, J., and J. M. Horobin (1972). The annual re‐occupation of breeding sites by the Fulmar. Ibis 114:30-42.
Coulson, J. C. (2002). Colonial breeding in seabirds. Biology of marine birds:87-113. Cullen, E. (1957). Adaptations in the Kittiwake to cliff‐nesting. Ibis 99:275-302.
Cullen, J., and N. Ashmole (1963). The Black Noddy Anous teruirostris on Ascension Island. Part 2. Behaviour. Ibis 103:423-446.
Dahl, T., S. Falk-Petersen, G. Gabrielsen, J. Sargent, H. Hop, and R. Millar (2003). Lipids and stable isotopes in common eider, black-legged kittiwake and northern fulmar: a trophic study from an Arctic fjord. Marine Ecology Progress Series 256:257-269. Danchin, E., and J. Nelson (1991). Behavioral adaptations to cliff nesting in the kittiwake
(Rissa tridactyla): convergences with the gannet (Sula bassana) and the black noddy (Anous tenuirostris). Colonial Waterbirds:103-107.
Danchin, E., and R. H. Wagner (1997). The evolution of coloniality: the emergence of new perspectives. Trends in Ecology & Evolution 12:342-347.
Darling, F. F. (1938). Bird flocks and the breeding cycle; a contribution to the study of avian sociality.
Ditmer, Mark A., John B. Vincent, Leland K. Werden, Jessie C. Tanner, Timothy G. Laske, Paul A. Iaizzo, David L. Garshelis, and John R. Fieberg (2015). Bears show a physiological but limited behavioral response to unmanned aerial vehicles. Curr Biol 25:2278-2283.
Fang, Y.-T., M.-N. Tuanmu, and C.-M. Hung (2018). Asynchronous evolution of interdependent nest characters across the avian phylogeny. Nature communications 9:1-8.
Fazio, N., M. Perrotti, G. Andriani, F. Mancini, P. Rossi, C. Castagnetti, and P. Lollino (2019). A new methodological approach to assess the stability of discontinuous rocky cliffs using in-situ surveys supported by UAV-based techniques and 3-D finite element model: a case study. Engineering Geology 260:105205.
Forsmoo, J., K. Anderson, C. J. Macleod, M. E. Wilkinson, L. DeBell, and R. E. Brazier (2019). Structure from motion photogrammetry in ecology: Does the choice of software matter? Ecology and Evolution 9:12964-12979.
Gade, R., and T. B. Moeslund (2014). Thermal cameras and applications: a survey. Machine vision and applications 25:245-262.
Gilchrist, H. G., and A. J. Gaston (1997). Effects of murre nest site characteristics and wind conditions on predation by glaucous gulls. Canadian Journal of Zoology 75:518-524.
Goebel, M., W. Perryman, J. Hinke, D. Krause, N. Hann, S. Gardner, and D. LeRoi (2015). A small unmanned aerial system for estimating abundance and size of Antarctic predators. Polar Biol 38:619-630.
Gonzalez, L., G. Montes, E. Puig, S. Johnson, K. Mengersen, and K. Gaston (2016). Unmanned aerial vehicles (UAVs) and artificial intelligence revolutionizing wildlife monitoring and conservation. Sensors 16:97.
Hailman, J. P. (1964). Breeding synchrony in the equatorial Swallow-tailed Gull. The American Naturalist 98:79-83.
Hailman, J. P. (1965). Cliff-nesting adaptations of the Galapagos swallow-tailed gull. The Wilson Bulletin:346-362.
Harris, M. (1989). Variation in the correction factor used for converting counts of individual Guillemots Uria aalge into breeding pairs. Ibis 131:85-93.
Harris, M., S. Wanless, T. Barton, and D. Elston (1997). Nest site characteristics, duration of use and breeding success in the guillemot Uria aalge. Ibis 139:468-476.
Harris, M. P., M. Heubeck, M. A. Newell, and S. Wanless (2015). The need for year-specific correction factors (k values) when converting counts of individual Common Guillemots Uria aalge to breeding pairs. Bird Study 62:276-279.
Hobson, K. A., and A. L. Bond (2012). Extending an indicator: year-round information on seabird trophic ecology from multiple-tissue stable-isotope analyses. Marine Ecology Progress Series 461:233-243.
Hodgson, J. C., S. M. Baylis, R. Mott, A. Herrod, and R. H. Clarke (2016). Precision wildlife monitoring using unmanned aerial vehicles. Scientific reports 6:1-7.
Hodgson, J. C., and L. P. Koh (2016). Best practice for minimising unmanned aerial vehicle disturbance to wildlife in biological field research. Current Biology 26:R404-R405. Hodgson, J. C., R. Mott, S. M. Baylis, T. T. Pham, S. Wotherspoon, A. D. Kilpatrick, R. Raja Segaran, I. Reid, A. Terauds, and L. P. Koh (2018). Drones count wildlife more accurately and precisely than humans. Methods Ecol Evol 9:1160-1167.
Hop, H., T. Pearson, E. N. Hegseth, K. M. Kovacs, C. Wiencke, S. Kwasniewski, K. Eiane, F. Mehlum, B. Gulliksen, and M. Wlodarska-Kowalczuk (2002). The marine ecosystem of Kongsfjorden, Svalbard. Polar Research 21:167-208.
Hunter, J. D. (2007). Matplotlib: A 2D graphics environment. Computing in Science & Engineering 9:90-95.
Hutchinson, A. E. (1980). Estimating numbers of colonial nesting seabirds: a comparison of techniques. Pages 235-244 in Proceedings of the Colonial Waterbird Group, vol. 3. JSTOR.
Israel, M., and A. Reinhard (2017). Detecting nests of lapwing birds with the aid of a small unmanned aerial vehicle with thermal camera. Pages 1199-1207 in Unmanned Aircraft Systems (ICUAS), 2017 International Conference on. IEEE.
Iverson, S. J., A. M. Springer, and A. S. Kitaysky (2007). Seabirds as indicators of food web structure and ecosystem variability: qualitative and quantitative diet analyses using fatty acids. Marine Ecology Progress Series 352:235-244.
Jaspers, V. L. B., S. Voorspoels, A. Covaci, G. Lepoint, and M. Eens (2007). Evaluation of the usefulness of bird feathers as a non-destructive biomonitoring tool for organic pollutants: A comparative and meta-analytical approach. Environment International 33:328-337.
Jaud, M., P. Letortu, C. Théry, P. Grandjean, S. Costa, O. Maquaire, R. Davidson, and N. Le Dantec (2019). UAV survey of a coastal cliff face–Selection of the best imaging angle. Measurement 139:10-20.
Kellenberger, B., D. Marcos, and D. Tuia (2018). Detecting mammals in UAV images: Best practices to address a substantially imbalanced dataset with deep learning. Remote Sens Environ 216:139-153.
Kildaw, S. D. (1998). Population status and patterns of distribution and productivity of kittiwakes on St. George Island, Alaska.
Kildaw, S. D. (1999). Competitive displacement? An experimental assessment of nest site preferences of cliff‐nesting gulls. Ecology 80:576-586.
Klukowski, P., M. Augoff, M. Zięba, M. Drwal, A. Gonczarek, and M. J. Walczak (2018). NMRNet: a deep learning approach to automated peak picking of protein NMR spectra. Bioinformatics 34:2590-2597.
Korczak-Abshire, M., A. Zmarz, M. Rodzewicz, M. Kycko, I. Karsznia, and K. Chwedorzewska (2019). Study of fauna population changes on Penguin Island and Turret Point Oasis (King George Island, Antarctica) using an unmanned aerial vehicle. Polar Biol 42:217-224.
Lhoest, S., J. Linchant, S. Quevauvillers, C. Vermeulen, and P. Lejeune (2015). How many hippos (HOMHIP): algorithm for automatic counts of animals with infra-red thermal imagery from UAV. International Archives of the Photogrammetry, Remote Sensing and Spatial Information Sciences 40.
Liguang, S., Z. Renbin, Y. Xuebin, L. Xiaodong, X. Zhouqing, and W. Yuhong (2004). A geochemical method for the reconstruction of the occupation history of a penguin colony in the maritime Antarctic. Polar Biology 27:670-678.
Mackenzie, D. (2012a). A flapping of wings. American Association for the Advancement of Science.
Mackenzie, D. (2012b). It's a Bird, It's a Plane, It's a… Spy? American Association for the Advancement of Science.
Mallory, M. L. (2008). Marine plastic debris in northern fulmars from the Canadian high Arctic. Marine Pollution Bulletin 56:1501-1504.
Mallory, M. L., H. G. Gilchrist, B. M. Braune, and A. J. Gaston (2006). Marine birds as indicators of Arctic marine ecosystem health: linking the Northern Ecosystem Initiative to long-term studies. Environmental Monitoring and Assessment 113:31-48.
Massaro, M., J. W. Chardine, and I. L. Jones (2001). Relationships between black-legged kittiwake nest-site characteristics and susceptibility to predation by large gulls. The Condor 103:793-801.
McCafferty, D. J. (2013). Applications of thermal imaging in avian science. Ibis 155:4-15. Morrison, M. L. (1994). Resource inventory and monitoring: concepts and applications for
ecological restoration. Restoration & Management Notes 12:179-183. Nelson, J. (1965). The behaviour of the Gannet. Br. Birds 58:233-288.
Oliphant, T. E. (2007). Python for scientific computing. Computing in Science & Engineering 9:10-20.
Ratcliffe, N., D. Guihen, J. Robst, S. Crofts, A. Stanworth, and P. Enderlein (2015). A protocol for the aerial survey of penguin colonies using UAVs (unmanned aerial vehicles). J Unmanned Veh Sys 3:95.
Regehr, H. M., M. S. Rodway, and W. A. Montevecchi (1998). Antipredator benefits of nest-site selection in Black-legged Kittiwakes. Canadian Journal of Zoology 76:910-915. Rowan, M. (1952). The Greater Shearwater Puffinus gravis at its breeding grounds. Ibis
94:97-121.
Rush, G. P., L. E. Clarke, M. Stone, and M. J. Wood (2018). Can drones count gulls? Minimal disturbance and semiautomated image processing with an unmanned aerial vehicle for colony-nesting seabirds. Ecol Evol 8:12322-12334.
Sardà‐Palomera, F., G. Bota, C. Viñolo, O. Pallarés, V. Sazatornil, L. Brotons, S. Gomáriz, and F. Sardà (2012). Fine‐scale bird monitoring from light unmanned aircraft systems. Ibis 154:177-183.
Scholten, C., A. Kamphuis, K. Vredevoogd, K. Lee-Strydhorst, J. Atma, C. Shea, O. Lamberg, and D. Proppe (2019). Real-time thermal imagery from an unmanned aerial vehicle