저작자표시 2.0 대한민국 이용자는 아래의 조건을 따르는 경우에 한하여 자유롭게 l 이 저작물을 복제, 배포, 전송, 전시, 공연 및 방송할 수 있습니다. l 이차적 저작물을 작성할 수 있습니다. l 이 저작물을 영리 목적으로 이용할 수 있습니다. 다음과 같은 조건을 따라야 합니다: l 귀하는, 이 저작물의 재이용이나 배포의 경우, 이 저작물에 적용된 이용허락조건 을 명확하게 나타내어야 합니다. l 저작권자로부터 별도의 허가를 받으면 이러한 조건들은 적용되지 않습니다. 저작권법에 따른 이용자의 권리는 위의 내용에 의하여 영향을 받지 않습니다. 이것은 이용허락규약(Legal Code)을 이해하기 쉽게 요약한 것입니다. Disclaimer 저작자표시. 귀하는 원저작자를 표시하여야 합니다.
Doctoral Thesis in
Medical Sciences
Transcriptional profiling of human femoral
mesenchymal stem cells in osteoporosis and its
association with adipogenesis
Ajou University Graduate School
Medical Sciences
Transcriptional profiling of human femoral
mesenchymal stem cells in osteoporosis and its
association with adipogenesis
Yoon-Sok Chung, Advisor
I submit this thesis as the
Doctoral thesis in medical sciences.
August 2018
Ajou University Graduate School
Medical Sciences
Acknowledgement
This study was supported by grants from the National Research Foundation, Korea (NRF-2013R1A1A2006946).
- ABSTRACT-
Transcriptional profiling of human femoral mesenchymal stem cells in
osteoporosis and its association with adipogenesis
Genetic alterations are major contributing factors in the development of osteoporosis. Osteoblasts and adipocytes share a common origin, mesenchymal stem cells (MSCs), and their genetic determinants might be important in the relationship between osteoporosis and adipogenesis. In the present study, I aimed to isolate differentially expressed genes (DEGs) in osteoporosis and normal controls using human MSCs, and elucidate the common pathways and genes related to osteoporosis and adipogenesis. Human MSCs were obtained from the bone marrow of femurs from postmenopausal women during orthopedic surgeries. RNA sequencing (RNA-seq) was carried out using next-generation sequencing (NGS) technology. DEGs were identified using RNA-seq data. Ingenuity pathway analysis (IPA) was used to elucidate the common pathway related to osteoporosis and adipogenesis. Candidate genes for the common pathway were validated with other independent osteoporosis and obese subjects using RT-PCR (reverse transcription-polymerase chain reaction) analysis. Fifty-three DEGs were identified between postmenopausal osteoporosis patients and normal bone mineral density (BMD) controls. Most of the genetic changes were related to the differentiation of cells. The nuclear receptor subfamily 4 group A (NR4A) family was identified as possible common genes related to osteoporosis and adipogenesis. The expression level
of the mRNA of NR4A1 was significantly higher in osteoporosis patients than in controls (p=0.018). The expression level of the mRNA of NR4A2 was significantly higher in obese patients than in controls (p=0.041). Some genetic changes in MSCs are involved in the pathophysiology of osteoporosis. The NR4A family might comprise common genes related to osteoporosis and adipogenesis.
TABLE OF CONTENTS
ABSTRACT ···i
TABLE OF CONTENTS ··· iii
LIST OF FIGURES ··· iv
LIST OF TABLES ··· vi
. Ⅰ INTRODUCTION ··· 1
. Ⅱ MATERIALS AND METHODS ··· 3
. Ⅲ RESULTS ··· 13 . Ⅳ DISCUSSION ··· 30 . Ⅴ CONCLUSION ··· 35 REFERENCES ··· 36 국문요약 ··· 42
LIST OF FIGURES
Fig. 1. Human MSCs were obtained from the bone marrow of femurs during total hip or knee arthroplasty due to osteoarthritis or hip fracture. ··· 5
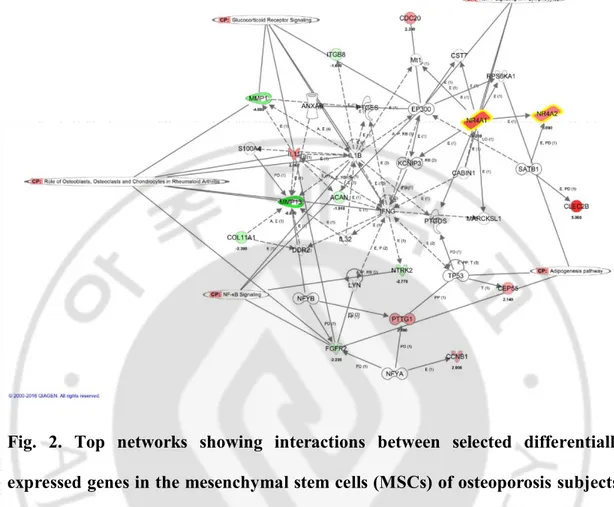
Fig. 2. Top networks showing interactions between selected DEGs in the MSCs of osteoporosis subjects. ··· 24
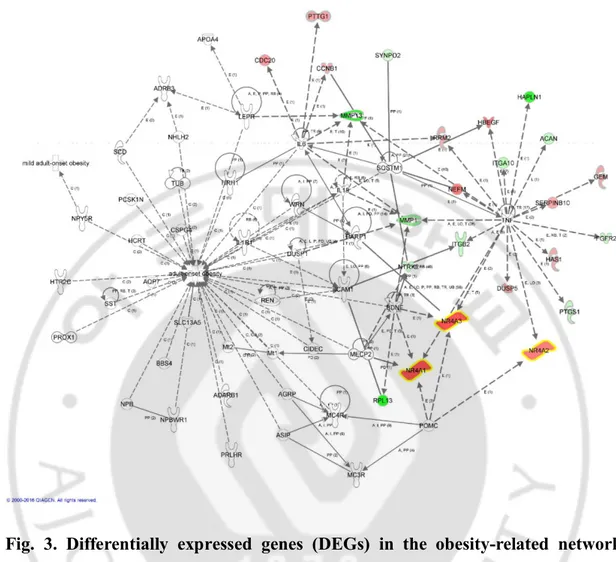
Fig. 3. DEGs in the obesity-related network among the 53 DEGs using IPA ··· 25
Fig 4. Increased expression of the NR4A family in other osteoporosis subjects (A), obese subjects (B), and ovariectomized mice (C). ··· 28
LIST OF TABLES
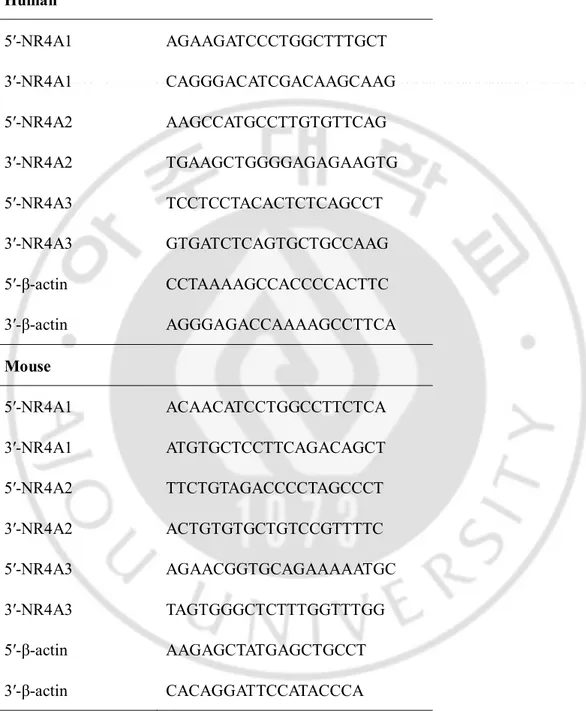
Table 1. The PCR human and mouse primers ··· 10
Table 2. Clinical characteristics of the study subjects for RNA-seq. ··· 14
Table 3. Fifty-three up- or downregulated genes in MSCs of osteoporosis subjects compared to controls by RNA-seq data. ··· 15
Table 4. Enriched function annotation of DEG sets using IPA. ··· 19
Table 5. Canonical IPA of the 53 DEGs of the MSCs of osteoporosis subjects. ·· 21
Table 6. Clinical characteristics of the study subjects for validation of NR4A family as candidate common genes related to osteoporosis and adipogenesis. ··· 29
I. INTRODUCTION
Osteoporosis is a common disease characterized by low bone mass and deteriorated microarchitecture, resulting in fragility fractures.1–2 Although multiple
risk factors such as advanced age, long-term glucocorticoid use, low body weight, tobacco use, or excess alcohol use contribute to the development of osteoporosis,3
approximately 60% of peak bone mass is genetically determined and is a major contributing factor for the development of osteoporosis.4 However, the
osteoporosis-related genes that have been identified to date using current advanced technologies explain no more than 10% of the variation in bone mineral density (BMD) in any individual human population.5 Causal genes and molecular mechanisms leading to osteoporosis still remain to be elucidated.
Bone-forming osteoblasts are derived from mesenchymal stem cells (MSCs). The allocation of MSCs into osteoblasts is accelerated after skeletal injury and during the rapid growth phase of puberty.6 Although MSCs are the source of osteoblast, it is not currently well known if individual intrinsic genetic differences in these cells contribute to osteoporotic bone loss.7
MSCs also differentiate into adipocytes.8 Two disorders of body composition, obesity and osteoporosis, have increased in prevalence during the last three decades.6 There has been a great increase in the understanding of interactions between bone and fat.9 Bone and fat cells share a common origin, and their fates are interrelated in a specific manner.6 There are many clinical experiences related to these phenomena.
For example, glucocorticoids markedly enhance marrow adipogenesis at the expense of osteoblast differentiation.10 Thiazolidinediones (TZDs) reduce bone mass and
increase the risk of osteoporotic fractures because MSCs switch into the adipocyte lineage.11In a recent study, compared with normal premenopausal
controls,premenopausal women with idiopathic osteoporosis hadevidence of excess marrow adiposity. Osteoblastand adipocyte differentiation pathways may contribute tothe pathogenesis of this condition.12Genetic determinants might be important in the switch of stem cells for both physiologic and pathologic states.6
Recently, whole-transcriptome sequencing using next-generation sequencing (NGS) technologies or RNA sequencing (RNA-seq) has started to reveal the complex landscape and dynamics of the transcriptome at a remarkable sensitivity and accuracy.13-14 RNA-seq enables not only the identification of differentially expressed
genes (DEGs) but also the precise quantitative determination of exon and isoform (alternative splicing) expression, along with the unbiased characterization of novel exons and novel transcript clusters.15
In the present study, I isolated human MSCs from the bone marrow of typical severe osteoporosis patients and controls with normal BMD and identified DEGs using NGS technology. Subsequently, I elucidated the common pathway and genes related to osteoporosis and adipogenesis using ingenuity pathway analysis (IPA) of the identified DEGs.
II. MATERIALS AND METHODS
1. Study subjects
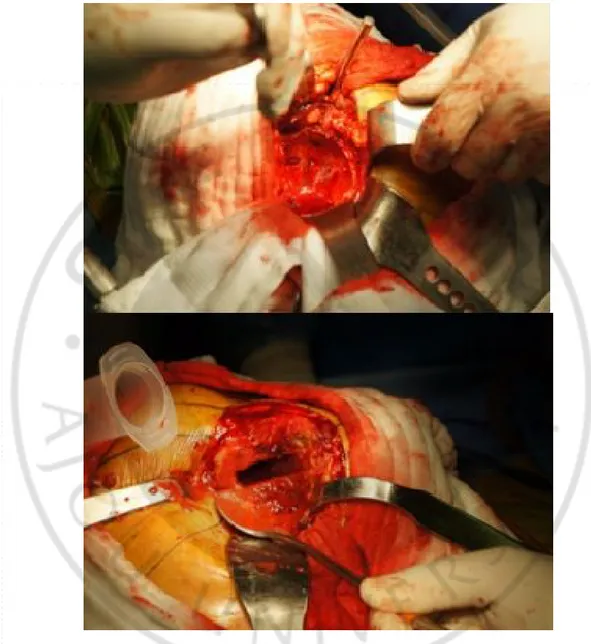
This study was approved by the Ajou University Hospital Institutional Review Board (AJIRB-GEN-GEN-11-332), and full informed written consent was obtained from all of the subjects. Human MSCs were obtained from the bone marrow of femurs during total hip or knee arthroplasty due to osteoarthritis or hip fracture (Fig.1).
All of the subjects were postmenopausal women aged ≥ 60 years. Subjects with other metabolic disorders and/or secondary causes of osteoporosis were not included. Height and body weight were measured using standard methods, with the subjects wearing light clothing. The body mass index (BMI) was calculated as the weight divided by the height squared (kg/m2). Densitometric examinations were performed using a Lunar iDXA apparatus (GE Lunar, Madison, WI, USA). For lumbar spine BMD, when specific vertebrae were not suitable for analysis due to compression fracture or degenerative changes or any other reasons, it was calculated excluding the affected vertebrae. The coefficients of variation (CVs) for BMD were 0.975% (L1-L4), 0.888% (femur neck), and 0.738% (total hip). 30 subjects had been previously scanned twice for precision testing according to the International Society for Clinical Densitometry (ISCD) recommendations16. Patients were diagnosed with a vertebral fracture when at least one of the three height measurements decreased by >25% compared to the nearest uncompressed vertebral body. All of the subjects in
the severe osteoporosis group had vertebral fractures or hip fractures and low BMD (the T-score of the lumbar spine, total hip, or femoral neck was -2.5 or less). All of the subjects in the control group had no fracture and normal BMD (the T-scores of the lumbar spine, total hip, and femoral neck were -1.0 or above). For the validation of candidate common genes related to osteoporosis and adipogenesis with other independent subjects, two osteoporosis patients with hip fractures low BMD (T-score
≤ -2.5) and controls with normal BMD, two obese patients and non-obese controls
with similar BMDs (T-score < -1 and < -2.5) were recruited. Obesity was defined as
BMI ≥25 kg/m2, according to the Korean Society for the Study of Obesity17. Fasting blood samples were drawn from the antecubital area between 08:00 and 11:00 h. The concentrations of calcium and phosphorus were measured using automated techniques. The concentration of 25-hydroxyvitamin D (25(OH)D) was assayed using a radioimmunoassay kit (DiaSorin, Stillwater, MN, USA).
Fig. 1. Human mesenchymal stem cells were obtained from the bone marrow of femurs during total hip or knee arthroplasty due to osteoarthritis or hip fracture.
2. Human MSC culture
MSCs were isolated by negative immunoselection (RosetteSep Isolation Kit, STEMCELL Technologies Inc., Vancouver, Canada) according to the manufacturer’s instructions. Briefly, the cells were incubated for 25 min with the depletion cocktail of tetrameric antibodies at room temperature. Next, the cells were diluted with phosphate-buffered saline and isolated by density-gradient centrifugation. The isolated MSCs were plated into vented 25 cm2 tissue culture flasks (Thermo Scientific, Waltham, MA USA) with Complete MesenCult® Medium (Human) and MesenCult® MSC Basal Medium (Human) mixed with Mesenchymal Stem Cell Stimulatory Supplements (Human) (STEMCELL Technologies Inc., Vancouver, Canada) and antibiotics (Welgene, Gyeongsan, South Korea). The flasks were incubated at 37°C in a humidified atmosphere containing 5% CO2; after 7 days,
half of the medium was replaced with fresh medium. Then the cells were cultured with a half-medium change every week until the fibroblast-like cells at the base of the flask reached confluence. On reaching confluence, the adherent cells were detached using 0.25% trypsin and were re-seeded at 1 × 10⁵ cells per 25 cm2 flask
(4000 per 1 cm2; first passage). These cells were incubated again until confluence and were once again trypsinized and re-seeded at 1 × 10⁵ cells per 25 cm2 flask (4000
per 1 cm2; second passage). At the end of the second passage, once the cells reached confluence, they were trypsinized and either cryo-preserved or used immediately.18
3. Mouse MSC preparation
Femurs were isolated from 22-week-old ovariectomized and sham-operated DDY female mice. Bone marrow was flushed with α-MEM (Gibco, Franklin Lakes, NJ, USA) containing 10% fetal bovine serum (FBS) (Gibco) and was maintained in α-MEM containing 10% FBS media. The animal research procedures were approved by the Animal Care and Use Committee of the Ajou University School of Medicine (IACUC No. 2014-0066), and all experiments were conducted in accordance with the institutional guidelines established by the committee. All efforts were made to minimize animal suffering and to reduce the number of mice used.
4. RNA isolation
Total RNA was isolated using the RNeasy Micro Kit (Qiagen, Valencia, CA) and was treated with the Turbo DNA-freeTM Kit (Life Technologies, Grand Island, NY, USA) to remove potential contaminating DNA that may lead to false-positive amplification. The quality and purity of RNA were confirmed using a Nanodrop spectrophotometer (Thermo Scientific, Waltham, MA, USA). The resulting intact RNA was used in RNA-seq and QPCR analysis.
5. Whole-transcriptome RNA sequencing
RNA-seq was carried out by TheragenEtexBio Institute (Suwon, South Korea). Prior to constructing a cDNA library, 2 μg total RNA was treated with DNase I, and
magnetic beads with Oligo (dT) were used to enrich poly (A) mRNA. Next, the purified mRNAs were disrupted into short fragments, and double-stranded cDNAs were immediately synthesized. The cDNAs were subjected to end-repair and poly (A) addition and then were connected with sequencing adaptors using the TruSeq RNA Sample Prep Kit (Illumina). Suitable fragments, automatically purified using a BluePippin 2% agarose gel cassette (Sage Science, MA, USA), were selected as templates for PCR amplification. The final library sizes and qualities were evaluated electrophoretically using an Agilent High Sensitivity DNA kit (Agilent Technologies); the fragment size range was 350–450 bp. Subsequently, the library was sequenced using an HiSeq 2500 sequencer (Illumina, San Diego, CA, USA) in rapid-run mode. Clusters were generated, followed by 2 × 100 cycle sequencing reads separated by a paired-end turnaround. Image analysis was performed using the HiSeq control software version 1.8.4.
6. Semi-quantitative reverse transcription-polymerase chain reaction (RT-PCR) analysis
The expression levels of mRNA were compared using semi-quantitative RT-PCR carried out using the iNtRON’s Maxime RT-PCR PreMix (i-StarTaq)™ kit (iNtRON Biotechnology, Seongnam, South Korea). Briefly, cDNA was synthesized using the iNtRON’sHiSenScript™ RH[-] RT PreMix Kit (iNtRON Biotechnology, Seongnam, South Korea) and then was subjected to PCR amplification with the
primer sets for different genes. The PCR human and mouse primers are provided in Table 1.
The PCR cycle conditions for nuclear receptor subfamily 4 group A member 1 (NR4A1), nuclear receptor subfamily 4 group A member 2 (NR4A2), and nuclear receptor subfamily 4 group A member 1 (NR4A3) were 28 cycles of 30 s denaturation at 95°C, 30 s annealing at 55°C, and 60 s extension at 72°C. The PCR cycle conditions for actin were 26 cycles of 30 s denaturation at 95°C, 30 s annealing at 55°C, and 60 s extension at 72°C. The amplified PCR products were separated by electrophoresis on a 1.5% agarose gel and stained with ethidium bromide. The expression levels of amplified DNA were quantitatively determined via densitometric analysis of stained bands. The relative quantity of amplified DNA was compared based on the amplified actin DNA.
Table 1. The PCR human and mouse primers. Human 5′-NR4A1 AGAAGATCCCTGGCTTTGCT 3′-NR4A1 CAGGGACATCGACAAGCAAG 5′-NR4A2 AAGCCATGCCTTGTGTTCAG 3′-NR4A2 TGAAGCTGGGGAGAGAAGTG 5′-NR4A3 TCCTCCTACACTCTCAGCCT 3′-NR4A3 GTGATCTCAGTGCTGCCAAG 5′-β-actin CCTAAAAGCCACCCCACTTC 3′-β-actin AGGGAGACCAAAAGCCTTCA Mouse 5′-NR4A1 ACAACATCCTGGCCTTCTCA 3′-NR4A1 ATGTGCTCCTTCAGACAGCT 5′-NR4A2 TTCTGTAGACCCCTAGCCCT 3′-NR4A2 ACTGTGTGCTGTCCGTTTTC 5′-NR4A3 AGAACGGTGCAGAAAAATGC 3′-NR4A3 TAGTGGGCTCTTTGGTTTGG 5′-β-actin AAGAGCTATGAGCTGCCT 3′-β-actin CACAGGATTCCATACCCA
7. RNA sequencing data and pathway analysis
Quality scores and read lengths of RNA-seq were checked by mapping to the human reference genome (h19 genome build) using Tophat19 with default parameters. The expression levels of genes from RNA-seq reads were quantified using htseq-count software,20 which preprocessed RNA-seq data for differential expression analysis by counting the overlap of reads with genes. Afterwards, the fragments per kilobase of exon per million fragments mapped (FPKM) was calculated with each transcribed fragment in the sample as a quantified expression level. Pathway analysis was performed using Ingenuity pathway analysis software (Ingenuity Systems, Redwood City, CA, USA).
8. Statistical analyses
I compared the genomic profiles of MSCs in a group of four patients and controls. DEGs were measured by counting tags from osteoporosis samples against normal samples and were normalized using the trimmed mean of M-values normalization method (TMM) method (edgeR).21 Significantly upregulated genes of
MSCs in osteoporosis were those with q-values < 0.05 and log2 fold changes (FC) > 2, whereas the control groups were defined as q-values < 0.05 and log2 FC < -2. For pathway enrichment analysis of DEGs, the right-tailed Fisher’s exact test was used to calculate a p-value to determine the probability so that the biological function assigned to a specific osteoporosis-induced network was due to chance alone.
For the RT-PCR analyses and subjects’ baseline characteristics, statistical comparisons were performed using IBM SPSS Statistics 23 (SPSS Inc., Chicago, IL, USA), and the data are presented as the means ± standard error of means (SEMs).
III. RESULTS
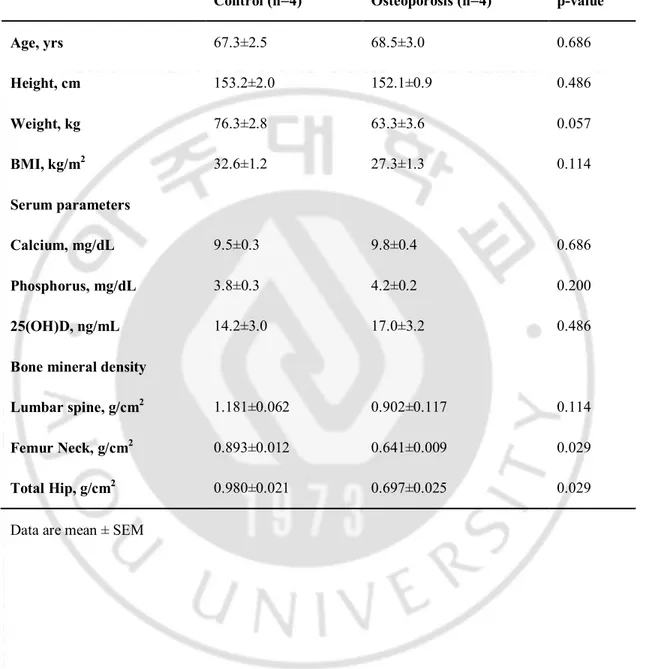
I compared the transcriptome of MSCs from four patients (aged 62–74 years) with severe osteoporosis and MSCs of the age-matched control group with normal BMD (60–71 years old) (Table 2). There were no statistically significant differences in the baseline characteristics such as age, height, weight, and BMI. The control group showed higher lumbar spine BMD compared to osteoporosis group but did not show statistical significancebecause of the degenerative changes of the study subjects’ spines. However, the BMDs for femur neck and total hip were significantly lower in the osteoporosis group.
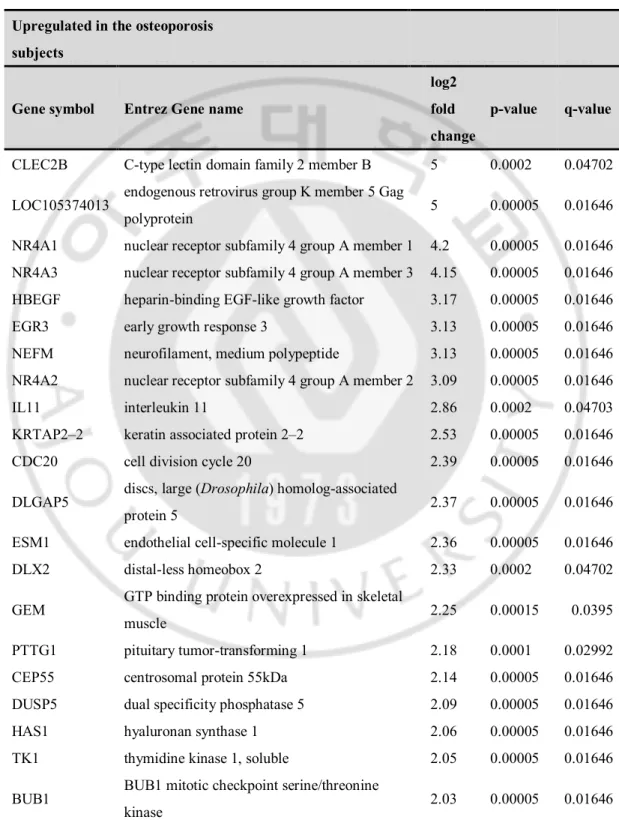
Table 3 lists the 53 most highly expressed DEGs between the osteoporosis and normal subjects, which included 28 and 25 genes that were expressed at higher and lower levels, respectively, in osteoporosis subjects compared to normal subjects. C-type lectin domain family 2 member B (CLEC2B, FC=5), endogenous retrovirus group K member 5 Gag polyprotein (LOC105374013, FC=5), NR4A1 (FC=4.2), NR4A3 (FC=4.15), and heparin-binding EGF-like growth factor (HBEGF, FC=3.17) were upregulated whereas the remaining DEGs, namely, matrix metallopeptidase 13 (MMP13, FC=−8), septin 7 (SEPT, FC=−8), solute carrier family 26 member 7 (SLC26A7, FC=−8), and sparc/osteonectin, cwcv, and kazal-like domains proteoglycan 3 (SPOCK3, FC=-8), were downregulated.
Table 2. Clinical characteristics of the study subjects for RNA-seq.
Control (n=4) Osteoporosis (n=4) p-value
Age, yrs 67.3±2.5 68.5±3.0 0.686 Height, cm 153.2±2.0 152.1±0.9 0.486 Weight, kg 76.3±2.8 63.3±3.6 0.057 BMI, kg/m2 32.6±1.2 27.3±1.3 0.114 Serum parameters Calcium, mg/dL 9.5±0.3 9.8±0.4 0.686 Phosphorus, mg/dL 3.8±0.3 4.2±0.2 0.200 25(OH)D, ng/mL 14.2±3.0 17.0±3.2 0.486
Bone mineral density
Lumbar spine, g/cm2 1.181±0.062 0.902±0.117 0.114
Femur Neck, g/cm2 0.893±0.012 0.641±0.009 0.029
Total Hip, g/cm2 0.980±0.021 0.697±0.025 0.029
Table 3. Fifty-three up- or downregulated genes in mesenchymal stem cells of osteoporosis subjects compared to controls by RNA-seq data.
Upregulated in the osteoporosis subjects
Gene symbol Entrez Gene name
log2 fold change
p-value q-value
CLEC2B C-type lectin domain family 2 member B 5 0.0002 0.04702 LOC105374013 endogenous retrovirus group K member 5 Gag
polyprotein 5 0.00005 0.01646 NR4A1 nuclear receptor subfamily 4 group A member 1 4.2 0.00005 0.01646 NR4A3 nuclear receptor subfamily 4 group A member 3 4.15 0.00005 0.01646 HBEGF heparin-binding EGF-like growth factor 3.17 0.00005 0.01646 EGR3 early growth response 3 3.13 0.00005 0.01646 NEFM neurofilament, medium polypeptide 3.13 0.00005 0.01646 NR4A2 nuclear receptor subfamily 4 group A member 2 3.09 0.00005 0.01646 IL11 interleukin 11 2.86 0.0002 0.04703 KRTAP2–2 keratin associated protein 2–2 2.53 0.00005 0.01646 CDC20 cell division cycle 20 2.39 0.00005 0.01646 DLGAP5 discs, large (Drosophila) homolog-associated
protein 5 2.37 0.00005 0.01646 ESM1 endothelial cell-specific molecule 1 2.36 0.00005 0.01646 DLX2 distal-less homeobox 2 2.33 0.0002 0.04702 GEM GTP binding protein overexpressed in skeletal
muscle 2.25 0.00015 0.0395
PTTG1 pituitary tumor-transforming 1 2.18 0.0001 0.02992 CEP55 centrosomal protein 55kDa 2.14 0.00005 0.01646 DUSP5 dual specificity phosphatase 5 2.09 0.00005 0.01646 HAS1 hyaluronan synthase 1 2.06 0.00005 0.01646 TK1 thymidine kinase 1, soluble 2.05 0.00005 0.01646 BUB1 BUB1 mitotic checkpoint serine/threonine
RRM2 ribonucleotide reductase regulatory subunit M2 2.02 0.0001 0.02992
CCNB1 cyclin B1 2 0.00005 0.01646
SERPINB10 serpin peptidase inhibitor, clade B (ovalbumin),
member 10 2 0.00005 0.01646
MLPH melanophilin 1.88 0.0002 0.04706 SHCBP1 SHC SH2-domain binding protein 1 1.83 0.00005 0.01646 TACC3 transforming, acidic coiled-coil containing
protein 3 1.76 0.0001 0.02992 CSRNP1 cysteine-serine-rich nuclear protein 1 1.64 0.00015 0.0395
Downregulated in the osteoporosis subjects
Gene symbol Entrez Gene name
log2 fold change
p-value q-value
CFHR1 complement factor H-related 1 -8 0.00005 0.01646 FRMPD2 FERM and PDZ domain containing 2 -8 0.00005 0.01646 MMP13 matrix metallopeptidase 13 -8 0.00015 0.0395 PKD1 polycystic kidney disease 1 (autosomal
dominant) -8 0.00015 0.0395
RPL13 ribosomal protein L13 -8 0.00005 0.01646
SETP7 septin 7 -8 0.00005 0.01646
SLC26A7 solute carrier family 26 (anion exchanger),
member 7 -8 0.00005 0.01646
SPOCK3 sparc/osteonectin, cwcv and kazal-like domains
proteoglycan 3 -8 0.00005 0.01646 HAPLN1 hyaluronan and proteoglycan link protein 1 -7.26 0.00005 0.01646 MMP1 matrix metallopeptidase 1 -4.8 0.00005 0.01646 NPTX1 neuronal pentraxin I -4.39 0.00005 0.01646 COMP cartilage oligomeric matrix protein -3.45 0.00005 0.01646 NTRK2 neurotrophic tyrosine kinase, receptor, type 2 -2.77 0.00005 0.01646 COL11A1 collagen, type XI, alpha 1 -2.39 0.00005 0.01646 ITGA10 integrin subunit alpha 10 -2.31 0.0001 0.02992 ITGB2 integrin subunit beta 2 -2.28 0.00005 0.01646 FGFR2 fibroblast growth factor receptor 2 -2.22 0.00005 0.01646
PTGS1 prostaglandin-endoperoxide synthase 1 -2.14 0.00005 0.01646 ACAN aggrecan -1.91 0.00005 0.01646 MOXD1 monooxygenase, DBH-like 1 -1.72 0.0002 0.04702 PDK4 pyruvate dehydrogenase kinase 4 -1.72 0.00005 0.01646 ITGB8 integrin subunit beta 8 -1.6 0.00005 0.01646 FNDC1 fibronectin type III domain containing 1 -1.59 0.00015 0.0395 SYNPO2 synaptopodin 2 -1.45 0.00015 0.0395 EDIL3 EGF-like repeats and discoidin I-like domains 3 -1.42 0.0002 0.04702
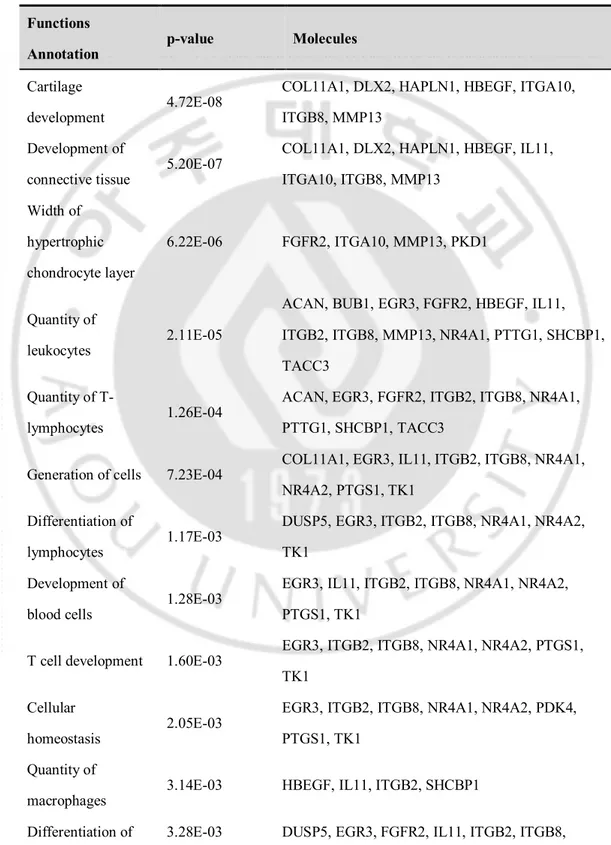
The interactions among the identified DEGs were examined using IPA. RNA-seq data were mapped onto the networks to explore dynamic changes during the MSC process. The biological functions that were significantly associated with the genes in the core networks were identified by functional analysis based on the Ingenuity’s knowledge base. In all, 33 candidate network genes and 54 candidate functions/pathways genes were found. Table 4 shows the most significant gene networks of the DEGs of MSCs in osteoporosis patients. The top functions were related to cellular development, differentiation of cells, differentiation of connective tissue cells, cellular growth, and proliferation. Moreover, the differentiation of adipocytes was also related to the identified DEGs (NR4A1, NR4A2 and NR4A3).
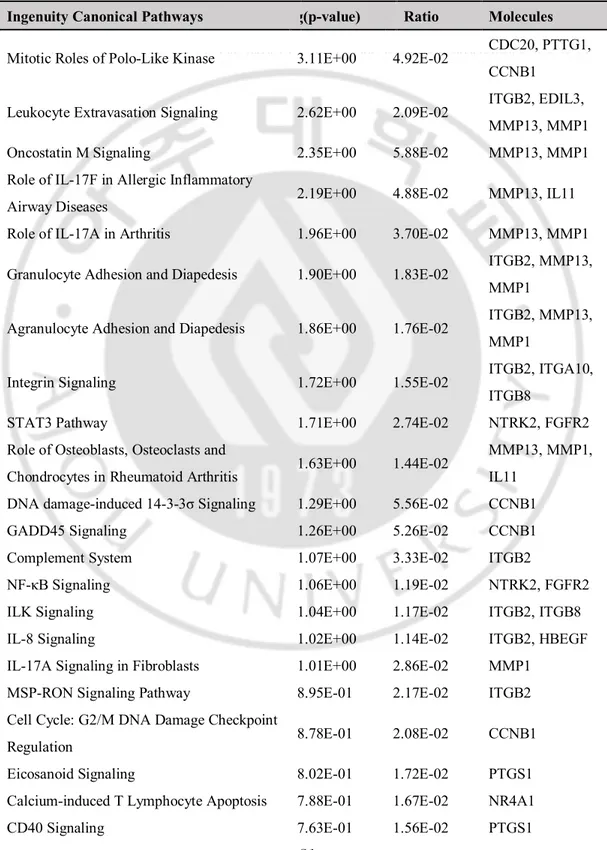
I also investigated IPA canonical pathways in the DEGs of MSCs in osteoporosis patients (Table 5). The associated effects were categorized in the mitotic roles of polo-like kinase, integrin signaling, Signal transducer and activator of transcription 3 (STAT3) pathway, nuclear factor kappa-light-chain-enhancer of activated B cells (NF-κB) signaling, cell cycle: G2/M DNA damage checkpoint
regulation and cell cycle regulation. In addition, pathways related to osteoblasts, osteoclasts, and chondrocytes in rheumatoid arthritis were altered. Interestingly, changes in the adipogenesis pathway were also found.
Table 4. Enriched function annotation of differentially expressed gene sets using ingenuity pathway analysis.
Functions
Annotation p-value Molecules
Cartilage
development 4.72E-08
COL11A1, DLX2, HAPLN1, HBEGF, ITGA10, ITGB8, MMP13
Development of
connective tissue 5.20E-07
COL11A1, DLX2, HAPLN1, HBEGF, IL11, ITGA10, ITGB8, MMP13 Width of hypertrophic chondrocyte layer 6.22E-06 FGFR2, ITGA10, MMP13, PKD1 Quantity of leukocytes 2.11E-05
ACAN, BUB1, EGR3, FGFR2, HBEGF, IL11, ITGB2, ITGB8, MMP13, NR4A1, PTTG1, SHCBP1, TACC3
Quantity of T-
lymphocytes 1.26E-04
ACAN, EGR3, FGFR2, ITGB2, ITGB8, NR4A1, PTTG1, SHCBP1, TACC3
Generation of cells 7.23E-04 COL11A1, EGR3, IL11, ITGB2, ITGB8, NR4A1, NR4A2, PTGS1, TK1
Differentiation of
lymphocytes 1.17E-03
DUSP5, EGR3, ITGB2, ITGB8, NR4A1, NR4A2, TK1
Development of
blood cells 1.28E-03
EGR3, IL11, ITGB2, ITGB8, NR4A1, NR4A2, PTGS1, TK1
T cell development 1.60E-03 EGR3, ITGB2, ITGB8, NR4A1, NR4A2, PTGS1, TK1
Cellular
homeostasis 2.05E-03
EGR3, ITGB2, ITGB8, NR4A1, NR4A2, PDK4, PTGS1, TK1
Quantity of
macrophages 3.14E-03 HBEGF, IL11, ITGB2, SHCBP1
cells NR4A1, NR4A2, NR4A3, TK1 Differentiation of T-
lymphocytes 7.03E-03 EGR3, ITGB2, ITGB8, NR4A1, NR4A2 Quantity of
thymocytes 7.53E-03 EGR3, ITGB2, NR4A1, TACC3 Quantity of CD4+
T-lymphocytes 1.40E-02 ACAN, ITGB2, SHCBP1 Quantity of
phagocytes 1.44E-02 HBEGF, IL11, ITGB2, MMP13, SHCBP1 Development of
hematopoietic progenitor cells
1.55E-02 EGR3, IL11, TK1
Differentiation of connective tissue cells
2.11E-02 FGFR2, IL11, NR4A1, NR4A2, NR4A3
Development of
lymphatic system 2.31E-02 EGR3, IL11, TK1 Differentiation of
adipocytes 2.58E-02 NR4A1, NR4A2, NR4A3
Table 5. Canonical ingenuity pathway analysis of the 53 differentially expressed genes of the mesenchymal stem cells of osteoporosis subjects.
Ingenuity Canonical Pathways log(p-value) Ratio Molecules
Mitotic Roles of Polo-Like Kinase 3.11E+00 4.92E-02 CDC20, PTTG1, CCNB1
Leukocyte Extravasation Signaling 2.62E+00 2.09E-02 ITGB2, EDIL3, MMP13, MMP1 Oncostatin M Signaling 2.35E+00 5.88E-02 MMP13, MMP1 Role of IL-17F in Allergic Inflammatory
Airway Diseases 2.19E+00 4.88E-02 MMP13, IL11 Role of IL-17A in Arthritis 1.96E+00 3.70E-02 MMP13, MMP1 Granulocyte Adhesion and Diapedesis 1.90E+00 1.83E-02 ITGB2, MMP13,
MMP1
Agranulocyte Adhesion and Diapedesis 1.86E+00 1.76E-02 ITGB2, MMP13, MMP1
Integrin Signaling 1.72E+00 1.55E-02 ITGB2, ITGA10, ITGB8
STAT3 Pathway 1.71E+00 2.74E-02 NTRK2, FGFR2 Role of Osteoblasts, Osteoclasts and
Chondrocytes in Rheumatoid Arthritis 1.63E+00 1.44E-02
MMP13, MMP1, IL11
DNA damage-induced 14-3-3σ Signaling 1.29E+00 5.56E-02 CCNB1 GADD45 Signaling 1.26E+00 5.26E-02 CCNB1 Complement System 1.07E+00 3.33E-02 ITGB2
NF-κB Signaling 1.06E+00 1.19E-02 NTRK2, FGFR2 ILK Signaling 1.04E+00 1.17E-02 ITGB2, ITGB8 IL-8 Signaling 1.02E+00 1.14E-02 ITGB2, HBEGF IL-17A Signaling in Fibroblasts 1.01E+00 2.86E-02 MMP1
MSP-RON Signaling Pathway 8.95E-01 2.17E-02 ITGB2 Cell Cycle: G2/M DNA Damage Checkpoint
Regulation 8.78E-01 2.08E-02 CCNB1 Eicosanoid Signaling 8.02E-01 1.72E-02 PTGS1 Calcium-induced T Lymphocyte Apoptosis 7.88E-01 1.67E-02 NR4A1 CD40 Signaling 7.63E-01 1.56E-02 PTGS1
NF-κB Activation by Viruses 7.11E-01 1.37E-02 ITGB2 Role of Macrophages, Fibroblasts and
Endothelial Cells in Rheumatoid Arthritis 6.96E-01 7.12E-03 MMP13, MMP1 Cyclins and Cell Cycle Regulation 6.95E-01 1.32E-02 CCNB1
G Beta Gamma Signaling 6.57E-01 1.19E-02 HBEGF Corticotropin Releasing Hormone Signaling 5.76E-01 9.62E-03 NR4A1 RhoA Signaling 5.55E-01 9.09E-03 SEPT7 Role of Pattern Recognition Receptors in
Recognition of Bacteria and Viruses 5.26E-01 8.40E-03 IL11 Adipogenesis pathway 4.97E-01 7.75E-03 FGFR2 Signaling by Rho Family GTPases 3.28E-01 4.69E-03 SEPT7 Protein Ubiquitination Pathway 2.84E-01 4.07E-03 CDC20 Glucocorticoid Receptor Signaling 2.63E-01 3.77E-03 MMP1
IPA software enables the systemic analysis of RNA-seq and other data in a biologic context. My up- or downregulated genes were overlaid onto a global molecular network developed from information contained in the Ingenuity Pathways Knowledge Base. Then the networks of these focus genes were algorithmically generated based on their interrelationships. Fig.2 includes several genes encoding the regulators of osteoblasts, osteoclasts, and chondrocytes in rheumatoid arthritis and glucocorticoid receptor signaling. In the network, the NR4A family is associated with the roles of these cells in rheumatoid arthritis.
To elucidate the common pathways related to osteoporosis and adipogenesis, the DEGs in the obesity-related network were identified from among the 53 DEGs using IPA (Fig.3). Numerous DEGs were related to the obesity pathway, such as the NR4A family, matrix metallopeptidase 1 (MMP1), and fibroblast growth factor receptor 2 (FGFR2). Among them, the NR4A family was highly upregulated in osteoporosis patients and was closely related to the adipogenesis pathway. In addition, TNF, which is an upstream regulator of the NR4A family, is related to the adipogenesis pathway, NF-κB signaling and glucocorticoid receptor signaling.
Fig. 2. Top networks showing interactions between selected differentially expressed genes in the mesenchymal stem cells (MSCs) of osteoporosis subjects.
Red indicates transcripts upregulated in the MSCs of osteoporosis subjects. Green indicates transcripts downregulated in the MSCs of osteoporosis subjects. White indicates transcripts not differentially expressed in my study but important in the network. The color gradient in the network indicates the strength of the expression
denoted by fold changes. (→) indicates direct interaction between the transcript
products; (--->) indicates indirect interaction between the transcript products; ⟲ indicates autoregulation.
Fig. 3. Differentially expressed genes (DEGs) in the obesity-related network among the 53 DEGs using ingenuity pathway analysis. Numerous DEGs were
related to the obesity pathway, such as the NR4A family, matrix metallopeptidase 1 (MMP1), and fibroblast growth factor receptor 2 (FGFR2). Among them, the NR4A family was highly upregulated in osteoporosis patients and was closely related to the adipogenesis pathway. Red indicates transcripts upregulated in the mesenchymal stem cells (MSCs) of osteoporosis subjects. Green indicates transcripts downregulated in the MSCs of osteoporosis subjects. White indicates transcripts not differentially expressed in my study but important in the network.
The color gradient in the network indicates the strength of expression denoted by
fold changes. (→) indicates direct interaction between the transcript products; (--->)
indicates indirect interaction between the transcript products; ⟲ indicates autoregulation.
To validate this family as candidate common genes related to osteoporosis and adipogenesis, the expression levels of the mRNAs of NR4A1, NR4A2, and NR4A3 were compared using semi-quantitative RT-PCR with other independent subjects (two osteoporosis patients and controls, two obese patients and non-obese controls with similar BMDs (T-score < -1 and < -2.5]) (Fig.4). The baseline characteristics of these subjects are shown in Table 6. The expression level of NR4A1 mRNA was significantly higher in osteoporosis patients than in controls (p=0.018). However, there were also nonsignificant trends of increased expression of NR4A2 (p=0.056) and NR4A3 (p=0.664) in osteoporosis patients compared to controls. The expression levels of NR4A2 mRNA were significantly higher in obese patients than in controls (p=0.041). There were also trends of increased expression of NR4A1 (p=0.450) and NR4A3 (p=0.308) in obese patients compared to controls. I also compared the expression of the NR4A family between the MSCs of ovariectomized and sham-operated mice using RT-PCR. NR4A1 and NR4A3 were significantly upregulated in ovariectomized mice (p<0.001) (Fig.4).
Fig .4. Increased expression of the NR4A family in other osteoporosis subjects (A), obese subjects (B), and ovariectomized mice (C). Data are expressed as the
expression level of NR4A1–3 relative to the expression level of actin. Sham: sham-operated DDY female mice; Ovx: ovariectomized DDY female mice.
Table 6. Clinical characteristics of the study subjects for validation of NR4A family as candidate common genes related to osteoporosis and adipogenesis.
Normal BMD (n=2) Osteoporosis (n=2) p-value Non-Obese (n=2) Obese (n=2) p-value Age, yrs 72.5±1.5 70.5±5.5 0.759 72.5±1.5 67.5±7.5 0.580 Height, cm 153.0±3.0 154.9±3.1 0.693 152.7±0.4 154.0±7.2 0.869 Weight, kg 68.5±1.9 58.0±6.0 0.238 50.9±4.2 73.6±3.2 0.049 BMI, kg/m2 29.3±1.9 24.1±1.5 0.168 21.8±1.7 31.1±1.6 0.056 Serum parameters Calcium, mg/dL 9.3±0.6 9.3±0.3 0.495 9.3±0.0 9.8±0.1 0.070 Phosphorus, mg/dL 3.5±0.5 3.4±0.1 0.863 4.3±0.5 3.4±0.2 0.297 25(OH)D, ng/mL 18.0±7.0 19.5±6.6 0.890 15.0±3.6 8.4±0.4 0.314
Bone mineral density Lumbar spine, g/cm2 1.180±0.164 0.719±0.023 0.108 1.200±0.235 0.979±0.058 0.515 Femur Neck, g/cm2 0.875±0.030 0.610±0.034 0.028 0.724±0.028 0.730±0070 0.952 Total Hip, g/cm2 1.083±0.050 0.696±0.030 0.022 0.761±0.011 0.892±0.101 0.417
IV. DISCUSSION
I identified DEGs between postmenopausal osteoporosis patients and controls with normal BMD using RNA-seq data from human MSCs. Accurate NGS technology was utilized to perform RNA-seq. With the identified DEGs, the common pathways related to osteoporosis and adipogenesis were evaluated using IPA. The
NR4A family may represent common genes between osteoporosis and adipogenesis.
MSCs may be the best resource for research on the relationship between bone and fat because they are the common origins of osteoblasts and adipocytes.6 With these MSCs, RNA-seq was performed to identify DEGs between osteoporosis patients and controls using the reliable NGS technology13-15,22. The DEGs between postmenopausal osteoporosis patients and controls were rigorously identified by applying a false discovery rate of q <0.05 and log2 FC >2 or <-2. In all, 53 DEGs were identified. Well-known genes related to osteoporosis such as Runt-related transcription factor 2 (Runx2), Low-density lipoprotein receptor-related protein 5 (LRP5), and SOST23 were not different between the osteoporosis and normal
subjects, suggesting that it occurs at a later stage in the osteoblast lineage than that reflected by the MSCs.24 However, pathway analysis revealed that the DEGs were
closely related to the differentiation of cells, particularly for connective tissue cells, suggesting that the genetic changes in MSCs related to the differentiation of these cells could affect the pathogenesis of osteoporosis. Interestingly, enriched function annotation from IPA analyses of DEG sets revealed that the differentiation of adipocytes was also related to the identified DEGs (NR4A1, NR4A2, and NR4A3).
The RNA-seq data showed that the NR4A family was upregulated in osteoporosis patients. According to the baseline characteristics of the subjects, there were no significant differences in the weight and BMI between osteoporosis and controls; rather, the weight and BMI seemed to be lower in osteoporosis patients. Therefore, it was not possible that the obesity of the osteoporosis group affected the upregulation of the NR4A family. Hence, it could be inferred that the genetic preference of MSCs for adipogenesis might affect the pathogenesis of osteoporosis. In fact, bone and fat cells share a common origin (i.e., MSCs), and their fates are inter-related in both the physiologic and pathologic states.6
The NR4A subfamily of orphan nuclear receptors is made up of NR4A1/NUR77/NBFIB, NR4A2/NURR1, and NR4A3/NOR1.25The NR4As are early responders to stimuli such as ß-adrenergic signaling, insulin, growth factors, glucose, lipopolysaccharide, lipids, glucagon, inflammation, and various forms of cellular stress.25-27 These transcription factors are also involved in various functions
such as cell cycle regulation, apoptosis, steroidogenesis, adipogenesis, and energy metabolism.25-26,28 Moreover, there is strong upregulation of NR4As in cases of
extreme obesity, and these levels normalize after fat loss.25 This suggests the potential relationship between the NR4A family and obesity. The NR4A family is also induced by parathyroid hormone in bone.29-31 In an in-vitro study, there was
cross-talk betweenthe ß-catenin signaling pathway and NR4A orphan nuclear
receptorsin osteoblasts. NR4A receptors repressed ß-catenin-mediatedtransactivation,
the possible relationship between the NR4A family and bone metabolism. My IPAs also revealed a possible relationship between NR4A1 and corticotropin-releasing hormone (CRH) signaling. NR4A2 is related not only to the adipogenesis pathway but also to glucocorticoid receptor signaling through TNF. Glucocorticoids markedly enhance marrow adipogenesis at the expense of osteoblast differentiation.10 Therefore, the NR4A family might represent commonly related genes for bone and fat metabolism via CRH signaling. NR4A1 and NR4A2 enhance transcriptional activity of the CRH and proopiomelanocortin (POMC) promoters, while also being upregulated by CRH treatment in pituitary cells, thereby mediating expression of hypothalamic and pituitary stress hormones33-34. In fact, RT-PCR indicated increased
expression of the NR4A family in other osteoporosis and obese subjects compared to controls, although the number of subjects for the validation was small and the results were not completely consistent. However, the osteoporosis patients used for RNA-seq were not obese according to their BMIs, and the adipogenesis pathway was upregulated in these subjects. Increased marrow adipogenesis could be suggested as a reason. Although the amount of marrow fat for the subjects was not measured in this study, an inverse association between marrow adipose tissue and measures of bone density and strength in adults has been reported.35Aging is associated with a
significant increase in marrow adiposity.36Excess marrow fat has been implicated in the pathogenesis of bone fragility in premenopausal women with idiopathic osteoporosis12 and anorexianervosa.36In this study, I also compared the expression of the NR4A family between the MSCs of ovariectomized and sham-operated mice using RT-PCR to investigate if these candidate genes could be commonly related to
the postmenopausal model. NR4A1 and NR4A3 were significantly upregulated in the MSCs of ovariectomized mice. Both in vitro and in vivo studies have shown that various conditions that promote bone marrow adipogenesis, particularly estrogen withdrawal, limit osteoblastogenesis.37The absence of estrogen receptor- activation
accelerates the development of marrow adipocytes in ovariectomized animals.36The upregulated NR4A family might affect the pathogenesis of osteoporosis by increased marrow adipogenesis rather than systemic obesity.
This study had some limitations. First, the sample size of four subjects for each group may appear to be small. However, Itried to recruit the subjects of each group with prominent differences in medical characteristics to identify definite DEGs. I recruited controls with normal BMD without any medical history that would have affected bone metabolism. Moreover, the osteoporosis subjects were also carefully selected. Subjects with a definite medical history of osteoporotic fracture were recruited in this study, not only those with low BMD (T-score ≤ -2.5). Despite the small sample number, I identified distinct transcriptional changes in osteoporosis between two different groups with a reliable medical history. In addition, due to the polygenic architecture of osteoporosis, the osteoporosis trait arises in each individual from the combined effects of a large number of genetic variants.38-39 In most cases,
there is sufficient statistical power to identify some of these genetic variants even with a small sample size.39Second, I only analyzed the transcriptional differences
related to the molecular genetic mechanism in osteoporosis. While individual omics studies (genome/transcriptome/epigenome/proteome) are useful for identifying molecular genetic mechanisms, defects at any level (DNA, mRNA, epigenes, and
proteins) may or may not translate into the next level(s), ultimately impacting disease risk. Moreover, epigenetic factors (epigenes) and their interactions (such as those between DNA methylation and miRNA) modulated by the environment affect gene expression into mRNAs/proteins and mRNA stability.39 Further multi-omics studies
are needed to verify the identified DEGs in the molecular genetic mechanism in osteoporosis.
However, this study identified DEGs related to osteoporosis with the MSCs of reliable study subjects using NGS. Using MSCs as the common origin of osteoblasts and adipocytes, I searched for a common pathway related to adipogenesis and osteoporosis via IPA. Interestingly, the NR4A family was found as a possible candidate gene for the common pathway. I also validated these genes with other MSC samples from independent subjects. To the best of my knowledge, these procedures have not been attempted to investigate a common mechanism related to osteoporosis and adipogenesis. In this regard, this study has strengths. Moreover, these procedures using MSCs might be applicable to research for common mechanisms related to osteoporosis and sarcopenia or sarcopenia and obesity.
V. CONCLUSION
This study identified DEGs between postmenopausal osteoporosis patients and controls with normal BMD using RNA-seq data from human MSCs. Most DEGs were related to the differentiation of cells. The common pathways related to osteoporosis and adipogenesis were evaluated with the identified DEGs using IPA. The expression of NR4A gene family wassignificantly higher in MSCsof patients withosteoporosis and obesity than in MSCsof controls. The NR4A family might comprise common genes related to osteoporosis and adipogenesis. Further studies are needed to understand the actual role and significance of the NR4A family for the common relation with osteoporosis and adipogenesis.
REFERENCES
1. Rachner TD, Khosla S, Hofbauer LC. Osteoporosis: now and the future.
Lancet. 2011; 377: 1276-1287.
2. Langdahl BL. New treatments of osteoporosis. Osteoporos and
Sarcopenia.2015; 1: 4-21.
3. O'Connor KM. Evaluation and Treatment of Osteoporosis. Med Clin North
Am. 2016; 100: 807-826.
4. Bonjour J, Chevalley T. Pubertal Timing, Peak Bone Mass and Fragility Fracture Risk. BoneKey-Osteovision. 2007; 4: 30–48.
5. Deng FY, Lei SF, Zhang Y, Zhang YL, Zheng YP, Zhang LS, et al. Peripheral blood monocyte-expressed ANXA2 gene is involved in pathogenesis of osteoporosis in humans. Mol Cell Proteomics. 2011; 10: M111.011700.
6. Rosen CJ, Klibanski A. Bone, fat, and body composition: evolving concepts in the pathogenesis of osteoporosis. Am J Med. 2009; 122: 409-414.
7. Benisch P, Schilling T, Klein-Hitpass L, Frey SP, Seefried L, Raaijmakers N, et al. The transcriptional profile of mesenchymal stem cell populations in primary osteoporosis is distinct and shows overexpression of osteogenic inhibitors. PLoS One. 2012; 7: e45142.
8. Valtieri M, Sorrentino A. The mesenchymal stromal cell contribution to homeostasis. J Cell Physiol. 2008; 217: 296–300.
9. Rosen CJ. Bone remodeling, energy metabolism, and the molecular clock.
Cell Metab 2008; 7: 7-10.
10. Mazziotti G, Giustina A, Canalis E, Bilezikian JP. Glucocorticoid-induced osteoporosis: clinical and therapeutic aspects. Arq Bras Endocrinol Metabol. 2007; 51: 1404-1412.
11. Lecka-Czernik B, Gubrij I, Moerman EJ, Kajkenova O, Lipschitz DA, Manolagas SC, et al. Inhibition of Osf2/Cbfa1 expression and terminal osteoblast differentiation by PPARgamma2. J Cell Biochem. 1999; 74: 357-371.
12. Cohen A, Dempster DW, Stein EM, Nickolas TL, Zhou H, McMahon DJ, Müller R, Kohler T, Zwahlen A, Lappe JM, Young P, Recker RR, Shane E. Increased marrow adiposity in premenopausal women with idiopathic osteoporosis.J Clin Endocrinol Metab. 2012;97:2782-2791.
13. Ozsolak, F, Milos PM. RNA sequencing: advances, challenges and opportunities. Nature Rev Genet. 2011; 2: 1287–1298.
14. Wang Z, Gerstein M, Snyder M. RNA-seq: a evolutionary tool for transcriptomics. Nature Rev Genet. 2009; 10: 57–63.
15. Marioni JC, Mason CE, Mane SM, Stephens M, Gilad Y. RNA-seq: an assessment of technical reproducibility and comparison with gene expression arrays. Genome Res. 2008; 18: 1509–1517.
16. Schousboe JT, Shepherd JA, Bilezikian JP, Baim S. Executive summary of the 2013 International Society for Clinical Densitometry Position
Development Conference on bone densitometry. J Clin Densitom. 2013;16:455-466.
17. Oh SW, Shin SA, Yun YH, Yoo T, Huh BY. Cut-off point of BMI and obesity-related comorbidities and mortality in middle-aged Koreans. Obes
Res. 2004;12:2031-2040.
18. Angelopoulou M, Novelli E, Grove JE, Rinder HM, Civin C, Cheng L, et al. Cotransplantation of human mesenchymal stem cells enhances human myelopoiesis and megakaryocytopoiesis in NOD/SCID mice. Exp Hematol 2003; 31: 413-420.
19. Trapnell C, Roberts A, Goff L. Pertea G, Kim D, Kelley DR, et al.
Differential gene and transcript expression analysis of RNA-seq experiments with TopHat and Cufflinks. Nature Protocols. 2012; 7:562-578.
20. Anders S, Pyl PT, Huber W. HTSeq-a Python framework to work with high-throughput sequencing data. Bioinformatics 2015; 31: 166-169.
21. Robinson MD, McCarthy DJ, Smyth GK. edgeR: a Bioconductor package for differential expression analysis of digital gene expression data.
Bioinformatics. 2010; 26: 139-140.
22. Martin JA, Wang Z. Next-generation transcriptome assembly. Nat Rev Genet. 2011; 12: 671-682.
23. Li WF, Hou SX, Yu B, Li MM, Férec C, Chen JM. Genetics of osteoporosis: accelerating pace in gene identification and validation. Hum Genet. 2010; 127: 249–285.
24. Roforth MM, Farr JN, Fujita K, McCready LK, Atkinson EJ, Therneau TM, et al. Global transcriptional profiling using RNA sequencing and DNA methylation patterns in highly enriched mesenchymal cells from young versus elderly women. Bone. 2015; 76: 49-57.
25. Veum VL, Dankel SN, Gjerde J, Nielsen HJ, Solsvik MH, Haugen C, et al. The nuclear receptors NUR77, NURR1 and NOR1 in obesity and during fat loss. Int J Obes (Lond). 2012; 36: 1195-1202.
26. Pearen MA, Muscat GEO. Minireview: nuclear hormone receptor 4A signaling: implications for metabolic disease. Mol Endocrinol. 2010; 24: 1891-1903.
27. Maxwell MA, Muscat GE. The NR4A subgroup: immediate early response genes with pleiotropic physiological roles. Nucl Recept Signal. 2006; 4: e002.
28. Zhao Y, Bruemmer D. NR4A orphan nuclear receptors: transcriptional regulators of gene expression in metabolism and vascular biology.
Arterioscler Thromb Vasc Biol. 2010; 30: 1535-1541.
29. Tetradis S, Bezouglaia O, Tsingotjidou A. Parathyroid hormone induces expression of the nuclear orphan receptor Nurr1 in bone cells. Endocrinology. 2001; 142: 663-670.
30. Tetradis S, Bezouglaia O, Tsingotjidou A, Vila A. Regulation of the nuclear orphan receptor Nur77 in bone by parathyroid hormone. Biochem Biophys
Res Commun. 2001; 281: 913-916.
31. Pirih FQ, Nervina JM, Pham L, Aghaloo T, Tetradis S. Parathyroid hormone induces the nuclear orphan receptor NOR-1 in osteoblasts. Biochem Biophys
Res Commun. 2003; 306: 144-150.
32. Rajalin AM, Aarnisalo P. Cross-talk between NR4A orphan nuclear receptors and β-catenin signaling pathway in osteoblasts. Arch Biochem
Biophys. 2011;509:44-51.
33. Kovalovsky D, Refojo D, Liberman AC, Hochbaum D, Pereda MP, Coso OA, et al. Activation and induction of NUR77/NURR1 in corticotrophs by CRH/cAMP: involvement of calcium, protein kinase A, and MAPK pathways. Mol Endocrinol. 2002;16:1638–1651.
34. Murphy EP, Conneely OM. Neuroendocrine regulation of the hypothalamic pituitary adrenal axis by the nurr1/nur77 subfamily of nuclear receptors. Mol
Endocrinol. 1997;11:39–47.
35. Fazeli PK, Horowitz MC, MacDougald OA, Scheller EL, Rodeheffer MS, Rosen CJ, et al. Marrow fat and bone--new perspectives. J Clin Endocrinol
36. Bredella MA, Fazeli PK, Miller KK, Misra M, Torriani M, ThomasBJ, Ghomi RH, Rosen CJ, KlibanskiA. Increased bone marrowfat in anorexia nervosa. J Clin Endocrinol Metab. 2009; 94:2129–2136.
37. Hardouin P, Rharass T, Lucas S. Bone Marrow Adipose Tissue: To Be or Not To Be a Typical Adipose Tissue? Front Endocrinol (Lausanne). 2016; 7: 85.
38. Plomin R, Haworth CM, Davis OS. Common disorders are quantitative traits.
Nat Rev Genet. 2009; 10: 872-878.
39. Zhang JG, Tan LJ, Xu C, He H, Tian Q, Zhou Y, et al. Integrative Analysis of Transcriptomic and Epigenomic Data to Reveal Regulation Patterns for BMD Variation. PLoS One. 2015; 10: e013852
- 국문요약 -
전사체 분석을 통한 인간 중간엽줄기세포에서의 골다공증 관련
유전자 및 지방세포 분화와의 관련성
유전적요인은 골다공증 발생에 있어 주요한 원인이다. 조골세포와 지방세포는 공통적으로 중간엽줄기세포로부터 분화하며 중간엽줄기세포로 부터 어느 방향으로 분화하는지가 골다공증과 지방세포분화와의 연관성에 있어 중요할 수 있다. 본 연구에서는 골다공증 환자와 정상 골밀도를 보 이는 대조군의 인간 중간엽줄기세포를 이용하여 두 군간의 차별 유전자를 알아보고 이 유전자들과 골다공증과 지방세포분화와 연관된 공통 경로를 밝혀보고자 하였다. 인간 중간엽줄기세포는 대퇴골 정형외과 수술 중에 채취된 골수로부터 분리하였다. 전사체 분석은 차세대 염기서열 분석 (next-generation sequencing (NGS)) 기술을 이용하였으며, 이 분석을 통하여 얻어진 데이터를 통하여 차별유전자를 발굴하였다. Ingenuity pathway analysis (IPA)를 이용하여 골다공증과 지방세포 분화와 연관된 공통 경로를 알아보았다. 이 공통 경로와 연관이 있는 후보유전자를독립 된 골다공증 및 비만 환자에서 역전사 중합효소 연쇄반응법을 통하여 검 증하였다. 전사체 분석을 통하여 총 53개의 골다공증 환자와 대조군간 차 별 유전자를 발굴하였다. 대부분의 차별 유전자는 세포 분화와 연관된 유 전자였다. The nuclear receptor subfamily 4 group A (NR4A) 군 유전 자들이 골다공증과 지방세포 분화의 공통 경로에 관련성이 있는 후보유전자로 발굴되었다. 독립된 골다공증 환자와 대조군에서 NR4A1의 발현량 에 유의한 차이를 보였으며 (p=0.018), 마찬가지로 독립된 비만 환자와 대조군에서 NR4A2 발현량에 유의한차이를 보였다 (p=0.041). 본 연구 를 통하여 골다공증과 연관이 될 수 있는 53개의 차별 유전자를 인간 중 간엽줄기세포에서 알아보았으며, 이 중에서 NR4A 군의 유전자가 골다공 증과 지방세포 분화에 공통적으로 연관되어 있을 가능성을 확인하였다. 주제어: 골다공증, 비만, 중간엽줄기세포, 전사체