Graphene Liquid Cell Electron Microscopy of Initial Lithiation in
Co
3
O
4
Nanoparticles
Joon Ha Chang,
†,§Jun Young Cheong,
†,§Sung Joo Kim,
†,∥Yoon-Su Shim,
†Jae Yeol Park,
†Hyeon Kook Seo,
†,⊥Kyun Seong Dae,
†Chan-Woo Lee,
‡Il-Doo Kim,
*
,†and Jong Min Yuk
*
,††Department of Materials Science and Engineering, Korea Advanced Institute of Science and Technology, 335 Science Road,
Daejeon 34141, Republic of Korea
‡Platform Technology Laboratory, Korea Institute of Energy Research, 152 Gajeong-Ro, Yuseong-Gu, Daejeon 34129, Republic of
Korea
*
S Supporting InformationABSTRACT: As it governs the overall performance of lithium-ion batteries, understanding the reaction pathway of lithiation is highly desired.
For Co3O4 nanoparticles as anode material, here, we report an initial
conversion reaction pathway during lithiation. Using graphene liquid cell electron microscopy (GLC-EM), we reveal a CoO phase of the initial
conversion product as well as morphological dynamics during Co3O4
lithiation. In accordance with the in situ TEM observation, we confirmed
that the Co3O4 to CoO conversion is a thermodynamically favorable
process by calculating the theoretical average voltage based on density functional theory. Our observation will provide a useful insight into the oxide electrode that undergoes conversion reaction.
1. INTRODUCTION
Whereas lithium (Li)-ion batteries have been widely used in various applications such as laptops, electric vehicles, and so
forth,1−3high-capacity anode materials are desired for light and
portable devices.4,5Cobalt (II,III) oxide (Co3O4) is one of the
promising materials because of its superior theoretical capacity
(1100 mA h g−1).6−11It is known that the Co3O4anode has
severe volume aggregation at high C-rates12 and undergoes
either of two different lithiation pathways.13 One pathway
involves the Li-intercalation process followed by full
conversion to Co and Li2O
x
Co O3 4 + Li→Li Co Ox 3 4
x
Li Co Ox 3 4+(8 − )Li→3Co+4Li O2
The other is the reaction pathway through the CoO phase,
followed by full conversion to Co and Li2O
Co O3 4 +2Li→Li O2 +3CoO 3CoO+Li O2 + 6Li→4Li O2 +3Co
Although the pathway accompanying the Li-intercalation
process has been frequently studied,14−16 the conversion
process of Co3O4to CoO is still ambiguous because of a lack
of direct observation.
Here, we realize the direct observation on the initial
conversion of Co3O4 to CoO upon lithiation by using
graphene liquid cell electron microscopy (GLC-EM), which has been used to acquire high-resolution imaging in a liquid
electrolyte solution.17−19 Furthermore, density functional
theory (DFT) calculation is adopted to calculate the relative
voltage profile, and the calculations confirm that the Co3O4to
CoO conversion follows a thermodynamic pathway.
2. RESULTS AND DISCUSSION
Co3O4 nanoparticles are prepared by ball-milling for 12 h.
Figure 1a shows a bright-field transmission electron
micros-copy (BF−TEM) image of Co3O4nanoparticles andFigure 1b
shows the corresponding selected area electron diffraction
(SAED) pattern. The diameters of particles are 10−40 nm,
which well correspond to the calculated average crystal
Received: January 21, 2019
Accepted: April 3, 2019
Published: April 15, 2019
Figure 1.(a) BF−TEM image (inset: particle size distribution graph) and (b) SAED pattern of Co3O4nanoparticles.
Article http://pubs.acs.org/journal/acsodf Cite This:ACS Omega 2019, 4, 6784−6788
This is an open access article published under an ACS AuthorChoice License, which permits copying and redistribution of the article or any adaptations for non-commercial purposes.
Downloaded via KOREA ADVANCED INST SCI AND TECHLGY on December 2, 2019 at 01:35:32 (UTC).
diameter of 24.6 nm from an X-ray diffraction (XRD) pattern (Figure S1) according to Scherrereq 1
K / cos( )
τ= λ β θ (1)
In order to investigate the morphological dynamics during
the initial conversion reaction, in situ GLC−TEM is
conducted. The GLC is prepared by encapsulating liquid
electrolyte with Co3O4 nanoparticles between two graphene
sheets. The liquid electrolyte is 1.3 M of (LiPF6) dissolved in a
solvent mixture consisting of 3:7 volumetric ratio of ethylene carbonate/diethylene carbonate (EC/DEC) and 10 wt % of fluoroethylene carbonate (FEC), which was used in our
previous studies.17−19 Chemical lithiation is initiated by the
decomposition of LiPF6to Li by dissolution of electrons and
radicals under electron beam irradiation.17−19 The schematic
diagram of the fabricated GLC is shown inFigure S2a. A
high-angle annular dark-field scanning transmission electron
microscopy (HAADF−STEM) image and the corresponding
energy-dispersive spectroscopy (EDS) mapping of C, O, F, P,
and Co are shown inFigure S2bto observe the morphology
and element distribution. Co3O4 nanoparticles are observed
inside the graphene sheets and liquid electrolyte, and all of the chemical components of the electrolyte (C, O, F, P) are shown
in all parts of the HAADF−STEM image, but Co is selectively
present at the place where Co3O4nanoparticles locate.
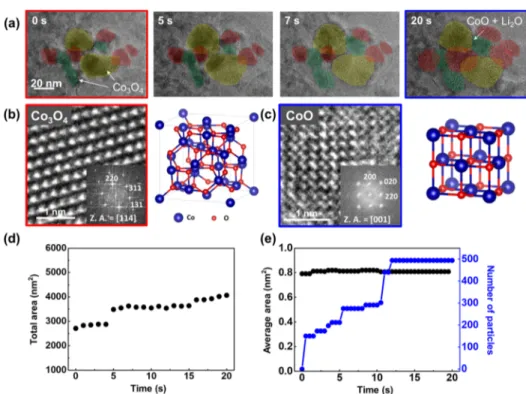
Using the GLC, a direct visualization on the initial
conversion reaction of Co3O4 to CoO is realized. The
time-sequential TEM images in Figure 2a show the lithiation
process of individual Co3O4nanoparticles. The conversion of
Co3O4to CoO happens particle by particle (yellow to green to
red). Ultrasmall nanocrystals are generated and embedded within the amorphous matrix and their morphology is similar
to the lithiated Co3O4 particles in a previously reported
work.20 Figure 2b,c shows high-resolution transmission
electron microscopy (HRTEM) images and corresponding
crystal schematics, which confirm pre- and post-lithiated crystal
structures. During lithiation, clearly the phase transition from
Co3O4to CoO occurred. The total area change versus time is
shown in Figure 2d. As lithiation and volume expansion
happen particle by particle, volume expansion occurs step by step. The formed CoO nanocrystals and their total number is
shown inFigure 2e. The number of nanocrystals also increases
step by step, which has a similar trend to the total volume increase. The average size of the nanocrystals remains constant, where stable morphology and phase are maintained during TEM observation because of a small amount of liquid inside the GLC, which is not enough to fully lithiate the particles.
In addition, this crystal structure change is also identified
with SAED patterns (Figure 3a,b). In accordance with
HRTEM images, the phase transition from Co3O4to CoO is
observed in the GLC. In Figure 3c,d, electron energy loss
spectroscopy (EELS) of the Co-L2,3edge is shown before and
after lithiation. The average ratios of L3/L2 are measured as
2.39 and 4.51, which corresponds to the value of Co3O4(1/3
Co2+ and 2/3 Co3+) and CoO (Co2+) reported in previous
literature.20,21
To further delve into the theoretical aspects of the
conversion reaction of Co3O4to CoO, the average voltage V
of electrode is determined using the following equation, based
on Nernsteq 2
V E E xE
xe
(charge) (discharge) (Li)
= − − −
(2) where E(charge) and E(discharge) are the DFT energies of the charged and discharged phases, respectively. E(Li), x, and e are the DFT energy per atom of bulk Li, the number of the Li atoms, and elementary charge, respectively.
Here, two different reaction pathways are considered and
plotted inFigure 4: (i) the conversion of Co3O4into CoO and
(ii) the intercalation of Li into Co3O4(LiCo3O4). In the case
of thefirst pathway, the formation of CoO takes place at 2.08
V, and Co forms subsequently at 1.81 V. On the other hand, Figure 2. (a) Time-series TEM images of Co3O4 nanoparticles under lithiation. (b) HRTEM image and crystal structure of Co3O4 (before lithiation) and (c) CoO (after lithiation). (d) Total area of the particles with time. (e) Average size and number of CoO nanocrystals with time.
the intercalation of Li into Co3O4 takes place at 1.89 V, followed by conversion to Co at 1.86 V. According to the Nernst equation, the high voltage value indicates low Gibbs-free energy changes in the reaction pathway, which corresponds to thermodynamically favorable reaction. On the basis of these results, the conversion to CoO is a favorable
process with respect to Li intercalation into Co3O4. As
lithiation in the GLC is chemical lithiation,17−19it follows the
thermodynamic reaction pathway and transition from Co3O4
to CoO takes place, which corresponds with our GLC results.
To prove that the reaction in GLC−TEM actually occurs in
the real electrochemical battery cell experiment, ex situ
experiments are conducted.Figure S3ashows the galvanostatic
charge−discharge profile of the first cycle and Figure S3b−d
shows the SAED patterns at each voltage level. At 1.2 V, the phase transition of CoO is found and at the end of the discharge, both CoO and Co phases are present. Ex situ EELS is also obtained to analyze the electronic structure of lithiated Co3O4(Figure S4). The positions and ratios of the L3and L2 peaks well match with the EELS spectrum from the in situ experiment. Additional electrochemical information such as
cyclic voltammetry (CV), electrochemical impedance
measure-ment, and galvanostatic charge−discharge tests for subsequent
cycles are provided in the previous study.22The CV analysis
clearly matches with the reaction pathway seen in this report, where two cathodic peaks are present at 0.75 and 0.6 V,
attributed to the reduction of Co3O4to CoO and subsequently
CoO to Co.
3. CONCLUSIONS
In conclusion, during the initial lithiation stage, we
demonstrate that Co3O4 nanoparticles change into CoO
phases rather than intercalation phases using GLC−TEM.
The DFT calculation further demonstrates that the conversion
of Co3O4to CoO follows a thermodynamic pathway, where
chemical lithiation triggered in the GLC is a thermodynami-cally favorable process. As the lithiation pathway considerably
affects the reaction kinetics, cycle retention characteristics, and
rate capabilities,23−25 our study will provide an insight into
designing anode materials of spinel oxide with multiple oxidation states.
4. EXPERIMENTAL SECTION
4.1. Materials and Fabrication of the GLC. Co3O4
nanoparticles were purchased from Sigma-Aldrich. For the fabrication of the GLC, the multilayer graphene was initially synthesized. Using Cu foil (99.8%, Alfa Aesar) as the substrate, graphene was synthesized by using chemical vapor deposition (CVD). Then, the Cu foil was etched with 20% phosphoric
acid (H3PO4, 85%, Junsei) for 20 min for removing impurities
and oxides. As for the conditions of CVD, the temperature was
set to 1050°C for 30 min and stabilized for 60 min under 200
standard cubic centimeters per minute (sccm) of hydrogen
(H2) gas. Subsequently, 20 sccm of methane (CH4) gas, which
acted as the carbon source, was injected for 25 min and was later cooled to room temperature at a rapid rate. Such a synthesized multilayer graphene was transferred to a holey
carbon Au TEM grid (quantifoil, 300 mesh, hole size = 2μm).
Ammonium persulfate (0.2 M, (NH4)2S2O8, Sigma-Aldrich)
was used to etch the Cu foil for 6 h. Then, it was washed with
water to remove the (NH4)2S2O8. The GLC was prepared by
dropping 20 μL of the electrolyte mixture containing Co3O4
nanoparticles, lithium hexafluorophosphate (LiPF6), and EC/
DEC (v/v = 3:7) with 10 wt % of FEC on one graphene-transferred grid and placing another graphene-graphene-transferred grid
on the top.26 Liquid cells were formed during spontaneous
drying by graphene sheets by the van der Waals force. 4.2. In Situ TEM Observation. To carry out the in situ
TEM observation, a Titan ETEM G2 microscope (FEI) was
used at an operating voltage of 300 kV. The range of the
electron beam dosage was between 800 and 1000 e−/Å2s. The
dynamics in the process of lithiation upon e-beam irradiation were recorded in a charge-coupled device camera (Gatan Ultrascan 1000). Furthermore, EDS elemental mapping was obtained using JEOL JEM 2100F under a 200 kV accelerating voltage. EELS analysis was conducted using GIF Quantum 966
in a Titan ETEM G2microscope (FEI).
4.3. Other Characterizations. The crystal structures of
Co3O4were confirmed by an X-ray diffractometer (XRD, D/
MAX-2500, Rigaku) using Cu Kα radiation (λ = 1.54 Å). Ex
situ TEM images and SAED patterns of Co3O4nanoparticles
were taken using JEOL JEM 2100F under a 200 kV accelerating voltage.
Figure 3.(a) SAED pattern before and (b) after the in situ TEM experiment. (c) EELS spectrum of the Co-L2,3 edge before and (d) after lithiation (inset: ratio between the L3and L2peaks).
Figure 4.DFT-based voltage profile of the Li−Co3O4system in the case of conversion of Co3O4to CoO (red) and intercalation of Li into Co3O4(LiCo3O4, blue).
4.4. Particle Analysis. To measure the average size and area of the particles, the following methods were used. First, time-series images were extracted from the movie at 0.5 s intervals. Second, the edge of the CoO nanocrystals were
drawn to sharpen the boundaries. Finally, using “Analyze
Particles” plugins in ImageJ software, the number and area of
nanocrystals were calculated.
4.5. Computational Details. DFT calculations are
performed using the Vienna Ab initio Simulation Package27
within the projector-augmented wave scheme as formulated by
Perdew−Burke−Ernzerhof28 with spin-polarization. A cutoff
energy of 520 eV is adopted for the plane-wave expansion of wave functions and k-point grids of 1000/n are used with the
Monkhorst−Pack method for LiCo3O4 and the γ-centered
method for all others, where n is the number of atoms in the
supercell. A Hubbard U term of 3.32 eV is chosen for Co2+and
Co3+ based on previous literature.14,29−32
The DFT energies
are converged within 1.0× 10⁻⁶eV. All structures in our study
are based on those from the Materials Project33which are fully
relaxed using the aforementioned settings.
4.6. Ex Situ Electrochemical Test. The electrochemical cell testing was conducted in a manner similar to the previously
reported literature.22 Briefly, the electrochemical cells were
fabricated in the Ar-filled glove box, with a 2032-type coin cell.
To start with, the slurry was made in a mortar, with Co3O4
nanoparticles, binder, and carbon black, in a weight ratio of 8:1:1. The binder consisted of carboxymethyl cellulose and polyacrylic acid, in a weight ratio of 1:1. The slurry was casted
onto the Cu foil, dried at 60°C for 10 min, and dried inside
the vacuum oven at 150°C for 2 h to completely remove the
solvent. The average amount of loaded active materials was 1.5
mg cm−2. The electrochemical cell was assembled with a
counter electrode (Li foil), a separator (Celgard 2325), a slurry-casted electrode, a spacer, a spring, and an electrolyte.
The electrolyte consisted of 1.3 M lithium hexa
fluorophos-phate (LiPF6) in organic solvent of EC/DEC with 10 wt % of
FEC. The CV was conducted with a scan rate of 0.1 mV s−1in
the voltage range of 0.01−3.0 V. After the specific
electro-chemical cell test, the electroelectro-chemical cells were transferred to the antechamber of the glove box, the cells were disassembled, and the electrode was washed with dimethyl carbonate prior to analysis.
■
ASSOCIATED CONTENT*
S Supporting InformationThe Supporting Information is available free of charge on the ACS Publications website at DOI: 10.1021/acsome-ga.9b00185.
XRD pattern of pristine Co3O4nanoparticles; schematic
diagram and EDS mapping of the GLC; galvanostatic
charge−discharge profile and corresponding SAED
patterns of the 1st cycle; ex situ EELS spectrum of Co
(PDF)
Real-time TEM movie showing the lithiation of Co3O4
nanoparticles in the GLC (MP4)
■
AUTHOR INFORMATIONCorresponding Authors
*E-mail:idkim@kaist.ac.kr(I.-D.K.).
*E-mail:jongmin.yuk@kaist.ac.kr (J.M.Y.).
ORCID
Joon Ha Chang:0000-0001-8877-9917
Sung Joo Kim:0000-0001-9776-1532
Il-Doo Kim:0000-0002-9970-2218
Jong Min Yuk:0000-0002-4677-7363
Present Addresses
∥S.J.K. is currently with the Department of Materials science
and Engineering, Seoul National University, Seoul 08826, Republic of Korea.
⊥H.K.S. is currently with the Memory Analysis Science and
Engineering group, Samsung Electronics, Hwaseong 18488, Republic of Korea.
Author Contributions
§J.H.C. and J.Y.C. contributed equally to this work.
Notes
The authors declare no competingfinancial interest.
■
ACKNOWLEDGMENTSThis work was supported by the National Research Foundation of Korea (NRF), grant no. 2014R1A4A1003712 (BRL Program), the Korea CCS R&D Center (KCRC) grant funded by the Korea government (Ministry of Science, ICT & Future Planning) (no. NRF-2014M1A8A1049303), End-Run grant from KAIST funded by the Korea government in 2016 (Ministry of Science, ICT & Future Planning) (N11160058), Wearable Platform Materials Technology Center (WMC) (NR-2016R1A5A1009926), NRF Grant funded by the Korean Government (NRF-2017H1A2A1042006-Global Ph.D. Fel-lowship Program, NRF-2018H1A2A1060105-Global Ph.D. Fellowship Program), Young Researcher Program (NRF-2018R1C1B6002624), Nano-Material Fundamental Technol-ogy Development (NRF-2018M3A7B4065625), Nano Materi-al Technology Development Program through the NRF funded by the Ministry of Science, ICT and Future Planning (2009-0082580).
■
REFERENCES(1) Tarascon, J.-M.; Armand, M. Issues and Challenges Facing Rechargeable Lithium Batteries. Nature 2001, 414, 359−367.
(2) Megahed, S.; Scrosati, B. Lithium-Ion Rechargeable Batteries. J. Power Sources 1994, 51, 79−104.
(3) Scrosati, B.; Garche, J. Lithium Batteries: Status, Prospects and Future. J. Power Sources 2010, 195, 2419−2430.
(4) Xue, X.-Y.; Yuan, S.; Xing, L.-L.; Chen, Z.-H.; He, B.; Chen, Y.-J. Porous Co3O4Nanoneedle Arrays Growing Directly on Copper Foils and Their Ultrafast Charging/Discharging as Lithium-Ion Battery Anodes. Chem. Commun. 2011, 47, 4718−4720.
(5) Bruce, P. G.; Freunberger, S. A.; Hardwick, L. J.; Tarascon, J.-M. Li−O2 and Li−S Batteries with High Energy Storage. Nat. Mater. 2011, 11, 19.
(6) Sultana, I.; Rahman, M. M.; Ramireddy, T.; Sharma, N.; Poddar, D.; Khalid, A.; Zhang, H.; Chen, Y.; Glushenkov, A. M. Under-standing Structure−Function Relationship in Hybrid Co3O4−Fe2O3/ C Lithium-Ion Battery Electrodes. ACS Appl. Mater. Interfaces 2015, 7, 20736−20744.
(7) Li, H.-H.; Li, Z.-Y.; Wu, X.-L.; Zhang, L.-L.; Fan, C.-Y.; Wang, H.-F.; Li, X.-Y.; Wang, K.; Sun, H.-Z.; Zhang, J.-P. Shale-like Co3O4 for High Performance Lithium/Sodium Ion Batteries. J. Mater. Chem. A 2016, 4, 8242−8248.
(8) Chen, S.; Zhao, Y.; Sun, B.; Ao, Z.; Xie, X.; Wei, Y.; Wang, G. Microwave-Assisted Synthesis of Mesoporous Co3O4Nanoflakes for Applications in Lithium Ion Batteries and Oxygen Evolution Reactions. ACS Appl. Mater. Interfaces 2015, 7, 3306−3313.
(9) Li, Y.; Tan, B.; Wu, Y. Mesoporous Co3O4Nanowire Arrays for Lithium Ion Batteries with High Capacity and Rate Capability. Nano Lett. 2008, 8, 265−270.
(10) Wang, H.; Mao, N.; Shi, J.; Wang, Q.; Yu, W.; Wang, X. Cobalt Oxide-Carbon Nanosheet Nanoarchitecture as an Anode for High-Performance Lithium-Ion Battery. ACS Appl. Mater. Interfaces 2015, 7, 2882−2890.
(11) Wu, Y.; Meng, J.; Li, Q.; Niu, C.; Wang, X.; Yang, W.; Li, W.; Mai, L. Interface-modulated fabrication of hierarchical yolk−shell Co3O4/C dodecahedrons as stable anodes for lithium and sodium storage. Nano Res. 2017, 10, 2364−2376.
(12) Cheng, X.; Li, Y.; Shi, H.; Lu, J.; Zhang, Y. Rate-dependent electrochemical reaction mechanism of spinel metal oxide anode studied by in situ TEM. J. Alloys Compd. 2018, 763, 349−354.
(13) Larcher, D.; Sudant, G.; Leriche, B.; Chabre, Y.; Tarascon, J.-M. The Electrochemical Reduction of Co3O4 in a Lithium Cell. J. Electrochem. Soc. 2002, 149, A234.
(14) Li, Q.; Wu, J.; Yao, Z.; Xu, Y.; Thackeray, M. M.; Wolverton, C.; Dravid, V. P. Dynamic Imaging of Metastable Reaction Pathways in Lithiated Cobalt Oxide Electrodes. Nano Energy 2018, 44, 15−22. (15) Li, J.; He, K.; Meng, Q.; Li, X.; Zhu, Y.; Hwang, S.; Sun, K.; Gan, H.; Zhu, Y.; Mo, Y.; et al. Kinetic Phase Evolution of Spinel Cobalt Oxide During Lithiation. ACS Nano 2016, 10, 9577−9585.
(16) Luo, L.; Wu, J.; Xu, J.; Dravid, V. P. Atomic Resolution Study of Reversible Conversion Reaction in Metal Oxide Electrodes for Lithium-Ion Battery. ACS Nano 2014, 8, 11560−11566.
(17) Cheong, J. Y.; Chang, J. H.; Seo, H. K.; Yuk, J. M.; Shin, J. W.; Lee, J. Y.; Kim, I.-D. Growth Dynamics of Solid Electrolyte Interphase Layer on SnO2Nanotubes Realized by Graphene Liquid Cell Electron Microscopy. Nano Energy 2016, 25, 154−160.
(18) Chang, J. H.; Cheong, J. Y.; Yuk, J. M.; Kim, C.; Kim, S. J.; Seo, H. K.; Kim, I.-D.; Lee, J. Y. Direct Realization of Complete Conversion and Agglomeration Dynamics of SnO2 nanoparticles in Liquid Electrolyte. ACS Omega 2017, 2, 6329−6336.
(19) Cheong, J. Y.; Chang, J. H.; Kim, S. J.; Kim, C.; Seo, H. K.; Shin, J. W.; Yuk, J. M.; Lee, J. Y.; Kim, I.-D. In Situ High-Resolution Transmission Electron Microscopy (TEM) Observation of Sn Nanoparticles on SnO2 Nanotubes Under Lithiation. Microsc. Microanal. 2017, 23, 1107−1115.
(20) Su, Q.; Zhang, J.; Wu, Y.; Du, G. Revealing the Electrochemical Conversion Mechanism of Porous Co3O4Nanoplates in Lithium Ion Battery by in Situ Transmission Electron Microscopy. Nano Energy 2014, 9, 264−272.
(21) Zhao, Y.; Feltes, T. E.; Regalbuto, J. R.; Meyer, R. J.; Klie, R. F. In Situ Electron Energy Loss Spectroscopy Study of Metallic Co and Co Oxides. J. Appl. Phys. 2010, 108, 063704.
(22) Cheong, J. Y.; Chang, J. H.; Cho, S.-H.; Jung, J.-W.; Kim, C.; Dae, K. S.; Yuk, J. M.; Kim, I.-D. High-rate formation cycle of Co3O4 nanoparticles for superior electrochemical performance in lithium-ion batteries. Electrochim. Acta 2019, 295, 7−13.
(23) Shang, T.; Wen, Y.; Xiao, D.; Gu, L.; Hu, Y.-S.; Li, H. Atomic-Scale Monitoring of Electrode Materials in Lithium-Ion Batteries Using In Situ Transmission Electron Microscopy. Adv. Energy Mater. 2017, 7, 1700709.
(24) Huang, Q.; Yang, Z.; Mao, J. Mechanisms of the Decrease in Low-Temperature Electrochemical Performance of Li4Ti5O12-Based Anode Materials. Sci. Rep. 2017, 7, 15292.
(25) Kim, S. J.; Chang, D.; Zhang, K.; Graham, G.; Van der Ven, A.; Pan, X. Accordion Strain Accommodation Mechanism within the Epitaxially Constrained Electrode. ACS Energy Lett. 2018, 3, 1848− 1853.
(26) Chang, J. H.; Cheong, J. Y.; Seo, H. K.; Kim, I.-D.; Yuk, J. M. Preparation of Graphene Liquid Cells for the Observation of Lithium-ion Battery Material. J. Vis. Exp. 2019, No. e58676.
(27) Kresse, G.; Furthmüller, J. Efficient iterative schemes for ab initio total-energy calculations using a plane-wave basis set. Phys. Rev. B: Condens. Matter Mater. Phys. 1996, 54, 11169.
(28) Perdew, J. P.; Burke, K.; Ernzerhof, M. Generalized Gradient Approximation Made Simple. Phys. Rev. Lett. 1996, 77, 3865−3868.
(29) Wang, L.; Maxisch, T.; Ceder, G. Oxidation energies of transition metal oxides within the GGA+U framework. Phys. Rev. B: Condens. Matter Mater. Phys. 2006, 73, 195107.
(30) Montoya, A.; Haynes, B. S. Periodic density functional study of Co3O4surfaces. Chem. Phys. Lett. 2011, 502, 63−68.
(31) Jain, A.; Hautier, G.; Ong, S. P.; Moore, C. J.; Fischer, C. C.; Persson, K. A.; Ceder, G. Formation enthalpies by mixing GGA and GGA + U calculations. Phys. Rev. B: Condens. Matter Mater. Phys. 2011, 84, 045115.
(32) Yu, X.-Y.; Meng, Q.-Q.; Luo, T.; Jia, Y.; Sun, B.; Li, Q.-X.; Liu, J.-H.; Huang, X.-J. Facet-dependent electrochemical properties of Co3O4nanocrystals toward heavy metal ions. Sci. Rep. 2013, 3, 2886. (33) Jain, A.; Ong, S. P.; Hautier, G.; Chen, W.; Richards, W. D.; Dacek, S.; Cholia, S.; Gunter, D.; Skinner, D.; Ceder, G.; Persson, K. A. Commentary: The Materials Project: A materials genome approach to accelerating materials innovation. APL Mater. 2013, 1, 011002.