Cultural values and cross-cultural video
consumption on YouTube
Minsu Park1☯, Jaram Park2☯, Young Min Baek3
*, Michael Macy1,4
*
1 Department of Information Science, Cornell University, Ithaca, New York, United States of America, 2 Graduate School of Culture Technology, KAIST, Daejeon, Republic of Korea, 3 Department of
Communication, Yonsei University, Seoul, Republic of Korea, 4 Department of Sociology, Cornell University, Ithaca, New York, United States of America
☯These authors contributed equally to this work.
*ymbaek@yonsei.ac.kr(YMB);mwm14@cornell.edu(MM)
Abstract
Video-sharing social media like YouTube provide access to diverse cultural products from all over the world, making it possible to test theories that the Web facilitates global cultural convergence. Drawing on a daily listing of YouTube’s most popular videos across 58 coun-tries, we investigate the consumption of popular videos in countries that differ in cultural val-ues, language, gross domestic product, and Internet penetration rate. Although online social media facilitate global access to cultural products, we find this technological capability does not result in universal cultural convergence. Instead, consumption of popular videos in cul-turally different countries appears to be constrained by cultural values. Cross-cultural con-vergence is more advanced in cosmopolitan countries with cultural values that favor individualism and power inequality.
Introduction
The recent upsurge of nationalist movements opposing open borders and free trade brings new urgency to questions about the effects of social media on cultural convergence. Video-sharing social media like YouTube provide access to diverse cultural products from all over the world [1]. Unlike traditional media such as television, CDs, or books [2], content on social media (e.g., video clips and music videos) is readily accessible across countries that differ in national GDP [3,4], geographic location [3,5], language [6], and religion [5].
Nevertheless, the ability to easily obtain social media content does not mean consumers take advantage of the opportunity. Although technologies increasingly facilitate cross-border flow of media content, previous studies support the “cultural proximity hypothesis” that con-sumption reflects cultural values that in turn shape cultural norms about socially acceptable content, such that consumers prefer products closer to their own culture [4,7,8,9]. However, these studies focused on consumption of tangible cultural products like books and CDs [7], not content on social media that can be easily downloaded from the Web. Hyperlinks on web pages [4,8] were also studied extensively, but hyperlinks are generated by producers of online content who vie for the attention of the public and hyperlinks themselves do not reveal con-sumption patterns of online content.
a1111111111 a1111111111 a1111111111 a1111111111 a1111111111 OPEN ACCESS
Citation: Park M, Park J, Baek YM, Macy M (2017) Cultural values and cross-cultural video consumption on YouTube. PLoS ONE 12(5): e0177865.https://doi.org/10.1371/journal. pone.0177865
Editor: Tobias Preis, University of Warwick, UNITED KINGDOM
Received: December 14, 2016 Accepted: May 4, 2017 Published: May 22, 2017
Copyright:© 2017 Park et al. This is an open access article distributed under the terms of the
Creative Commons Attribution License, which permits unrestricted use, distribution, and reproduction in any medium, provided the original author and source are credited.
Data Availability Statement: All data used to generate the results in the paper have been uploaded to Open Science Framework and are available athttps://osf.io/mznwp/.
Funding: We acknowledge funding from the National Research Foundation of Korea (NRF-2016S1A3A2925033), the US National Science Foundation (NSF SES1303533, SES1226483), and the Minerva Initiative (FA9550-15-1-0162). Competing interests: The authors have declared that no competing interests exist.
An important exception is a study [1] showing that Korean pop (or K-pop) music videos on YouTube are highly popular in countries whose cultures differ sharply from Korea as well as in countries that are culturally very similar to Korea. However, it remains to be seen whether this finding generalizes beyond one type of media content produced in only one country.
Using co-consumption of popular videos on YouTube, this study extends research on the cultural proximity hypothesis by examining the relationship between cultural values and cul-tural openness. Drawing on a daily listing of YouTube’s most popular videos across 58 coun-tries, we investigate the consumption of popular videos in countries that differ in cultural values [10], language, gross domestic product (GDP), and Internet penetration rate.
We chose YouTube because it is the most popular platform for media consumption on the Web, with more than one billion viewers every day, watching hundreds of millions of hours of content [11,12]. Video over Internet Protocol is forecast to represent 82 percent of all down-load traffic by 2020 [13]. Our research addresses why some YouTube videos (e.g., Gangnam Style) are globally consumed while others are limited to a single country, despite the existence of a technological infrastructure for global cross-cultural communication. To find out, we recorded the 50 most popular videos listed by YouTube for the past day for each of 74 coun-tries over six months. “Popularity” is based on YouTube’s undisclosed algorithm [3,14] that takes into account views, downloads, and likes. Inclusion on YouTube’s top 50 list provides an unranked measure of video consumption.
Cultural values
“Culture” has been defined as a set of values maintained across generations through the sociali-zation process [10,15]. Although individual attitudes and beliefs may be in constant flux, cul-tural values are thought to be stable attributes of societies [16]. Cultural values are defined as enduring beliefs that “a specific mode of conduct or end-state of existence is personally or socially preferable” (p.5) [9]. These cultural values influence user decisions about what to view, download, or like, which suggests that YouTube video consumption can be expected to vary across cultures [17,18].
We operationalized cultural values using Hofstede’s four-dimensional model [10], based on aggregated survey responses from IBM employees in 76 countries. Hofstede’s approach has been criticized by culture scholars who argue that culture is too subtle to quantify, especially in multi-cultural countries like the United States [19,20]. Nevertheless, Hofstede’s measures have been widely applied in prominent studies showing how cultural values influence cross-cultural communication behaviors such as media selection and adoption [1,21], political discussion engagement [22], and use of emoticons on Twitter [23].
The four dimensions in Hofstede’s model areindividualism (IDV), uncertainty avoidance (UAI), power distance (PDI), and masculinity (MAS). Each of these dimensions has
implica-tions for cross-cultural media consumption that we operationalize in turn below.
Individualism-collectivism (IDV)
Countries with high IDV are more inclined to emphasize “I” rather than “we” and to privilege individual interests over collective welfare (p.130) [10]. Individualistic cultures do not demand conformity around shared opinions, beliefs, or attitudes and are therefore more likely to embrace cultural diversity and to show “respect for other cultures” (p.99) [10]. Hofstede’s argument has been supported by studies [16] showing that people in individualistic cultures tend to be more tolerant of diversity and appreciative of cultural differences. Other studies have found that people in high IDV countries consume more cross-national products [24], adopt global platforms like B2C e-commerce [25] and SNS [21], and purchase newly launched
brands [26]. Using a large international hyperlink network, Barnett and Sung [4] found that high IDV countries occupied more central positions in the international information-sharing network. We hypothesize that this pattern will extend to cross-cultural video consumption on YouTube:
H1: People in individualistic countries will be more likely to consume videos that are popular in culturally different countries, compared to those in collectivistic countries.
Uncertainty avoidance index (UAI)
People in high UAI countries are more likely to “feel threatened by ambiguous or unknown situations” (p.191) [10]. For example, opinion surveys have found that people in European countries with high UAI scored higher in aggressive nationalism, ethnocentrism, and xeno-phobia, including beliefs that immigrants should be sent back to their countries of origin [27]. People living in high UAI countries are reluctant to purchase newly launched products or adopt technological innovations, including the Internet [28], mobile phones [29], SNS [30], and B2C e-commerce [25]. This attitude may extend to consumption of foreign videos: H2: Countries with high uncertainty avoidance will be less likely to consume videos that are
popular in culturally different countries, compared to those in low uncertainty avoidance countries.
Power distance index (PDI)
People in high PDI countries are more likely to “expect and accept that power is distributed unequally” (p.61) [10] in groups or organizations. Because Hofstede’s measure is based on sur-vey responses of employees, PDI applies most directly to the relationship between bosses and subordinates in organizations [10]. Thus, few studies have examined how PDI influences cross-cultural behavior. However, PDI has implications for beliefs about status inequality that imply cultural preferences for products that signal cultural superiority and it has been demon-strated that people in cultures with high PDI tend to consume products that help them estab-lish and express their status [31]. Bourdieu’s classic study [32] shows how cultural products are used to construct and define social class hierarchies. People with high status are believed to have more cultural sophistication, including more extensive and detailed knowledge about for-eign cultures. Forfor-eign products provide symbolic benefits such as modernity, prestige, and associations with foreign lifestyles [33] in a similar manner that products with recognized, exclusive, and relatively expensive brand names tend to have higher levels of social status attached to them compared to more generic and less exclusive brands [26]. In high PDI coun-tries, these symbolic benefits constitute a primary motivation for foreign product consumption [33]. This suggests the possibility that people in high PDI countries (including elites as well as those with elite pretensions) are more likely to regard xenophilia as a signal for cultural sophis-tication [26,31]. More formally, we expect:
H3: People in high PDI countries will be more likely to consume videos that are popular in cul-turally different countries than those in low PDI countries.
Masculinity (MAS)
People in high MAS countries are more likely to conform to gender role stereotypes that “men are supposed to be assertive, tough, and focused on material success, whereas women are
supposed to be more modest, tender, and concerned with quality of life” (p.140) [10]. Even more than with PDI, MAS does not have straightforward implications for cross-cultural media consumption. On the one hand, it might be argued that masculinity encourages cultural bold-ness, which implies a greater likelihood to consume unfamiliar cultural content. On the other, traditional gender roles may be associated with parochial cultural tendencies, which implies the opposite association. Moreover, these opposing effects may cancel each other out. We therefore do not hypothesize an association in either direction but instead test to see if high and low MAS countries differ in video consumption.
Materials and methods
YouTube data collection
YouTube only provides aggregate country-level measures of popularity and we therefore do not have individual user-level data. For each country, YouTube lists daily the “most popular” videos, accessible through the YouTube Application Programming Interface (API). We col-lected the 50 most popular videos for each of 74 countries over 6 months from November 15th 2014 to April 5th 2015 (approximately 40,700 observations per day) [34] for a total of 4,979,077 observations and 561,931 unique videos. Each observation contains the date, cate-gory, title, tags, video duration, average view duration, comments, and popularity metrics, including the number of views, likes, dislikes, and shares for that day.
Bipartite co-consumption network
We used the pairwise co-listings of popular videos to construct a bipartite projected network of countries. We first built a bipartite network as proposed by [3,6] with two types of nodes: (1) 74 countries, each with a list of popular videos collected from YouTube and (2) 561,931 videos on those countries’ popular video lists. In the projection of this bipartite network, each country was regarded as a node and an edge was assigned if a pair of countries shared one or more videos on their popular video lists. As it happens, all countries were connected, that is, all had at least one overlapping video with another country. Following the method suggested by Newman [35], an edge weighting was applied that privileges videos that appear less frequently across all 74 lists. Thus, a pair of countries that co-lists a set of videos that are universally popu-lar has relatively low weight compared to a pair of countries that has in common a set of videos that appear on no other lists. This weighting method mitigates the effect of overly popular out-liers (potentially due to an artificial increase of viewers) on the co-consumption patterns. This edge weighting combines two components: (1) the number of videos co-listed by a pair of countries and (2) the global popularity (or out-degree) of each video in the co-list, defined as the number of countries in which the video was listed. The weighting metric was formalized as follows: Wij¼ X k dkidkj nk 1
whereWijis the weight of the edge between countriesi and j; k is a unique YouTube video in
the set of videos co-listed byi and j; nkis the number of countries that listedk; and dki is 1 if
videok is co-listed on popular video lists including country i and 0 otherwise.
Fig 1Aillustrates the co-consumption pattern on a stylized bipartite network, and 1B shows how the edge weight is computed between a pair of countries, the US and Germany. The first video is popular only in the U.S. and Germany, giving it a weight of 1. The weight of the last video is 1/4 because it appears on the most popular lists of five different countries (including
the U.S. and Germany). We then derive the edge weight as the sum the weights over all the co-listed videos. Thus, the edge weight reflects the number of co-co-listed videos weighted by the inverse of the video out-degree (the number of countries that list that video). InFig 1, the edge weight between the U.S. and Germany is 7/4. Using this weighting method, we computed edge weights between all possible pairs of countries.
The outcome of the final step is shown inFig 1C, in which the edge weights are filtered to preserve only those edges that deviate from the expected weight in a null model iteratively pro-duced by a random assignment from a uniform distribution. By imposing a significance level ofp < 0.05, the links whose weights exceed a randomly expected value are preserved. The
remaining links constitute the “backbone” structure of the network [36].
Measure of cultural openness
We refer to “cultural openness” as the conceptual outcome of interest. A country with high cultural openness can achieve an “optimal blend of novelty and familiarity” by creating cul-tural bridges [37]. At the same time, a country with high cultural openness can co-consume cultural products with many other countries across different cultural clusters such that they are close to most other countries in the network, which can be perceived as “openness to diver-sity.” Instead of using a single measure that combines these aspects, we operationalize cultural openness as having two distinct dimensions. Betweenness centrality was used as an indicator of bridging between cultures, measured as video overlap with other countries that do not over-lap with one another. Closeness centrality, measured as a country’s level of video overover-lap with all other countries, provides an indicator of cultural diversity.
We measured cultural betweenness and closeness using Opsahl et al.’s [38] centrality mea-sures in weighted networks to take both the number of ties and the tie weights into account. Those weighted centrality measures are variants of Djikstra’s algorithm, a well-known method for finding and computing the shortest paths among nodes in a network. Using this approach, the shortest pathd between two nodes (i, j) can be defined as follows:
dwaði; jÞ ¼ minð 1 ðwihÞ aþ . . . þ 1 ðwhjÞ aÞ
wherew is the weight of the tie between nodes; h are intermediary nodes on paths between Fig 1. Construction of the bipartite network of video co-consumption on YouTube.
nodei and j; and α is a tuning parameter that reflects the influence of edge weights. When α =
0, Opsahl’s algorithm reduces to the familiar binary measure in which a network edge either exists or does not (i.e., the level of similarity or affiliation between countries can not be cap-tured at all because tie weights are ignored). Whenα = 1, the algorithm is identical to Dijkstra’s (i.e., the original feature of the measures, particularly the number of ties, is ignored because tie weights are the sole determinant). A value forα < 1 assigns the path with the greatest number of intermediary nodes the longest distance whereas the impact of additional intermediary nodes is relatively unimportant compared to the strength of the ties whenα > 1. Hence, for α
< 1, a shorter path composed of weak ties is favored over a longer path with strong ties.
Con-versely, forα > 1, paths with more intermediaries connected by strong ties are favored. The tuning parameter is used to operationalize the extent to which openness reflects a more bal-anced weight distribution in a node’s local network along with its degree. We setα = 0.5, although results are fairly robust across other values of the tuning parameter smaller than or equal to 1. Formally, cultural betweenness is given by:
Cwa B ðiÞ ¼ gwa jkðiÞ gwa jk
whereg is the sum of shortest paths that pass through node i as a proportion of all shortest
paths in the network. Cultural closeness, as the inverse sum of shortest distances to all other nodes from a focal node, is given by:
Cwa CðiÞ ¼ XN j¼1 dwaði; jÞ " # 1
We limited the analysis to the 58 countries for which we had Hofstede scores. The list of countries included and excluded in the analysis is provided inS1 Table. Descriptive statistics of the four scores on the 58 countries are: (1) individualism (M = 41.00, SD = 23.13), (2)
uncer-tainty avoidance (M = 66.72, SD = 22.81), (3) power distance (M = 61.95, SD = 21.59), and (4)
masculinity (M = 49.55, SD = 17.01).
Economic, linguistic, and technological measures
To disentangle cultural influence from other factors that have been found to affect cultural openness, we included economic, linguistic, and technological measures. Per capita GDP has been shown to be strongly associated with cross-cultural communication on Twitter [39] and in international transactions and communication flows [4,40]. Previous research also shows strong correlations between GDP per capita and Hofstede’s cultural values [10,41]. In short, GDP per capita is associated with both cultural openness and cultural values. We used the GDP per capita data archived by the World Bank in 2013 [42]. Since the average GDP per cap-ita across 58 countries showed a right-skewed distribution, the base 10 log-transformed GDP per capita (M = 4.06, SD = .56, Median = 4.17) was used in the analysis.
Language is an obvious barrier to any global communication [7,8] and social media interac-tion in particular [6,43]. As a consequence, English as alingua franca allows greater access to
cultural diversity [6,8], compared to local languages such as Korean or Japanese. Following Ronen et al.’s [6] algorithm, we computed eigenvector centrality of a country’s language. The average eigenvector centrality of language across 58 countries isM = 0.18 (SD = .32, Median =
.025). The higher the centrality, the lower the linguistic barriers to global communication. Internet penetration is strongly correlated with Hofstede’s cultural values [28] and also lim-its access to online cultural content. We used the World Bank measure of Internet penetration
as the number of Internet users per 100 people [42]. The distribution of Internet penetration is normally distributed (M = 64.90, SD = 21.67, Median = 69.48, ranging from 12.30 to 95.05)
and thus does not require log transformation.
Results
Table 1reports descriptive statistics for the video co-consumption networks across different categories that were automatically classified by YouTube. Each network is based on the edge weights derived from the co-listing of videos in a particular category. The number of nodes is not identical across categories because of data sparsity. Countries were deleted for which there were too few videos listed in that category to obtain statistically significant links in the “back-bone” network.
These network characteristics reveal interesting differences across video categories. For example, the co-consumption news network has low average path length (APL) but high aver-age degree, indicating that news videos were more likely to be consumed among a broader global audience than other types of videos. In contrast, the co-consumption music network has fewer nodes and edges and has low average degree and high APL, which indicates that a country’s video list contained less globally popular music and more locally popular music as described in [44]. Interestingly, the gaming network has high modularity and many connected components (CCs), indicating more clustered video preferences.
Although these patterns invite category-specific analyses, the theoretical motivation for this study is focused on differences between countries, not differences between cultural categories. We therefore report results for the combined network based on all videos, regardless of gory. However, we also checked the robustness of the overall pattern by examining each cate-gory-specific network and found no important differences.
The relationships between cultural values and cultural openness
Tables2and3report results for regression analyses of cultural openness, operationalized as cultural betweenness and closeness. The cultural model consists of Hofstede’s four cultural val-ues and the non-cultural model includes economic, linguistic, and technological measures. The combined model reports the effects of cultural values net of non-cultural.
We tested both models for heteroscedasticity and multicollinearity. For cultural closeness, we could not reject the null hypothesis that the variance of the residuals is constant, i.e.
Table 1. Descriptive statistics of network structure by video category.
Category Nodes Edges Degree Weighted Degree Modularity CC APL
Combined 72 195 5.417 324.864 0.736 2 3.067 News 73 263 7.205 628.543 0.667 2 2.887 Music 68 159 4.676 145.903 0.410 3 3.332 Games 72 168 4.667 574.939 0.767 5 3.812 Sports 70 173 4.943 391.373 0.695 3 4.406 Entertainment 72 217 6.028 461.752 0.675 4 3.036 Film 73 205 5.616 401.584 0.637 1 3.480 People 73 257 7.041 469.417 0.624 1 2.917 Tech 68 179 5.265 293.704 0.619 2 3.383 Comedy 72 179 4.972 324.729 0.619 2 3.232 Travel 72 228 6.333 300.295 0.598 2 2.857
Note: CC = Connected Components; APL = Average Path Length
heteroscedasticity is not present, using the test of non-constant variance score. For the model of cultural betweenness, in contrast, we inferred that the residuals are heteroscedastic. How-ever, as described earlier, results are robust across different tuning parameters and a model constructed with a composite measure of betweenness and closeness [45,46] inS1 Textalso shows qualitatively similar results to cultural betweenness and closeness models. The variance inflation factor on each variable of the full model is smaller than two except for GDP per capita (2.41) and Internet diffusion (2.49) that are strongly correlated with each other but neither contributes significantly to model predictions.
As shown in Tables2and3, a country’s cultural openness is much better explained by cul-tural values (adjustedR2= .208 for cultural betweenness; adjustedR2= .411 for cultural close-ness) than non-cultural measures (adjustedR2= .061 for cultural betweenness; adjustedR2= .244 for cultural closeness). Indeed, non-cultural measures do not make a significant contribu-tion to the full models’ explanatory power, and removing these measures even improves the adjustedR2(.191) of the model on cultural betweenness.
The coefficients in Tables2and3provide more detailed results. The eigenvector centrality of language [6] indicates that countries using more global languages (e.g., English) have greater cultural openness, consistent with the findings in previous studies (b = .173, p < .05 for
cul-tural betweenness;b = .190, p < .01 for cultural closeness) [7,8]. However, this effect largely disappears when cultural values are included in the model (b = .092, p = .29 for cultural
be-tweenness;b = .075, p = .18 for cultural closeness), indicating that cultural values are stronger
predictors of cultural openness and capture most of the linguistic effect.
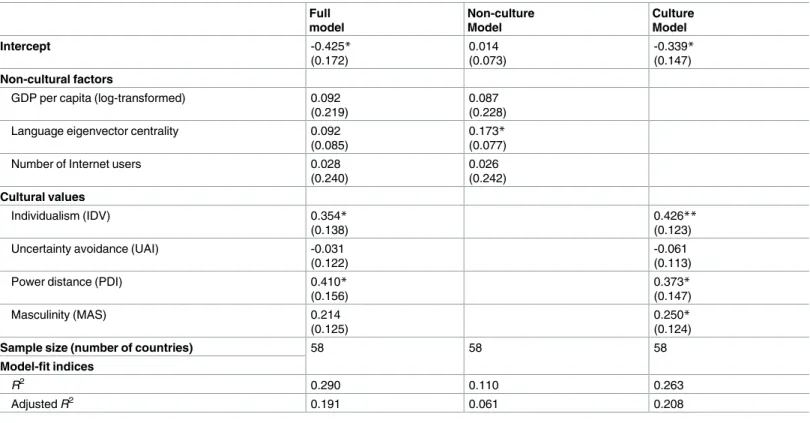
Table 2. OLS regression model of cultural betweenness among 58 countries. Full model Non-culture Model Culture Model Intercept -0.425* (0.172) 0.014 (0.073) -0.339* (0.147) Non-cultural factors
GDP per capita (log-transformed) 0.092 (0.219)
0.087 (0.228) Language eigenvector centrality 0.092
(0.085)
0.173* (0.077)
Number of Internet users 0.028
(0.240) 0.026 (0.242) Cultural values Individualism (IDV) 0.354* (0.138) 0.426** (0.123)
Uncertainty avoidance (UAI) -0.031
(0.122)
-0.061 (0.113)
Power distance (PDI) 0.410*
(0.156) 0.373* (0.147) Masculinity (MAS) 0.214 (0.125) 0.250* (0.124)
Sample size (number of countries) 58 58 58
Model-fit indices
R2 0.290 0.110 0.263
Adjusted R2 0.191 0.061 0.208
Note *p<.05
**p<.01. Unstandardized coefficients are reported with standard errors in parentheses. In order to compare coefficients, variables included in the analyses were rescaled to the unit interval.
The results inTable 2(cultural betweenness) support H1 and H3 but not H2. As hypothe-sized, YouTube users consume more videos in common with other countries that do not over-lap with one another if those users are located in countries that are more individualistic (b =
.354,p < .05) and with greater power distance (b = .410, p < .05). However, a country’s
cul-tural openness is not predicted by uncertainty avoidance (b = -.031, p = .80) or masculinity
(b = .214, p = .12). In short, individualism and acceptance of power inequality are associated
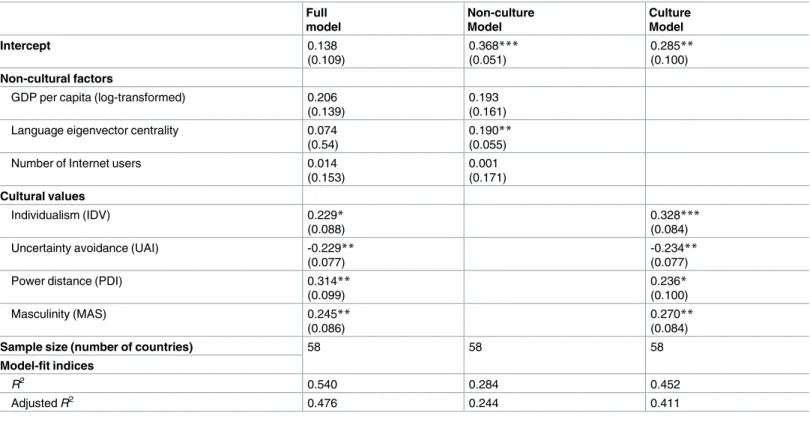
with an optimal blend of novelty and familiarity, as indicated by greater cultural betweenness. Results inTable 3(cultural closeness) support H1, H2, and H3. YouTube users consume more videos in common with a larger number of culturally diverse countries (i.e., higher cul-tural closeness) if those users are located in countries that are more individualistic (b = .229, p < .05), with less uncertainty avoidance (b = −.229, p < .01), greater power distance (b = .314, p < .01), and higher conformity to gender role stereotypes (b = .245, p < .01). In short, cultural
closeness is associated with more cultural values than is cultural betweenness, and both are more important than the non-cultural factors that have been the focus of previous research.
Discussion
Our findings are consistent with the view that cross-cultural convergence, especially cultural closeness, is more advanced in cosmopolitan countries with cultural values that favor individu-alism, power inequality, and tolerance for uncertainty. Online social media facilitate global
Table 3. OLS regression model of cultural closeness among 58 countries. Full model Non-culture Model Culture Model Intercept 0.138 (0.109) 0.368*** (0.051) 0.285** (0.100) Non-cultural factors
GDP per capita (log-transformed) 0.206 (0.139)
0.193 (0.161) Language eigenvector centrality 0.074
(0.54)
0.190** (0.055)
Number of Internet users 0.014
(0.153) 0.001 (0.171) Cultural values Individualism (IDV) 0.229* (0.088) 0.328*** (0.084)
Uncertainty avoidance (UAI) -0.229**
(0.077)
-0.234** (0.077)
Power distance (PDI) 0.314**
(0.099) 0.236* (0.100) Masculinity (MAS) 0.245** (0.086) 0.270** (0.084)
Sample size (number of countries) 58 58 58
Model-fit indices R2 0.540 0.284 0.452 Adjusted R2 0.476 0.244 0.411 Note *p<.05 **p<.01
***p<.001. Unstandardized coefficients are reported with standard errors in parentheses. In order to compare coefficients, variables included in the analyses were rescaled to the unit interval.
access to cultural products, yet this technological capability does not result in cultural conver-gence [5,6,47]. Instead, consumption of popular videos in culturally different countries appears to be constrained by cultural values.
These findings contrast with studies showing that shared language, common economic sys-tem, and geographical proximity are associated with cross-cultural consumption of tangible products [2,7] and flows of information [4,5,8]. The difference with previous results may reflect fewer linguistic, economic, and geographic constraints on video consumption, as well as less need for active interaction with people of different cultures compared to exchanges of e-mail or Tweets, making it easier and more comfortable for YouTube users to encounter and enjoy videos from diverse cultures.
Our findings have implications for the recent upsurge of nationalist movements opposing open borders and free trade. On the one hand, “contact theory” [48] and “soft power” research [49] suggest the possibility that cross-cultural exposure could promote cultural innovation and mutual understanding. On the other hand, cultural openness may erode a country’s unique cultural identity, leading to a nationalist backlash.
Additionally, this study has substantial implications for the distinction between cultural betweenness and closeness in cross-cultural experience. Bail [37] highlighted the implications of cultural betweenness as an indicator of cultural bridges–network positions that can “achieve an optimal blend of novelty and familiarity.” However, cultural closeness has not received the-oretical attention or empirical inquiry. Our findings show that cultural closeness can be an indicator of multicultural identity: countries with low closeness (e.g., Kenya) have a narrow range of video preferences that forms a cultural niche, possibly associated with national iden-tity. In contrast, countries with high closeness (e.g., Canada) have a wide range of video prefer-ences that spans cultural niches and might be associated with a multicultural national identity.
An important limitation of this study is that the units of analysis are countries, not individ-ual users. This poses the possibility that the results we report are susceptible to the ecological fallacy. For example, in some cases, we found that there are significant overlaps in popular video consumption between countries of migration destination and origin. It is possible that individual members of each immigrant group have parochial cultural preferences, but because the groups differ in their preferences, the country appears to be culturally open. We therefore tested for the spurious effects of migration and found significant correlations between cultural openness and a country’s degree in the international migration network, where edges corre-spond to migrations from the country of origin to the country of destination, derived from 2015 UN migration stock data (r = 0.33, p < .05 for cultural betweenness; r = 0.44, p < .001 for
cultural closeness; models including this migration degree as an additional independent vari-able show identical results with original models, but individualism is no longer significant; more details are provided inS2 Text). Individual user data is needed so that this possibility might be tested more fully in future research. Future research with individual data might also explore possible associations between cultural openness and the incidence of cultural “omni-vores” in the population [50].
Conclusion
Our study makes two important contributions. First, we found that cultural values are signifi-cantly associated with the cultural openness of a country, as measured by the consumption of YouTube videos that are popular across diverse cultures. Moreover, this association with cul-tural values appears to account for effects that previous research has attributed to non-culcul-tural factors. Second, we provide a new angle from which to view the cultural proximity hypothesis in the era of social media on the globalized Web.
Supporting information
S1 Table. Country names included and excluded for analyses.
(PDF)
S1 Text. OLS regression analysis using a composite measure of cultural openness.
(PDF)
S2 Text. OLS regression analyses including a country’s degree in the international migra-tion network as a control variable.
(PDF)
Acknowledgments
The authors are grateful to Drew Margolin and Meeyoung Cha for helpful feedback.
Author Contributions
Conceptualization: MP JP MM. Data curation: MP JP.
Formal analysis: MP JP YMB. Funding acquisition: YMB MM. Investigation: MP JP.
Methodology: MP JP YMB MM. Writing – original draft: MP JP.
Writing – review & editing: MP JP YMB MM.
References
1. Baek YM. Relationship Between Cultural Distance and Cross-Cultural Music Video Consumption on YouTube. Soc Sci Comput Rev. 2014; 33(6):730–48.
2. Burnett R. The global jukebox: The international music industry. London and New York: Psychology Press; 1996. 192 p.
3. Platt EL, Bhargava R, Zuckerman E. The International Affiliation Network of YouTube Trends. Proc Int AAAI Conf Web Soc Media. Association for the Advancement of Artificial Intelligence; 2015;
4. Barnett G a, Sung E. Culture and the Structure of the International Hyperlink Network. J Comput Com-mun. 2005; 11(1):217–38.
5. State B, Park P, Weber I, Macy M. The mesh of civilizations in the global network of digital communica-tion. PLoS One. 2015; 10(5).
6. Ronen S, Gonc¸alves B, Hu KZ, Vespignani A, Pinker S, Hidalgo C a. Links that speak: The global lan-guage network and its association with global fame. Proc Natl Acad Sci. 2014; 111(52):201410931.
7. Straubhaar JD. Beyond media imperialism: Asymmetrical interdependence and cultural proximity. Crit Stud Mass Commun. 1991; 8(1):39–59.
8. Taneja H, Webster JG. How Do Global Audiences Take Shape? The Role of Institutions and Culture in Patterns of Web Use. J Commun. 2016; 66(1):161–82.
9. Rokeach M. The Nature of Human Values. New York Free Press. 1973. 438 p.
10. Hofstede G, Hofstede GJ, Minkov M. Cultures and organizations: software of the mind: international cooperation and its importance for survival. Publish. 2010.
11. YouTube. Statistics [Internet]. 2015 [cited 2016 Sep 19]. Available from:https://www.youtube.com/yt/ press/en-GB/statistics.html
12. Park M, Naaman M, Berger J. A Data-driven Study of View Duration on YouTube. In: Proceedings of the International AAAI Conference on Web and Social Media (ICWSM). 2016.
13. Cisco. Global IP Traffic Forecast [Internet]. 2016 [cited 2016 Sep 19]. Available from:http://www.cisco. com/c/en/us/solutions/service-provider/visual-networking-index-vni/index.html
14. Gillespie T. The relevance of algorithms. Media Technol Essays Commun Mater Soc. 2012;(Light 1999):167–94.
15. Gudykunst WB, Nishida T. The influence of culture and strength of cultural identity on individual values in Japan and the United States. Intercult Commun Stud. IAICS; 1999; 2000; 9(1):1–18.
16. Berry JW. Cross-cultural psychology: Research and applications. Cambridge University Press; 2002.
17. Gudykunst WB, Matsumoto Y, Ting-Toomey S, Nishida T, Kim K, Heyman S. The influence of cultural individualism-collectivism, self construals, and individual values on communication styles across cul-tures. Hum Commun Res. Wiley Online Library; 1996; 22(4):510–43.
18. Feather NT. Bridging the gap between values and actions: Recent applications of the expectancy-value model. Guilford Press; 1990;
19. Baskerville RF. Hofstede never studied culture. Accounting, Organizations and Society. 2003. p. 1–14.
20. Geertz C. The Interpretation of Cultures. Contemporary Sociology. 1996. 299 p.
21. Choi J, Jung J, Lee SW. What causes users to switch from a local to a global social network site? the cultural, social, economic, and motivational factors of Facebook’s globalization. Comput Human Behav. 2013; 29(6):2665–73.
22. Eveland WP, Song H, Beck PA. Cultural Variations in the Relationships among Network Political Agree-ment, Political Discussion Frequency, and Voting Turnout. International Journal of Public Opinion Research. 2015. p. 461–80.
23. Park J, Baek YM, Cha M. Cross-Cultural Comparison of Nonverbal Cues in Emoticons on Twitter: EVI-DENCE from Big Data Analysis. J Commun. 2014; 64(2):333–54.
24. Dwyer S, Mesak H, Hsu M. An Exploratory Examination of the Influence of National Culture on Cross-National Product Diffusion. J Int Mark. 2005; 13(2):1–27.
25. Gong W. National culture and global diffusion of business-to-consumer e-commerce. Cross Cult Manag An Int J. 2009; 16(1):83–101.
26. Mooij M De, Hofstede G. Cross-Cultural Consumer Behavior: A Review of Research Findings. J Int Consum Mark. 2011; 23(June):181–92.
27. Leong CH, Ward C. Cultural values and attitudes toward immigrants and multiculturalism: The case of the Eurobarometer survey on racism and xenophobia. Int J Intercult Relations. 2006; 30(6):799–810.
28. Maitland CF, Bauer JM. National level culture and global diffusion: The case of the Internet. Cult Tech-nol Commun Towar an Intercult Glob village. State University of New York Press Albany, NY; 2001;87–128.
29. Lee S-G, Trimi S, Kim C. The impact of cultural differences on technology adoption. J World Bus. 2013; 48(1):20–9.
30. Krishnan S, Lymm J. Determinants of virtual social networks diffusion: Insights from cross-country data. Comput Human Behav. 2016; 54:691–700.
31. De Mooij M. Convergence and divergence in consumer behaviour: implications for global advertising. Int J. 2003; 22:183–202.
32. Bourdieu P. Distinction: A Social Critique of the Judgment of Taste. 1984. 632 p.
33. Zhou L, Hui MK. Symbolic value of foreign products in the People’s Republic of China. J Int Mark. 2003; 11(2):36–58.
34. YouTube. Region-specific Standard Video Feeds. 2016.
35. Newman MEJ. Scientific collaboration networks. II. Shortest paths, weighted networks, and centrality. Phys Rev E. 2001; 64(1):16132.
36. Serrano MA, Boguña´ M, Vespignani A. Extracting the multiscale backbone of complex weighted net-works. Proc Natl Acad Sci U S A. 2009; 106(16):6483–8.https://doi.org/10.1073/pnas.0808904106 PMID:19357301
37. Bail CA. Combining natural language processing and network analysis to examine how advocacy orga-nizations stimulate conversation on social media. Proc Natl Acad Sci. 2016 Oct 18; 113(42):11823–8. https://doi.org/10.1073/pnas.1607151113PMID:27694580
38. Opsahl T, Agneessens F, Skvoretz J. Node centrality in weighted networks: Generalizing degree and shortest paths. Soc Networks. 2010; 32(3):245–51.
39. Garcia-gavilanes R, Quercia D, Jaimes A. Cultural Dimensions in Twitter: Time, Individualism and Power. Proc Int AAAI Conf Web Soc Media. 2013;195–204.
40. Barnett GA, Jacobson T, Choi Y, Sun-Miller S. An examination of the international telecommunication network. J Int Commun. Taylor & Francis; 1996; 3(2):19–43.
41. Hofstede GH. Culture’s Consequences: International Differences in Work-related Values. Cross-Cul-tural Research and Methodology series. 1980. 475 p.
42. World Bank Open Data. Internet Users (Per 100 People) [Internet]. 2014 [cited 2016 Sep 19]. Available from:http://data.worldbank.org/
43. Garcı´a-Gavilanes R, Mejova Y, Quercia D. Twitter ain’t Without Frontiers: Economic, Social, and Cul-tural Boundaries in International Communication. In: Proceedings of the 17th ACM conference on Com-puter supported cooperative work & social computing—CSCW ‘14. 2014. p. 1511–22.
44. Cha M, Kwak H, Rodriguez P, Ahn Y, Moon S. I tube, you tube, everybody tubes: analyzing the world’s largest user generated content video system. ACM Internet Meas Conf. 2007;1–14.
45. Stirling A. A general framework for analysing diversity in science, technology and society. J R Soc Inter-face. 2007; 4(15):707–19.https://doi.org/10.1098/rsif.2007.0213PMID:17327202
46. Park M, Weber I, Naaman M, Vieweg S. Understanding Musical Diversity via Online Social Media. In: Proceedings of the International AAAI Conference on Web and Social Media (ICWSM). 2015.
47. Norris P, Inglehart R. Cosmopolitan communications: Cultural diversity in a globalized world. New York: Cambridge University Press; 2009. 446 p.
48. Allport GW. The Nature of Prejudice. Canadian Psychology. 1954. 537 p.
49. Nye JS. Soft Power: The Means to Success in World Politics. New York: Public Affairs; 2004. 191 p.
50. Vander Stichele A, Laermans R. Cultural participation in Flanders: Testing the cultural omnivore thesis with population data. Poetics. 2006; 34(1):45–64.