ORIGINAL ARTICLE
Conditional survival in patients
with gallbladder cancer
Yi‑Jun Kim and Kyubo Kim
*Abstract
Background: Conditional survival (CS) has been established as a clinically relevant prognostic factor for cancer sur‑
vivors, and the CS in gallbladder (GB) cancer has not yet been fully evaluated. In this study, we evaluated the cancer‑ specific CS rate and cancer‑specific survival (CSS) rate in patients with GB cancer at multiple time points and investi‑ gated prognostic factors which affect cancer‑specific CS rate to provide more accurate survival information.
Methods: Between 2004 and 2013, a total of 9760 patients with GB cancer were identified from the Surveillance,
Epidemiology, and End Results (SEER) data. The 3‑year cancer‑specific CS rate was calculated using the covariate‑ adjusted survival function in the Cox model for each year since diagnosis, and the results were analyzed together with the adjusted CSS rates at the same time points. Cox proportional hazards regression was performed to ascertain the individual contribution of factors associated with CSS rate at diagnosis and cancer‑specific CS rates at 1, 3, and 5 years after diagnosis.
Results: The adjusted 5‑year CSS rate was 26.1%. The adjusted 3‑year cancer‑specific CS rates at 1, 2, 3, 4, and 5 years
after diagnosis were 55.5, 72.2, 81.5, 86.8, and 90.5%, respectively. At the time of diagnosis, age, race, histology, grade, T, N, and M categories, surgery, radiotherapy, insurance status, and marriage status were significant prognostic fac‑ tors of CSS. Five years after diagnosis, however, T and M categories were significant prognostic factors for survivors (P = 0.007 and P = 0.009, respectively), whereas surgery and radiotherapy were not.
Conclusions: T and M categories were significant prognostic factors even 5 years after the initial diagnosis, whereas
local treatments at the time of diagnosis were not, suggesting that patients with GB cancer at high risks might need further adjuvant therapy after primary treatments. The combined analysis of CSS and cancer‑specific CS rates offered more accurate survival information for patients who have already survived a certain period of time after diagnosis.
Keywords: Gallbladder cancer, Conditional survival, SEER
© The Author(s) 2017. This article is distributed under the terms of the Creative Commons Attribution 4.0 International License (http://creativecommons.org/licenses/by/4.0/), which permits unrestricted use, distribution, and reproduction in any medium, provided you give appropriate credit to the original author(s) and the source, provide a link to the Creative Commons license, and indicate if changes were made. The Creative Commons Public Domain Dedication waiver (http://creativecommons.org/ publicdomain/zero/1.0/) applies to the data made available in this article, unless otherwise stated.
Introduction
Although gallbladder (GB) cancer is not a common malignancy with approximately 5000 new cases per year in the United States, it is the most common biliary tract cancer and the fifth most common
gastrointesti-nal malignancy [1]. The prognosis of GB cancer is poor,
with a 5-year overall survival (OS) rate of 5%–17% [2–5].
North Indians [6] and South American Indians [7] have
a high incidence of GB cancer with a worse prognosis, as the 5-year survival rate is reported to be less than 10%.
However, more aggressive surgery and the use of adju-vant therapy have improved survival outcomes over the
last few decades [8–11].
Prognostic estimation for cancer patients is usu-ally performed using the cancer-specific survival (CSS) measurement. As the CSS rate is defined as the survival probability from diagnosis to a specific time point, CSS underestimates the actual survival rates of the cancer survivors who have already survived a certain period. This underestimation is prominent in cancer patients with poor CSS such as GB cancer patients.
Cancer-specific conditional survival (CS) rate is defined as the probability that a cancer patient will survive some additional number of years, given the condition that
Open Access
*Correspondence: kyubokim.ro@gmail.com
Department of Radiation Oncology, Ewha Womans University College of Medicine, 1071 Anyangcheon‑ro, Yangcheon‑gu, Seoul 07985, Republic of Korea
the patient has already survived for a certain number of years. In actual clinical practice, the cancer-specific CS rate is informative for patients and their clinicians because the cancer-specific CS rate applies the
condi-tion that the patient is still alive [12]. Incorporating
infor-mation on alive status generates more relevant survival
estimation (CS rate) than the classical CSS rate [13].
Therefore, the use of cancer-specific CS rate is meaning-ful during patient counseling.
Furthermore, the cancer-specific CS rate can be used as a surrogate for cure rate. If the cancer-specific CS rate reaches a plateau (i.e., ceiling) at a certain time point, a patient who survives to the time point with no evidence
of disease can be considered to be cured [14].
Analyz-ing the cancer-specific CS rate of GB cancer may provide quantitative insight into the curability of GB cancer.
In this study, we calculated the cancer-specific CS rate of GB cancer using the Surveillance, Epidemiology, and End Results (SEER) database between 2004 and 2013. The over-time changes of prognostic significance of patient, tumor, and treatment-related factors were analyzed. Methods and materials
Patient population
The SEER 18-registry dataset (a set of 18 population-based regional cancer registries) was used in this study. Patients who were pathologically or clinically diagnosed with primary GB cancer (ICD-0-3 code 23.9/WHO 2008) between 2004 and 2013 were identified. The patients with unknown survival time were excluded. Tumors were clas-sified according to the 7th edition of the American Joint
Committee on Cancer (AJCC) staging manual [15].
Statistical analysis
The formula of cancer-specific CS rate is as follows [12];
CSS(t) is the t-year CSS rate. Cancer-specific CS(y|x) is the additional y-year CSS rate, given the condition that the person has already survived x years.
For example, to calculate the 3-year cancer-specific CS rate for a patient who has already survived 2 years (x = 2, y = 3), the 5-year CSS rate, CSS(2 + 3), is divided by the 2-year CSS rate, CSS(2). Suppose that there were 100 patients diagnosed with GB cancer. Among them, 50 patients have survived from the cancer for 2 years [CSS(2) = 0.5], and 20 patients have survived for 5 years [CSS(5) = 0.2]. In that case, the 3-year cancer-specific CS rate at 2 years after diagnosis is 0.4 (0.2/0.5).
cancer − specific CS y|x = CSS(x + y)
CSS(x) cancer − specific CS(3|2) =CSS(2 + 3) CSS(2) = 20 100 50 100 =20 50 = 0.4
In this formula, the initial settings of 100 patients and the 2-year time interval are eliminated. Cancer-specific CS(3|2) can be defined as the 3-year CSS rate of the selective patients who survived for 2 years (n = 50) calcu-lated by using newly formatted survival time (subtraction of 2 years from the initial survival time).
With this concept, the 3-year cancer-specific CS rates for the patients who survived for x years were computed by following procedures: (1) selection of x-year survivors; (2) subtraction of x years from the initial survival time; and (3) calculation of a 3-year CSS rate for the survivors using the modified survival time.
The Kaplan–Meier method was used to estimate the CSS and cancer-specific CS rates. To calculate 95% con-fidence intervals (CIs) of the CSS and cancer-specific CS rates, the log–log transformation of survival was used
[16].
Multivariate Cox proportional-hazards regression was performed to evaluate the hazard of CSS rate at the time of diagnosis and cancer-specific CS rates for mul-tiple survival periods (1, 3, and 5 years after diagnosis). For instance, to compute the cancer-specific CS rate at 1 year after diagnosis, 1-year survivors were selected. After subtraction of 12 months from their survival time, a multivariate analysis was performed. Incorporated vari-ables for the analysis at diagnosis were demographic (age at diagnosis, sex, race, marital status, insurance status), tumor (histology, grade, T, N, and M categories), and treatment-related factors (surgical extent, radiotherapy). Only the variables which were prognostic with P value less than 0.1 in the analysis of the previous period were selected and incorporated in the next period’s multi-variate analysis sequentially. The multimulti-variate Cox pro-portional hazards regression was performed using SPSS version 22.0 (SPSS Inc., Chicago, IL, USA).
At the same time, considering the potential influ-ence of covariates on the survival at each time point, the covariate-adjusted survival function in the Cox model was used to estimate the adjusted CSS and cancer-spe-cific CS rates. Specancer-spe-cifically, the CSS and cancer-specancer-spe-cific CS rates calculated with an adjustment for age, sex, race, histology, grade, T, N, and M categories, surgery, radio-therapy, insurance, and marital status. The log–log-based point-wise CIs were obtained for the adjusted CSS and
cancer-specific CS rates [17]. For example, to calculate
the adjusted 3-year cancer-specific CS rate at 1 year after diagnosis, the patients who have survived 12 months were selected and these 12 months were subtracted from the survival times of the survivors. Subsequent analysis was performed using the Cox regression while incor-porating all variables. Given the estimated coefficients from the Cox model, a covariate-adjusted survival func-tion estimate was performed, and the estimated survival
rate at 36 months (that is, 48 months from diagnosis) was obtained as the adjusted 3-year cancer-specific CS rate at 1 year after diagnosis.
For subgroup analyses, the variables, which were found to be significant prognostic factors in the mul-tivariate analyses, were selected to divide patients into multiple risk groups. The adjusted CSS rates and 3-year cancer-specific CS rates at 1, 2, 3, 4, and 5 years after diagnosis were calculated and compared among risk groups.
All calculations of unadjusted or adjusted CSS and can-cer-specific CS rates were carried out using STATA/MP (ver. 14.2; StataCorp LP, College Station, TX, USA). Results
Demographic and clinicopathologic characteristics
A total of 9760 patients diagnosed with GB cancer between 2004 and 2013 were included in our analyses. The number of patients who were still alive was 3232, 1178, and 612 at 1, 3, and 5 years after diagnosis,
respec-tively. Table 1 shows the characteristics of the patients at
diagnosis as well as at 1, 3, and 5 years after diagnosis. At diagnosis, the majority of patients were women (n = 6748, 69.1%) and white (n = 7528, 77.1%). A consid-erable proportion of patients had high-risk tumors with advanced T category (T3 or T4, n = 4492, 46.0%), lymph node involvement (n = 2623, 26.9%), and distant metas-tasis (n = 3266, 33.5%). A majority of patients (n = 6321, 64.8%) received surgical treatment at primary site. Radio-therapy was administered in 1254 (12.8%) patients.
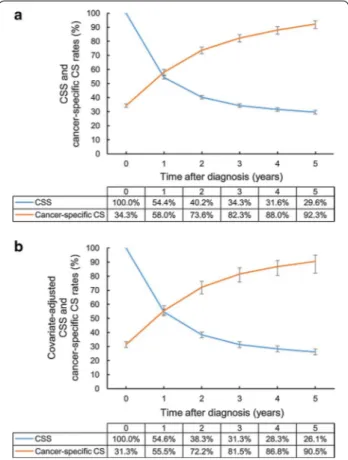
Trends of CSS and adjusted CSS rates
The overall CSS rate was 54.4, 40.2, 34.3, 31.6, and 29.6% at 1, 2, 3, 4, and 5 years, respectively. The covar-iate-adjusted CSS rate showed a similar trend as the unadjusted CSS rate, although that was slightly lower (54.6, 38.3, 31.3, 28.3, and 26.1% at 1, 2, 3, 4, and 5 years,
respectively) (Fig. 1).
Trends of CS and adjusted CS rates
While the CSS rate decreased over time, the 3-year can-cer-specific CS rate increased gradually in each succes-sive year. The increased 3-year cancer-specific CS rate approached a plateau phase (82.3, 88.0, and 92.3% at 3, 4, and 5 years, respectively), suggesting that the major-ity of survivors at 5 years after diagnosis achieved stable
cures of their GB cancer (Fig. 1). Even after
covari-ate adjustment, the cancer-specific CS rcovari-ates increased over time to reach a plateau. Although the rates were slightly lower than the unadjusted rates, the adjusted cancer-specific CS rate reached to 90.5% at 5 years after diagnosis.
Factors associated with CSS and cancer‑specific CS rates
Upon multivariate analysis at the time of diagnosis, patients who were young, white, had papillary histol-ogy, had low grade tumors, low T, N, and M categories, underwent surgery and radiotherapy, were insured, and were married had significantly higher CSS rates than the
controls (Table 2). At 1 year after diagnosis, age 80 years
or more (P = 0.007), black race (P = 0.040), high grade (P = 0.043), high T, N, and M categories (P < 0.001 for all) were identified as significantly adverse predictors, and papillary histology (P = 0.003), surgery (P = 0.012), and radiotherapy (P = 0.015) were significantly favora-ble predictors. At 3 years after diagnosis, T3–4 and M1 diseases continued to predict low cancer-specific CS rate for survivors (P < 0.001 and P = 0.038, respectively). On multivariate analysis incorporating age, T and M catego-ries, and surgery at 5 years after diagnosis, we found T category (for T2 disease, hazard ratio [HR] 1.346 and 95% CI 0.567–3.199, P = 0.501; for T3–4 disease, HR 3.388 and 95% CI 1.400–8.196; P = 0.007) and M category (for M1, HR 4.620 and 95% CI 1.476–14.457; P = 0.009) to be persistently significant prognostic factors.
Subgroup analysis of CSS and cancer‑specific CS rates
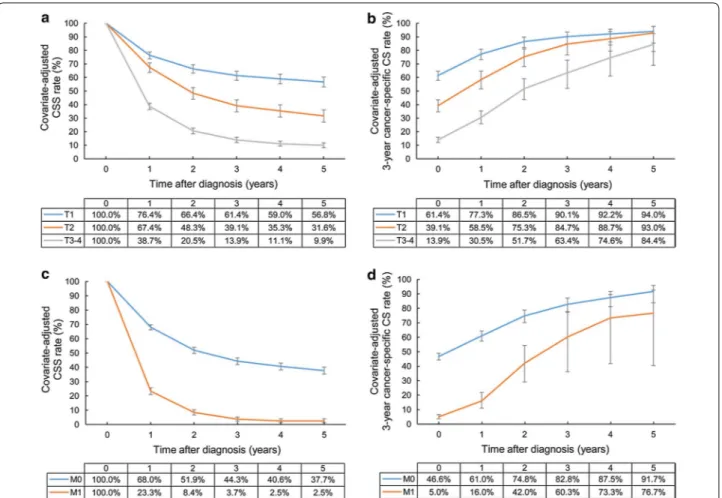
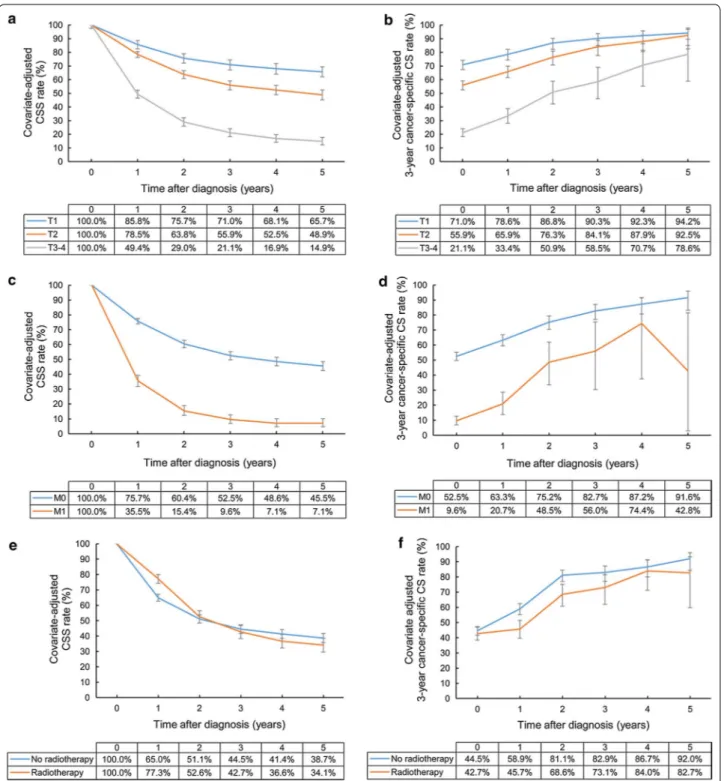
The adjusted 5-year CSS rates of patients with T1, T2, and T3–4 disease were 56.8, 31.6, and 9.9%, respectively. The adjusted 3-year cancer-specific CS rate for patients with T3–4 disease showed the greatest improvement from 13.9% at 1 year after diagnosis to 84.4% at 5 years after diagnosis. However, the significant inferiority of the 3-year cancer-specific CS rate continued at 3 years after diagnosis. The 3-year cancer-specific CS rates at 5 years for patients with T1, T2, and T3–4 disease were 94.0, 93.0, and 84.4%, respectively, suggesting that the 5-year survivors with T1–2 diseases achieved stable cures of their disease.
The adjusted 5-year CSS rate of patients with distant metastasis (M1 disease) at time of diagnosis was only 2.5%. The improvement of 3-year cancer-specific CS rate was decelerated and eventually ceased at 76.7% at 5 years after diagnosis, indicating that patients with M1 disease at diagnosis still experience disease progression despite
surviving 5 years (Fig. 2).
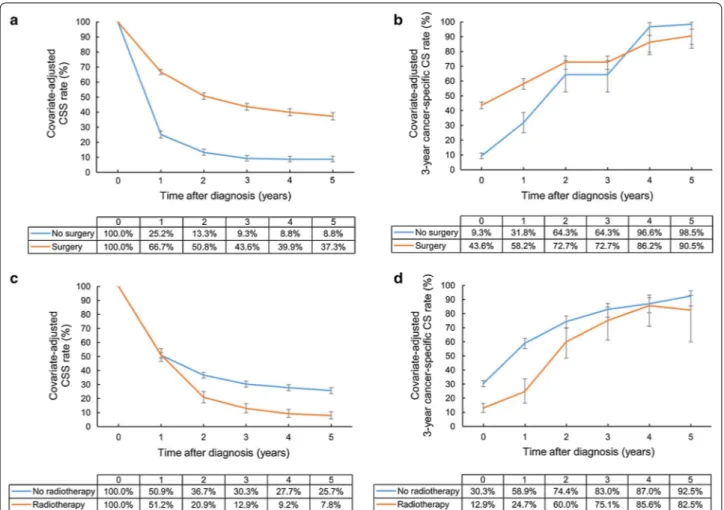
Surgery increased the 5-year CSS rate from 8.8% to 37.3%, with a 3-year cancer-specific CS rate of 90.5% at 5 years after diagnosis. However, radiotherapy did not show any CSS and cancer-specific CS benefits. The patients who had low cancer-specific CS rates at an early period in the radiotherapy group were prone to have a low CSS rate at the late period. At 5 years after diagno-sis, the CSS rates were 25.7% and 7.8% in the non-radio-therapy group and radionon-radio-therapy group, respectively. The
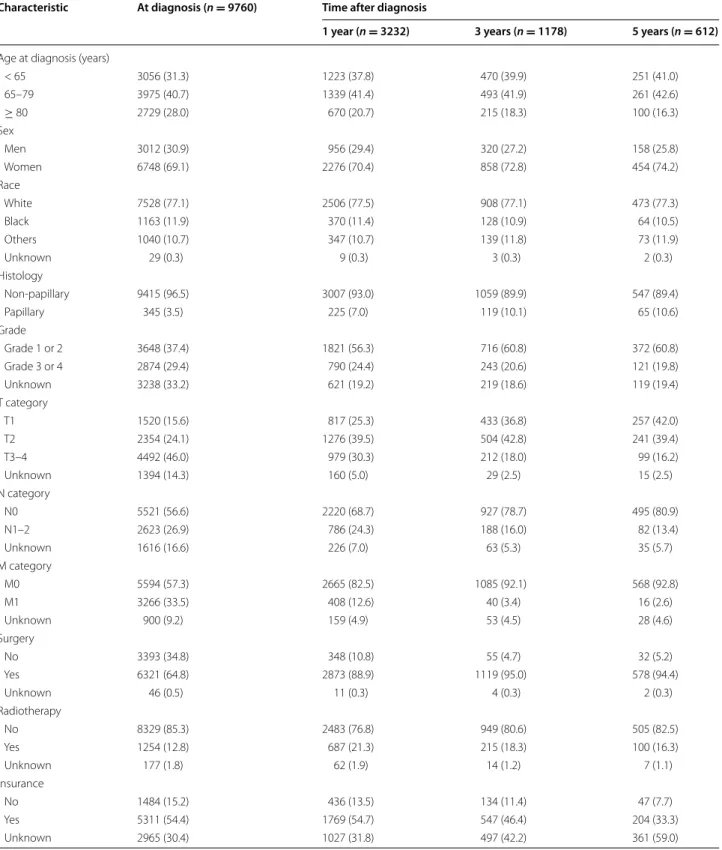
Table 1 Characteristics of patients with gallbladder cancer at the time of diagnosis and survivor characteristics at 1, 3, and 5 years after diagnosis
Characteristic At diagnosis (n = 9760) Time after diagnosis
1 year (n = 3232) 3 years (n = 1178) 5 years (n = 612)
Age at diagnosis (years)
< 65 3056 (31.3) 1223 (37.8) 470 (39.9) 251 (41.0) 65–79 3975 (40.7) 1339 (41.4) 493 (41.9) 261 (42.6) ≥ 80 2729 (28.0) 670 (20.7) 215 (18.3) 100 (16.3) Sex Men 3012 (30.9) 956 (29.4) 320 (27.2) 158 (25.8) Women 6748 (69.1) 2276 (70.4) 858 (72.8) 454 (74.2) Race White 7528 (77.1) 2506 (77.5) 908 (77.1) 473 (77.3) Black 1163 (11.9) 370 (11.4) 128 (10.9) 64 (10.5) Others 1040 (10.7) 347 (10.7) 139 (11.8) 73 (11.9) Unknown 29 (0.3) 9 (0.3) 3 (0.3) 2 (0.3) Histology Non‑papillary 9415 (96.5) 3007 (93.0) 1059 (89.9) 547 (89.4) Papillary 345 (3.5) 225 (7.0) 119 (10.1) 65 (10.6) Grade Grade 1 or 2 3648 (37.4) 1821 (56.3) 716 (60.8) 372 (60.8) Grade 3 or 4 2874 (29.4) 790 (24.4) 243 (20.6) 121 (19.8) Unknown 3238 (33.2) 621 (19.2) 219 (18.6) 119 (19.4) T category T1 1520 (15.6) 817 (25.3) 433 (36.8) 257 (42.0) T2 2354 (24.1) 1276 (39.5) 504 (42.8) 241 (39.4) T3–4 4492 (46.0) 979 (30.3) 212 (18.0) 99 (16.2) Unknown 1394 (14.3) 160 (5.0) 29 (2.5) 15 (2.5) N category N0 5521 (56.6) 2220 (68.7) 927 (78.7) 495 (80.9) N1–2 2623 (26.9) 786 (24.3) 188 (16.0) 82 (13.4) Unknown 1616 (16.6) 226 (7.0) 63 (5.3) 35 (5.7) M category M0 5594 (57.3) 2665 (82.5) 1085 (92.1) 568 (92.8) M1 3266 (33.5) 408 (12.6) 40 (3.4) 16 (2.6) Unknown 900 (9.2) 159 (4.9) 53 (4.5) 28 (4.6) Surgery No 3393 (34.8) 348 (10.8) 55 (4.7) 32 (5.2) Yes 6321 (64.8) 2873 (88.9) 1119 (95.0) 578 (94.4) Unknown 46 (0.5) 11 (0.3) 4 (0.3) 2 (0.3) Radiotherapy No 8329 (85.3) 2483 (76.8) 949 (80.6) 505 (82.5) Yes 1254 (12.8) 687 (21.3) 215 (18.3) 100 (16.3) Unknown 177 (1.8) 62 (1.9) 14 (1.2) 7 (1.1) Insurance No 1484 (15.2) 436 (13.5) 134 (11.4) 47 (7.7) Yes 5311 (54.4) 1769 (54.7) 547 (46.4) 204 (33.3) Unknown 2965 (30.4) 1027 (31.8) 497 (42.2) 361 (59.0)
adjusted 3-year cancer-specific CS rate at 5 years after
diagnosis in the radiotherapy group was 82.5% (Fig. 3).
In subgroup analyses for patients treated with surgery, T and M categories were still significant prognostic fac-tors. The 5-year CSS rates of patients with T1, T2, and T3–4 diseases were 65.7, 48.9, and 14.9%, respectively, and the patients with T1 and T2 diseases had 3-year cancer-specific CS rates of higher than 90% at 5 years after diagnosis (94.2% and 92.5%, respectively), whereas those with T3–4 diseases did not (78.6%). Even after sur-gery, patients with M1 disease showed a low 5-year CSS
rate (7.1% vs. 45.5%) and 3-year cancer-specific CS rate (42.8% vs. 91.6%) at 5 years after diagnosis compared with patients with M0 disease.
When radiotherapy was administered after surgery, the adjusted CSS rate at 1 year after diagnosis increased from 65.0% to 77.3%. However, radiotherapy decreased the 3-year cancer-specific CS rate at an early period, result-ing in a 5-year CSS rate of 34.1% in the radiotherapy group, which was similar to 38.7% in the
non-radiother-apy group (Fig. 4).
Discussion
In the present study, we found that the 3-year cancer-specific CS rate of GB cancer patients increased over time, resulting in the covariate-adjusted 3-year cancer-specific CS rate of 90.5% at 5 years after diagnosis. The covariate-adjusted 5-year CSS rate was 26.1%. Therefore, 26.1% of GB cancer patients who survived 5 years can be expected to survive 3 more years with 90.5% of probabil-ity. T and M categories were significant prognostic fac-tors at the time of diagnosis and their prognostic effects persisted until 5 years after diagnosis. However, local treatments at the time of diagnosis including surgery and radiotherapy were not prognostic factors at 5 years after diagnosis. The combined information of CSS and cancer-specific CS rates allowed more efficient prognostic and predictive analyses.
The CS rate is higher than the CSS rate estimated at the time of diagnosis. If a patient is still alive 2 years after diagnosis, the 3-year CS rate at 2 years after diagnosis is higher than the 5-year CSS rate, because the 5-year CSS rate includes the probability of patients who died within 2 years after diagnosis. For patients who survive, the CS rate can offer more accurate information regarding sur-vival estimation compared with the traditionally used CSS rate. The cancer-specific CS rate is usually higher than the CSS rate even in patients who are alive with dis-ease, and the difference between both rates is even more
distinct for patients with poor prognosis cancers [18].
Therefore, the cancer-specific CS rate is a more relevant prognostic factor compared with the CSS rate, especially for the survivors of poor prognosis cancers.
All values are presented as number of cases followed by percentage in parentheses
Table 1 continued
Characteristic At diagnosis (n = 9760) Time after diagnosis
1 year (n = 3232) 3 years (n = 1178) 5 years (n = 612)
Marriage
No 4610 (47.2) 1365 (42.2) 480 (40.7) 237 (38.7)
Yes 4689 (48.0) 1723 (53.3) 651 (55.3) 346 (56.5)
Unknown 461 (4.7) 144 (4.5) 47 (4.0) 29 (4.7)
Fig. 1 CSS and 3‑year cancer‑specific CS rates of gallbladder cancer
patients: a unadjusted (Kaplan–Meier) and b covariate‑adjusted (Cox model) CSS and CS rates. Error bars indicate 95% confidence intervals (CIs). CSS cancer‑specific survival, CS conditional survival
Table 2 C ox pr op or tional hazar ds r egr ession analy ses of canc er-sp ecific sur viv al a t
the time of
diagnosis and canc er-sp ecific c onditional sur viv al f or gallblad -der c anc er sur viv ors a t 1, 3, and 5 y ears af ter diagnosis Char ac ter ‑ istics A t diag nosis ( n = 9760) 1 y ear af ter diag nosis ( n = 3232) 3 y ears af ter diag nosis ( n = 1178) 5 y ears af ter diag nosis ( n = 612) Pa tien ts CSD HR (95% CI) P v alue Sur viv ors CSCD HR (95% CI) P v alue Sur viv ors CSCD HR (95% CI) P v alue Sur viv ors CSCD HR (95% CI) P v alue A ge at diag nosis (y ears) < 65 3056 1760 (57.6) Ref er ence 1223 477 (39.0) Ref er ence 470 63 (13.4) Ref er ence 251 15 (6.0) Ref er ence 65–79 3975 2177 (54.8) 1.178 (1.104– 1.256) < 0.001 1339 472 (35.3) 1.038 (0.912– 1.182) 0.574 493 71 (14.4) 1.117 (0.789– 1.581) 0.534 261 15 (5.7) 0.971 (0.472– 1.998) 0.937 ≥ 80 2729 1495 (54.8) 1.584 (1.471– 1.706) < 0.001 670 213 (31.8) 1.271 (1.068– 1.513) 0.007 215 32 (14.9) 1.504 (0.967– 2.338) 0.070 100 4 (4.0) 0.885 (0.290– 2.698) 0.830 Sex M en 3012 1633 (54.2) Ref er ence 956 349 (36.5) NA 320 47 (14.7) NA 158 11 (7.0) NA W omen 6748 3799 (56.3) 0.988 (0.931– 1.049) 0.689 2276 813 (35.7) 858 119 (13.9) 454 23 (5.1) Race Whit e 7528 4148 (55.1) Ref er ence 2506 886 (35.4) Ref er ence 908 134 (14.8) Ref er ence 473 28 (5.9) NA Black 1163 683 (58.7) 1.095 (1.009– 1.189) 0.030 370 151 (40.8) 1.202 (1.009– 1.432) 0.040 128 15 (11.7) 0.782 (0.455– 1.346) 0.375 64 5 (7.8) O thers 1040 596 (57.3) 0.997 (0.914– 1.087) 0.945 347 125 (36.0) 1.005 (0.831– 1.215) 0.958 139 17 (12.2) 0.861 (0.515– 1.441) 0.569 73 1 (1.4) Unk no wn 29 5 (17.2) 0.374 (0.156– 0.900) 0.028 9 0 (0.0) NA (NA) 0.873 3 0 (0.0) NA (NA) 0.970 2 0 (0.0) H ist ology Non ‑pap ‑ illar y 9415 5343 (56.7) Ref er ence 3007 1120 (37.2) Ref er ence 1059 156 (14.7) Ref er ence 547 33 (6.0) NA P apillar y 345 89 (25.8) 0.550 (0.444– 0.680) < 0.001 225 42 (18.7) 0.622 (0.454– 0.851) 0.003 119 10 (8.4) 0.792 (0.411– 1.527) 0.486 65 1 (1.5) Grade Grade 1–2 3648 1549 (42.5) Ref er ence 1821 580 (31.9) Ref er ence 716 105 (14.7) Ref er ence 372 25 (6.7) NA Grade 3–4 2874 1760 (61.2) 1.523 (1.419– 1.634) < 0.001 790 353 (44.7) 1.152 (1.004– 1.322) 0.043 243 40 (16.5) 0.744 (0.506– 1.093) 0.132 121 6 (5.0) Unk no wn 3238 2123 (65.6) 1.144 (1.052– 1.244) 0.002 621 229 (36.9) 0.776 (0.639– 0.942) 0.010 219 21 (9.6) 0.703 (0.409– 1.206) 0.200 119 3 (2.5)
Table 2 c on tinued Char ac ter ‑ istics A t diag nosis ( n = 9760) 1 y ear af ter diag nosis ( n = 3232) 3 y ears af ter diag nosis ( n = 1178) 5 y ears af ter diag nosis ( n = 612) Pa tien ts CSD HR (95% CI) P v alue Sur viv ors CSCD HR (95% CI) P v alue Sur viv ors CSCD HR (95% CI) P v alue Sur viv ors CSCD HR (95% CI) P v alue T cat egor y T1 1520 525 (34.5) Ref er ence 817 160 (19.6) Ref er ence 433 34 (7.9) Ref er ence 257 9 (3.5) Ref er ence T2 2354 870 (37.0) 1.153 (1.032– 1.289) 0.012 1276 361 (28.3) 1.358 (1.118– 1.649) < 0.002 504 61 (12.1) 1.446 (0.931– 2.247) 0.101 241 12 (5.0) 1.346 (0.567– 3.199) 0.501 T3–4 4492 3033 (67.5) 2.356 (2.133– 2.602) < 0.001 979 551 (56.3) 2.916 (2.405– 3.537) < 0.001 212 62 (29.2) 3.948 (2.486– 6.270) < 0.001 99 13 (13.1) 3.388 (1.400– 8.196) 0.007 Unk no wn 1394 1004 (72.0) 1.897 (1.676– 2.148) < 0.001 160 90 (56.3) 2.629 (1.913– 3.613) < 0.001 29 9 (31.0) 7.250 (2.871– 18.309) < 0.001 15 0 (0.0) NA (NA) 0.980 N cat egor y N0 5521 2601 (47.1) Ref er ence 2220 646 (29.1) Ref er ence 927 114 (12.3) Ref er ence 495 20 (4.0) NA N1–2 2623 1683 (64.2) 1.213 (1.137– 1.294) < 0.001 786 407 (51.8) 1.493 (1.301– 1.714) < 0.001 188 41 (21.8) 1.272 (0.845– 1.915) 0.248 82 12 (14.6) Unk no wn 1616 1148 (71.0) 1.277 (1.173– 1.392) < 0.001 226 109 (48.2) 1.230 (0.947– 1.598) 0.120 63 11 (17.5) 1.088 (0.429– 2.763) 0.858 35 2 (5.7) M cat egor y M0 5594 2427 (43.4) Ref er ence 2665 831 (31.2) Ref er ence 1085 143 (13.2) Ref er ence 568 30 (5.3) Ref er ence M1 3266 2385 (73.0) 2.050 (1.912– 2.199) < 0.001 408 258 (63.2) 2.346 (1.987– 2.769) < 0.001 40 12 (30.0) 2.022 (1.040– 3.932) 0.038 16 4 (25.0) 4.620 (1.476– 14.457) 0.009 Unk no wn 900 620 (68.9) 1.417 (1.274– 1.575) < 0.001 159 73 (45.9) 1.051 (0.784– 1.409) 0.741 53 11 (20.8) 1.093 (0.447– 2.675) 0.845 28 0 (0.0) NA (NA) 0.976 Sur ger y No 3393 2427 (71.5) Ref er ence 348 190 (54.6) Ref er ence 55 4 (7.3) Ref er ence 32 1 (3.1) Ref er ence Ye s 6321 2970 (47.0) 0.576 (0.532– 0.624) < 0.001 2873 968 (33.7) 0.754 (0.605– 0.940) 0.012 1119 162 (14.5) 4.403 (1.466– 13.219) 0.008 578 33 (5.7) 3.000 (0.372– 24.190) 0.302 Unk no wn 46 35 (76.1) 0.980 (0.684– 1.404) 0.913 11 4 (36.4) 0.841 (0.299– 2.365) 0.742 4 0 (0.0) NA (NA) 0.969 2 0 (0.0) NA (NA) 0.994 Radiotherap y No 8329 4694 (56.4) Ref er ence 2483 829 (33.4) Ref er ence 949 120 (12.6) Ref er ence 505 25 (5.0) NA
Table 2 c on tinued Char ac ter ‑ istics A t diag nosis ( n = 9760) 1 y ear af ter diag nosis ( n = 3232) 3 y ears af ter diag nosis ( n = 1178) 5 y ears af ter diag nosis ( n = 612) Pa tien ts CSD HR (95% CI) P v alue Sur viv ors CSCD HR (95% CI) P v alue Sur viv ors CSCD HR (95% CI) P v alue Sur viv ors CSCD HR (95% CI) P v alue Ye s 1254 641 (51.1) 0.740 (0.679– 0.808) < 0.001 687 314 (45.7) 1.195 (1.035– 1.379) 0.015 215 45 (20.9) 1.378 (0.933– 2.035) 0.107 100 9 (9.0) Unk no wn 177 97 (54.8) 0.876 (0.707– 1.085) 0.225 62 19 (30.6) 0.897 (0.558– 1.441) 0.653 14 1 (7.1) 0.583 (0.080– 4.233) 0.594 7 0 (0.0) Insurance No 1484 804 (54.2) Ref er ence 436 135 (31.0) Ref er ence 134 13 (9.7) NA 47 0 (0.0) NA Ye s 5311 2766 (52.1) 0.891 (0.822– 0.966) 0.005 1769 586 (33.1) 1.049 (0.867– 1.269) 0.625 547 53 (9.7) 204 9 (4.4) Unk no wn 2965 1862 (62.8) 1.061 (0.975– 1.155) 0.170 1027 441 (42.9) 1.154 (0.948– 1.405) 0.154 497 100 (20.1) 361 25 (6.9) M ar riage No 4610 2603 (56.5) Ref er ence 1365 454 (33.3) Ref er ence 480 70 (14.6) NA 237 15 (6.3) NA Ye s 4689 2591 (55.3) 0.904 (0.852– 0.958) 0.001 1723 662 (38.4) 1.093 (0.965– 1.239) 0.163 651 91 (14.0) 346 19 (5.5) Unk no wn 461 238 (51.6) 0.905 (0.792– 1.035) 0.144 144 46 (31.9) 1.011 (0.746– 1.371) 0.942 47 5 (10.6) 29 0 (0.0) Pa tien ts a
t the time of diag
nosis and sur
viv ors a t 1, 3, and 5 y ears af ter diag nosis ar e pr esen
ted as number of cases
. CSD and CSCD ar
e pr
esen
ted as number of cases f
ollo w ed b y per cen tage in par en theses CSD canc er -specific dea th, CS CD canc er -specific c onditional dea th, HR hazar d r atio , CI c onfidenc e in ter val , NA not applicable
One of the advantages of the CS model compared with the Kaplan–Meier survival curve or multivariate regres-sion models is that it offers more intuitive and quan-titative information about the cure rate. Even without information about cancer recurrence or progression, the percentage of remaining patients when the CS rate reaches to a plateau (e.g., > 90%) could be used as a
sur-rogate for the stable cure rate of the disease [14]. By using
CS analysis, the benefit of treatments can also be evalu-ated; the difference of the percentage of patients who reach a plateau of CS rate between control and treatment groups can be considered the improved cure rate from
the treatment [19–24].
In the present study, multivariate analyses of cancer-specific CS rates at 1, 3, and 5 years after diagnosis also provided useful information that T and M categories were the most significant prognostic factors even at 5 years after diagnosis, whereas surgery and radiotherapy were not. This finding suggests that patients with high risks might benefit from adjuvant treatments including systemic therapy after initial radical treatments.
There is no argument based on our analysis that com-plete resection with negative margin is a necessary con-dition for potentially curative treatment, whereas the role of both chemotherapy and radiotherapy have not
been fully established [25–27]. In our present study,
sur-gery increased the 5-year CSS rate to 28.5% with a 3-year cancer-specific CS rate of 90.5% at 5 years after diagnosis. However, radiotherapy did not increase CSS or CS rates at 5 years after diagnosis even after covariate adjustment. In the subgroup analysis of the surgery group, although radiotherapy increased the 1-year CSS rate, the lower cancer-specific CS rate at 1 year after diagnosis com-pared with the non-radiotherapy group indicated a poor prognosis at late period, resulting in no difference in the CSS rate at 5 years after diagnosis between the radiother-apy and non-radiotherradiother-apy groups.
Hyder et al. [28] demonstrated a similar conclusion
in a propensity score-matched SEER data analysis that adjuvant external beam radiotherapy after curative-intent resection for GB cancer showed a survival bene-fit at 1 year after diagnosis and the benebene-fit dissipated at
Fig. 2 Covariate‑adjusted (Cox model) CSS and 3‑year cancer‑specific CS rates of gallbladder cancer patients according to T and M categories: a
CSS rates according to T category; b cancer‑specific CS rates according to T category; c CSS rates according to M category; d cancer‑specific CS rates according to M category. Error bars indicate 95% CIs. CSS cancer‑specific survival, CS conditional survival
5 years after diagnosis. This result gives an impression that although radiotherapy may delay the progression of the disease, it can not increase long-term overall survival rate.
However, these results should be interpreted with cau-tion. The discordance between the increased CSS rate and decreased cancer-specific CS rate at 1 year after diagnosis implies survivorship bias; patients who have benefit from radiotherapy might be those at high risk. In spite of the survival benefit of radiotherapy, the sur-vival of the patients at high risk may be shorter than that of the patients at low risk, resulting in the change of the patient cohorts in the late period. Even in the study of
propensity score-matched analysis of Hyder et al. [28],
the patients with lymph node involvement had a
long-term survival benefit from radiotherapy. Wang et al. [5,
29] built nomograms from the SEER database to predict
the individualized survival benefit of adjuvant radio-therapy or chemoradioradio-therapy for patients with resected GB cancer, and these nomograms indicated that as least
patients with T2 or N1 disease will gain survival benefit from radiotherapy.
One possible limitation of this study is that the con-secutively decreasing number of patients in these time series multivariate analyses might have an influence on statistical significance. However, the sample size at 5 years after diagnosis was more than 600 for the analy-sis of the five variables, suggesting the impact would be minor.
If most of the patients with a specific adverse feature died during the early period, the cancer-specific CS rate would be less meaningful. For example, the estimated 1-year survival rate of patients in the non-surgery group was only 25.2%. In that case, a high cancer-specific CS rate at 5 years after diagnosis cannot be translated auto-matically into useless value of surgical treatment. Moreo-ver, the Cox hazard ratio regression at late period is less powerful because of an insufficiently large sample size of patients at high risk (e.g., those with N1-2 diseases). A small number of survivors at 5 years after diagnosis
Fig. 3 Covariate‑adjusted (Cox model) CSS and 3‑year cancer‑specific CS rates of gallbladder cancer patients according to treatments: a CSS rates
according to surgery; b cancer‑specific CS rates according to surgery; c CSS rates according to radiotherapy; d cancer‑specific CS rates according to radiotherapy. Error bars indicate 95% CIs. CSS cancer‑specific survival, CS conditional survival
reflects the low 5-year CSS rate in a risk group, whereas the statistical power of the cancer-specific CS rate at 5 years after diagnosis might be weakened by this small sample size at 5 years after diagnosis.
Jaundice and abnormal liver function could affect the patients’ prognosis, and the presence of gallstone(s) is
also a major risk factor for GB cancer [30–32]. However,
these statuses were not included in the SEER database.
Fig. 4 Covariate‑adjusted (Cox model) CSS and 3‑year cancer‑specific CS rates of gallbladder cancer patients treated with surgery: a CSS rates
according to T category; b cancer‑specific CS rates according to T category; c CSS rates according to M category; d cancer‑specific CS rates accord‑ ing to M category; e rates CSS according to radiotherapy; f cancer‑specific CS rates according to radiotherapy. Error bars indicate 95% CIs. CSS cancer‑specific survival, CS conditional survival
SEER data did not offer any information on tumor recurrence or progression, surgical resection margin, and chemotherapy. With the data of patients with tumor recurrence, the conditional progression-free survival rate could be calculated and this rate would be more appro-priate to serve as a surrogate for the cure rate of the
patients with GB cancer [33].
Conclusions
The cancer-specific CS rate of patients with GB can-cer offers more accurate survival information compared with the CSS rate to patients who survived for a certain period. T and M categories were still significant prog-nostic factors even 5 years after diagnosis, whereas local treatments at the time of diagnosis were not, suggesting that further adjuvant treatments might be helpful for the patients with high T and M categories.
Authors’ contributions
KK conceived of the study, participated in its design and coordination, and revised the manuscript. YJK contributed to acquisition of data, statistical analy‑ ses, and writing. Both authors read and approved the final manuscript. Acknowledgements
None.
Competing interests
The authors declare that they have no competing interests. Availability of data and materials
The datasets generated and/or analyzed during the current study are available in the Surveillance, Epidemiology, and End Results Program repository, https:// seer.cancer.gov/seertrack/data/request/.
Consent for publication Not applicable.
Ethics approval and consent to participate
Analysis of this de‑identified dataset does not require Institutional Review Board approval.
Funding None.
Received: 5 April 2017 Accepted: 19 October 2017
References
1. Baillie J. Tumors of the gallbladder and bile ducts. J Clin Gastroenterol. 1999;29(1):14–21.
2. Piehler J, Crichlow RW. Primary carcinoma of the gallbladder. Surg Gynecol Obstet. 1978;147(6):929–42.
3. Cubertafond P, Gainant A, Cucchiaro G. Surgical treatment of 724 carcino‑ mas of the gallbladder. Results of the French Surgical Association Survey. Ann Surg. 1994;219(3):275–80.
4. Donohue JH, Nagorney DM, Grant CS, et al. Carcinoma of the gallbladder: does radical resection improve outcome? Arch Surg. 1990;125(2):237–41. 5. Wang SJ, Fuller CD, Kim J‑S, et al. Prediction model for estimating the
survival benefit of adjuvant radiotherapy for gallbladder cancer. J Clin Oncol. 2008;26(13):2112–7.
6. Kapoor VK, McMichael AJ. Gallbladder cancer: an ‘Indian’ disease. Natl Med J India. 2003;16(4):209–13.
7. Lazcano‑Ponce EC, Miquel J, Muñoz N, et al. Epidemiology and molecular pathology of gallbladder cancer. CA Cancer J Clin. 2001;51(6):349–64. 8. Todoroki T, Kawamoto T, Takahashi H, et al. Treatment of gallbladder
cancer by radical resection. Br J Surg. 1999;86(5):622–7. 9. Czito BG, Hurwitz HI, Clough RW, et al. Adjuvant external‑beam
radiotherapy with concurrent chemotherapy after resection of primary gallbladder carcinoma: a 23‑year experience. Int J Radiat Oncol Biol Phys. 2005;62(4):1030–4.
10. Gold DG, Miller RC, Haddock MG, et al. Adjuvant therapy for gallblad‑ der carcinoma: the Mayo clinic experience. Int J Radiat Oncol Biol Phys. 2009;75(1):150–5.
11. Bartlett DL, Fong Y, Fortner JG, et al. Long‑term results after resection for gallbladder cancer. Implications for staging and management. Ann Surg. 1996;224(5):639–46.
12. Zabor EC, Gonen M, Chapman PB, et al. Dynamic prognostication using conditional survival estimates. Cancer. 2013;119(20):3589–92. 13. Choi M, Fuller CD, Thomas CR, et al. Conditional survival in ovarian
cancer: results from the SEER dataset 1988–2001. Gynecol Oncol. 2008;109(2):203–9.
14. Chang GJ, Hu C‑Y, Eng C, et al. Practical application of a calculator for conditional survival in colon cancer. J Clin Oncol. 2009;27(35):5938–43. 15. Edge SB, Compton CC. The American Joint Committee on Cancer: the 7th
edition of the AJCC cancer staging manual and the future of TNM. Ann Surg Oncol. 2010;17(6):1471–4.
16. Cleves M. An introduction to survival analysis using stata. College Station: Stata Press; 2008.
17. Cefalu M. Pointwise confidence intervals for the covariate‑adjusted survivor function in the cox model. Stata J. 2011;11(1):64–81. 18. Lv JW, Huang XD, Chen YP, et al. A national study of survival trends
and conditional survival in nasopharyngeal carcinoma: analysis of the national population‑based Surveillance Epidemiology and End Results registry. Cancer Res Treat. 2017. doi:10.4143/crt.2016.544 [Epub ahead of print].
19. Dikken JL, Baser RE, Gonen M, et al. Conditional probability of survival nomogram for 1‑, 2‑, and 3‑year survivors after an R0 resection for gastric cancer. Ann Surg Oncol. 2013;20(5):1623–30.
20. Karakiewicz PI, Suardi N, Capitanio U, et al. Conditional survival predictions after nephrectomy for renal cell carcinoma. J Urol. 2009;182(6):2607–12.
21. Kang M, Kim HS, Jeong CW, et al. Conditional survival and associated prognostic factors in patients with upper tract urothelial carcinoma after radical nephroureterectomy: a retrospective study at a single institution. Cancer Res Treat. 2016;48(2):621–31.
22. Thuret R, Sun M, Abdollah F, et al. Conditional survival predic‑ tions after surgery for patients with penile carcinoma. Cancer. 2011;117(16):3723–30.
23. Spolverato G, Kim Y, Ejaz A, et al. Conditional probability of long‑term survival after liver resection for intrahepatic cholangiocarcinoma: a multi‑ institutional analysis of 535 patients. JAMA Surg. 2015;150(6):538–45. 24. Kim Y, Ejaz A, Spolverato G, et al. Conditional survival after surgical
resection of gastric cancer: a multi‑institutional analysis of the us gastric cancer collaborative. Ann Surg Oncol. 2015;22(2):557–64.
25. Shroff RT, Knox J, Dixon E. Consensus conference on gallbladder cancer. HPB. 2015;17(8):664–5.
26. Hueman MT, Vollmer CM Jr, Pawlik TM. Evolving treatment strategies for gallbladder cancer. Ann Surg Oncol. 2009;16(8):2101–15.
27. Pilgrim CHC, Groeschl RT, Quebbeman EJ, et al. Recent advances in systemic therapies and radiotherapy for gallbladder cancer. Surg Oncol. 2013;22(1):61–7.
28. Hyder O, Dodson RM, Sachs T, et al. Impact of adjuvant external beam radiotherapy on survival in surgically resected gallbladder adenocarci‑ noma: a propensity score—matched Surveillance, Epidemiology, and End Results analysis. Surgery. 2014;155(1):85–93.
29. Wang SJ, Lemieux A, Kalpathy‑Cramer J, et al. Nomogram for predicting the benefit of adjuvant chemoradiotherapy for resected gallbladder cancer. J Clin Oncol. 2011;29(35):4627–32.
• We accept pre-submission inquiries
• Our selector tool helps you to find the most relevant journal • We provide round the clock customer support
• Convenient online submission • Thorough peer review
• Inclusion in PubMed and all major indexing services • Maximum visibility for your research
Submit your manuscript at www.biomedcentral.com/submit
Submit your next manuscript to BioMed Central
and we will help you at every step:
30. Hawkins WG, DeMatteo RP, Jarnagin WR, et al. Jaundice predicts advanced disease and early mortality in patients with gallbladder cancer. Ann Surg Oncol. 2004;11(3):310–5.
31. Andrea C, Enzo A. Cholesterol gallstones larger than 3 cm appear to be associated with gallbladder cancer: identification of a high risk group of patients that could benefit from preventive cholecystectomy. Ann Surg. 2016;263(3):e56.
32. Hundal R, Shaffer EA. Gallbladder cancer: epidemiology and outcome. Clin Epidemiol. 2014;6:99–109.
33. Zamboni BA, Yothers G, Choi M, et al. Conditional survival and the choice of conditioning set for patients with colon cancer: an analysis of NSABP trials C‑03 through C‑07. J Clin Oncol. 2010;28(15):2544–8.