Original Article
Proteomic analyses of molecular factors associated
with obstructive megaureter dysfunction
Hyo Jin Kang1,2, Ji Hee Jun1, Sang Won Han1
1Department of Pediatric Urology, Severance Children’s Hospital, Urological Science Institute, Yonsei University
College of Medicine, Seoul, Korea; 2Medical Science Research Institute, Seoul National University Bundang
Hospi-tal, Seongnam, Korea
Received April 4, 2019; Accepted June 10, 2019; Epub September 15, 2019; Published September 30, 2019 Abstract: Objective: The underlying pathophysiology of obstructive and refluxing megaureters is poorly understood. The current study investigated the molecular mechanisms of ureter dysfunction, identifying proteins via proteomic analyses. Materials and methods: Megaureter and normal ureter tissues were used to examine differentially-ex-pressed proteins. Smooth muscle cells (SMCs) of obstructive megaureters were obtained from five patients that un-derwent open ureteroneocystostomy surgeries and five control patients with low-grade vesicoureteral reflux. SMCs were cultured in M199 medium supplemented with 10% fetal bovine serum and 1% antibiotics. Aiming to iden-tify differentially-expressed proteins, protein spots separated by 2D gel electrophoresis were matched. They were then analyzed using PDQuest software and nanoflow LC-ESI-MS-MS. Results: In the current study, α-tropomyosin, a protein associated with the contraction and migration of SMCs, was selected from several analyzed proteins, investigating its relationship with megaureters. When TPM1 was artificially overexpressed in normal ureter SMCs, a significant change in morphology was observed. In addition, the rate of apoptosis was increased in transfected SMCs, compared to that in control SMCs. Conclusion: Abnormal overexpression of TPM1 in ureter SMCs may induce defects in contractility and increase apoptosis rates. Empty spaces caused by apoptosis may then be preferentially filled with connective tissues, rather than slowly migrating SMCs. As a result, contractility is reduced, leading to the development of a dilated ureter.
Keywords: Obstructive megaureter, smooth muscle cell, tropomyosin 1 (TPM1), 2D electrophoresis, proteomics
Introduction
There are multiple classifications of megaure-ters, including primary or secondary, as well as obstructed, refluxing, obstructed and refluxing, and neither obstructing nor refluxing [1]. The current study focused only on cases of primary obstructing megaureters, which are typically detected as an abnormal narrowing at the vesi-courethral junction. This interrupts the normal rate of urine transport and causes functional obstruction [2, 3]. Several reasons for abnor-mal movement have been proposed, including increased collagen ratios, abnormal develop-ment of circular muscle fibers, and loss of mu- scle layers [4, 5]. However, the pathology of megaureters remains controversial.
Tropomyosins (TPMs) are α-helical coiled coil dimers that form continuous polymers along the major groove of actin filaments. The TPM
family of actin-binding proteins is essential for actin filament integrity. It consists of several isoforms that can be divided into three catego-ries, striated muscles, smooth muscles, and cytoplasmic [6]. In striated muscles, TPMs par-ticipate in muscle contraction by regulating the interaction between actin and myosin. TPM1 plays an important role in Ca2+-dependent
contractions. It can occupy three unique po- sitions on actin (“blocked” or calcium-free, “cl- osed” or calcium-induced, and “open” or myo-sin-induced), depending on the presence of cal-cium, myosin, and troponin [7]. In addition to motility, apoptosis is important for maintenance of regular function and activities of cells. Failure of this process can lead to several pathologies. Interactions between cells and the extracellular matrix regulate apoptosis through focal adhe-sions and integrins [8]. TPM1 can regulate the molecular composition of microfilaments. This, in turn, regulates dynamics, functional
proper-ties, and morphologies of the resulting actin filament population [9].
In this study, because biological processes are directly regulated by proteins, proteomic analy-ses were used to analyze differential gene ex- pression at the protein level, comparing the two-dimensional (2D) electrophoresis patterns of proteomes in control and megaureter smooth muscle cells (SMCs) [10].
Materials and methods
Megaureter SMC isolation, primary culturing, and identification
Megaureter SMCs were obtained from five patients with obstructive megaureters (age range: 8-20 months) that underwent open ure-teroneocystostomy surgeries and five controls (age range: 12-38 months) with low-grade vesi-coureteral reflux that did not exhibit ureter dila-tion. After being excised, the tissues were placed in 0.1% collagenase IV (Washington Biochemical Co., Lakewood, NJ, USA) and incu-bated at 37°C in a humidified atmosphere with 5% CO2 for 1 hour. Collagenase IV was neutral-ized with culture media and separated by cen-trifugation. Supernatants then were passed through a 100 µm cell strainer (BD Bioscience, Bedford, MA) before plating. Pellets were wa- shed in phosphate-buffered saline and seeded in M199 media (Sigma-Aldrich, St. Louis, MO, USA) with 10% fetal bovine serum (Gibco, Carlsbad, CA, USA), 100 U/mL penicillin, and 100 μg/mL streptomycin at 37°C in a humidi-fied 5% CO2 incubator. Confirming the identity of SMCs, ureter SMCs were fixed in 4% formal-dehyde, permeabilized with 0.2% Triton X-100, and stained with α-SMA antibodies (1:200, Abcam, Cambridge, UK). All stained samples were imaged using an Olympus fluorescence inverted microscope (100 × magnification). 2D electrophoresis and spot image analyses SMCs were dissolved in lysis buffer and se- parated by immobilized pH gradient (IPG) iso-electric focusing (IEF) using a Protean IEF cell (Bio-Rad, Hercules, CA, USA). The first dimen-sion IEF was followed by a series of steps, including 12 hours of rehydration, 15 min/250 V, 500 V·h/500 V, 1,000 V·h/1,000 V, 10,000 V·h/4,000 V, and 40,000 V·h/10,000 V. After first-dimensional separation, IPG gels were
incubated in equilibration buffer I with 1% di- thiothreitol for 30 minutes. They were then added with equilibration buffer II with 2.5% iodoacetamide for 30 minutes. Equilibrated IPG gels were separated on 10% SDS-polya- crylamide gels. Proteins were visualized by Co- omassie blue staining. This allowed for direct correlation of the intensity of the protein spot with the quantity of protein present.
Gels were scanned using a GS-800 Calibrated Densitometer (Bio-Rad) and matched to ana-lyze differentially-expressed spots using PDQ- uest software version 8.0.1 (Bio-Rad). Each matched protein spot was assigned a unique sample spot protein number in the PDQuest software. Matched spots were compared by Student’s t-tests, with a 95% significance le- vel. A minimum 10.0-fold change was consid-ered for upregulated proteins, while a 0.1-fold change was considered for downregulated pr- oteins.
Nanoflow LC-ESI-MS-MS analyses
Nanoflow LC-ESI-MS-MS experiments were car-ried out using a CapLC equipped with a Q-TOF Ultima mass spectrometer (Waters, Milford, MA, USA). It used a custom-made pulled tip capillary column (75 µm i.d., 360 µm o.d., 15 cm). For each sample, 5.0 µL of the digested peptide mixture was injected via an autosam-pler connected to the trapping column. The flow rate during gradient separation remained at 200 nL/min and eluted peptides were directly electro-sprayed into the mass spectrometer with a spray voltage of 2.4 kV in the positive ion mode. Peptide ions were detected in the data-dependent analyses mode with an MS precur-sor scan (300-1700 amu). This was followed by three data-dependent MS-MS scans. For data analyses, collected raw MS/MS spectra were analyzed with the Mascot search program using NCBI databases. The accepted mass tol-erance used was 100 ppm for both molar masses of the precursor peptide and peptide fragment ions. For analyses of search data, only peptides yielding Mascot ion scores > 49 indicating extensive homology were accepted. Western blotting
Western blotting was performed with mouse anti-human tropomyosin 1 (1:500, Santa Cruz, Dallas, TX, USA), mouse anti-human α-smooth
muscle actin (1:500, α-SMA, Abcam), and mo- use anti-human Tm311 (1:500, Santa Cruz). Proteins were mixed with 5X sample buffer, heated at 95°C for 10 minutes, and separated on 10% SDS-polyacrylamide gels. Proteins were transferred onto membranes with the transfer buffer, then blocked in 5% skim milk. Membranes were incubated at 4°C overnight with specific antibodies, then incubated with horseradish peroxidase-conjugated anti-mou- se IgG or anti-rabbit IgG (1:2000). After the membranes were washed, they were develo- ped using the West-Q Chemiluminescent Su- bstrate Kit Plus (GenDEPOT Inc., Barker, TX, USA). Intensities of the proteins were analyzed via Multi Gauge software (version 3.0, Fuji Photo Film, Tokyo, Japan).
TPM1 transfection
TPM1 plasmid DNA (OriGene Technologies Inc., Rockville, MD, USA) and Lipofectamine LTX (Invitrogen, Carlsbad, CA, USA) were used for transfection. One day before transfection, 1 × 10⁵ SMC cells were plated in 6-well plates with
M199 media. They were then incubated until reaching 50-60% confluence. Transfection was performed in accordance with reagent manu-facturer instructions.
Reverse transcription-polymerase chain reac-tion (RT-PCR)
Total RNA was isolated with TRIzol Reagent (Invitrogen), then treated with DNase I. The RNA mixture was incubated at 95°C for 15 minutes before the first cycle and extended at 72°C for 10 minutes after all cycles were completed. A total of 30 cycles of amplification were per-formed. TPM1 primer sequences were as fol-lows: Forward: 5’-CTCGCAGAAGGAAGACAGA-3’ and reverse: 5’-ATTGGCACTTTGAATGGAAC-3.’ The GAPDH control primer pair was obtained from BioSource International (Carlsbad, CA, USA). PCR products were separated by size on a 1% agarose gel in Tris-borate EDTA bu- ffer. Band intensities were quantified using a densitometric scanner. Relative densities are expressed as ratios of control values.
Flow cytometry
SMCs (1 × 10⁵ cells) were seeded in 6-well
plates and incubated in serum-free Opti-MEM for 24 hours before transfection. After transfec-tion, SMC apoptosis was detected using the
AnnexinV-FITC/PI apoptosis detection kit (BD Biosciences Pharmingen, San Diego, CA, USA), in accordance with manufacturer protocol. Briefly, SMCs were washed and resuspended in binding buffer and 5 µL fluorochrome-conjugat-ed Annexin V was addfluorochrome-conjugat-ed to the 100 µL cell sus-pension. The SMC suspension was incubated for 15 minutes at room temperature in the dark. SMCs were washed and 5 µL propidium iodide staining solution was added to the cell suspension. The SMC suspension was incubat-ed for 15 minutes at room temperature in the dark, then washed. The percentage of cell apoptosis was determined by flow cytometry using a BD LSRII flow cytometer (BD Bi- osciences, San Jose, CA, USA). All tests were performed in triplicate and repeated at least three times.
Masson’s trichrome staining
Distributions of collagen and smooth muscles were assessed by staining with the Sigma-Aldrich HT15 kit (Sigma-Sigma-Aldrich), in accordance with manufacturer protocol. All stained sam-ples were captured using an Olympus fluores-cence inverted microscope (200 × magnifica- tion).
Statistical analyses
Quantitative data are expressed as means ± standard deviation. Data were analyzed using Student’s t-tests and correlation coefficients. P-values less than 0.05 indicate statistical significance. All statistical analyses were per-formed using Prism 5.01 for Windows (Gr- aphPad Software, San Diego, CA, USA).
Results
Differential expression of collagen in megaure-ter
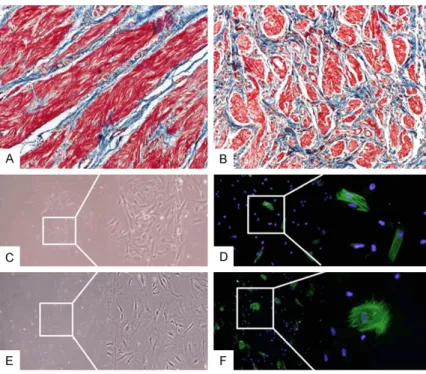
Masson’s trichrome staining was performed to investigate smooth muscle to collagen ra- tios. Expression of collagen was significantly increased in control ureters, while smooth mu- scle was visibly decreased in megaureters (Figure 1A, 1B).
Differential morphology of megaureter and control SMCs
Primary cultured SMCs were stained with α-smooth muscle actin, comparing
morpholo-gies between megaureter and control cells. In the control group, SMCs showed spindle-like and tapering shapes, while megaureter SMCs exhibited a complicated pattern of filaments extending outward on all sides (Figure 1C-F). Two-dimensional gel electrophoresis and analyses of nanoflow LC-ESI-MS-MS
Image analyses and quantification of 2D gel electrophoresis were performed with PDQuest software, version 8.0.1. Analyses of protein spots revealed more than 100 protein spots between megaureter and control ureters (Fig- ure 2A, 2B). Twelve protein spots showed sta-tistically significant differential expression be- tween megaureter and control ureters. Four spots showed overexpression and eight spots showed under-expression in megaureters. Dif- ferentially-expressed protein spots were identi-fied through nanoflow LC-ESI-MS-MS and data-base searches. Typtophanyl-tRNA synthetase, Annexin A2, and ATP synthase subunit beta
sistent with LC-ESI-MS-MS data (Table 1, Figure 2).
Artificial overexpression of TPM1 protein levels in control SMCs
RT-PCR analyses were performed to confirm increased mRNA expression levels of TPM1 in transfected SMCs. Quantification of PCR bands in stained agarose gels by scanning densitom-etry indicated that relative expression levels of TPM1 in transfected SMCs were significantly higher than those in control SMCs (Figure 3A). Figure 3B shows the graphic analyses of aver-aged data.
Apoptosis in megaureters, transfected, and control SMCs
Cell apoptosis was detected using flow cytom-etry. FACS was performed immediately after transfection. The proportion of cells in early or late apoptosis was 44.39% in the TPM1 overex-pression group. Lower proportions of apoptotic
Figure 1. Fibrosis of megaureter tissues and α-smooth muscle actin staining of primary cultured SMCs. Ureter slide sections were stained with Masson’s trichrome. Collagen is stained blue and muscle is stained red; (A) Control ureters show a normal smooth muscle layer; (B) The density of smooth mus-cle in megaureter was remarkably lower than that in control ureters. Primary cultured SMCs were stained with α-smooth muscle actin (green) and DAPI (blue); (C) SMCs of control ureter showed spindle-like and tapering shapes and (D) SMC actin was typical shape. (E) Megaureter SMCs appeared as spread shape cells and (F) a complicated pattern of filaments stretched out on all sides. Microphotographs were taken at 200 × magnification.
showed lower expression in megaureters than in control ureters. Conversely, TPM1 and smooth muscle proteins sh- owed higher expression in megaureters (Table 1). Some protein spots were unknown or unnamed proteins and cou- ld not be identified because of low abundance. TPM1 was one of the proteins selected for functional investigations of ureters.
Comparison of TPM1 and smooth muscle protein ex-pression between megaureter and control ureters
Expression levels of TPM1 and smooth muscle proteins were significantly increased in 2D gels. Confirming protein expression levels, Western blotting was performed with antibodies against TPM1 and smooth muscle actin. TPM1 and SM actin both showed higher expression levels in megaureters than in control ureters (Figure 2C, 2D),
con-cells were observed in megaureter (27.4%) and control groups (10.7%), respectively. After 48 hours, nearly 70% of SMCs in the transfected group died. In contrast, a relatively high propor-tion of SMCs survived in the control group (Figure 3C, 3D).
Immunocytochemistry of TPM1 in control ure-ters and megaureure-ters
Control SMCs showed relatively weak expres-sion of TPM1 and filaments with regular stria-tions (Figure 3E). Shapes of SMCs and
expres-Figure 2. 2D analyses and TPM1 expression in primary cultured SMCs of megaureter and control ureters. Quanti-fied proteins from SMCs were iso-electrically focused with an immobilized linear pH gradient and separated by 10% SDS-PAGE. Proteins were visualized by Coomassie blue staining; (A) Proteins in white boxes showed statistically significant differences in PDQuest analyses; (B) TPM1 and SM protein spots were expressed more strongly in mega-ureter SMCs than in control SMCs; (C) To confirm TPM1 and SM actin expression, Western blotting analyses were performed using proteins from both control and megaureter SMCs. TPM1 and SM actin were increased in megaure-ter SMCs, compared to control SMCs; Wesmegaure-tern blot gels were scanned with a densitomemegaure-ter to demegaure-termine the areas under the bands. (D) TPM1 and (E) SM actin were significantly expressed in megaureter SMCs compared with the control group (*P-value < 0.05).
Figure 3. TPM1 expression and apoptosis analyses after TPM1 transfection. (A) TPM1 mRNA expression was greater in transfected SMCs than in control SMCs; (B) Expression of TPM1 protein was quantified by densitometric scan-ning of gels. Representative FACS data and bar graph summarizing the FACS results are shown; (C) The apoptosis rate was higher in the TPM1 overexpression and megaureter groups, compared to controls; (D) Bars represent the proportions of apoptotic cells in each group. Immunocytochemistry analyses show TPM1 expression (E) in normal SMCs, (F) in megaureter SMCs, and (G) in transfected SMCs. White arrows indicate focal adhesions. Microphoto-graphs were taken at 100 × magnification.
Table 1. Differentially-expressed protein spots between megaureter and control SMCs by nanoflow LC-ESI-MS-MS
Spot no. Protein ID Accession no. Score MW (kD)/PI Sequence coverage (%)
Under-expression
1 Melanoma antigen P78395 227 55.8/6.44 32
2 ATP synthase subunit beta, mitochondrial P06576 248 56.5/5.26 20
3 Heterogeneous nuclear ribonucleoprotein C1/C2 P07910 66 33.6/4.95 5
4 Tryptophanyl-tRNA synthase, cytoplasmic P23381 276 53.1/5.83 20
5 Annexin A2 P07355 356 38.5/7.57 70
6 Guanine nucleotide-binding protein subunit beta-2 like P63244 142 35.0/7.60 37
7 Uncharacterized protein C15orf33 Q96M60 19 59.9/9.00 0
8 Unnamed protein gi|35844 80 49.8/4.66 8
Overexpression
9 Tropomyosin alpha-1 chain gi|63252896 78 32.7/4.71 16
10 Nephronectin Q6UXI9 38 61.8/8.74 0
11 Transitional endoplasmic reticulum ATPase P55072 174 89.2/5.14 10
sion levels of TPM1 differed in megaureters, compared to controls (Figure 3F). In megaure-ter SMCs, many brightly stained cells showed transformed shapes. Transfected SMCs show- ed the greatest increase in TPM1 expression levels. In particular, there were notable projec-tions of focal adhesions (Figure 3G).
Discussion
Ureteral distension and diameter are essential for maintenance of intraluminal pressure. Intraluminal pressure decreases with greater ureteral diameter. Excess collagen deposition has been presumed to play an important role in enlargement of the ureter [4, 11]. Increased collagen alters cell-to-cell junctions, thereby influencing myoelectrical propagation and peri-stalsis [4, 11]. Kajbafzadeh et al. demonstrated decreased muscular and increased collagen components, as well as an increased SMC apoptosis index, at the site of ureteropelvic junction obstruction [12]. However, Lee et al. reported no statistically significant differences in the proportion of collagen between megaure-ters and control uremegaure-ters or in the ratio of colla-gen to muscle among subtypes of megaureter [13]. Thus, the current study attempted to iden-tify the cause of megaureters, employing a pro-teomics approach. Proteomic methods using 2D and Nanoflow LC-ESI-MS-MS can analyze differential gene expression at the protein level, comparing the 2D patterns of proteins in con-trol and megaureter SMCs. In analyses of protein spots, the current study found 20 pro-tein spots that were differentially-expressed between megaureters and control ureters. TPM1, transitional endoplasmic reticulum ATPase, and smooth muscle proteins were sig-nificantly increased in megaureters, while mel-anoma antigen, mitochondrial ATP synthase subunit beta, cytoplasmic tryptophanyl-tRNA synthase, and annexin A2 were significantly decreased.
TPM1 is an actin binding protein that regulates cell motility and contractility. TPM1 makes actin filament compliant, which is associated with a two- to three-fold increase in the Vmax of the actin-activated ATPase activity of smooth mus-cle myosin. Mannikarottu et al. found that fi- lament-associated proteins, including TPM1, enhance detrusor smooth muscle hypertrophy induced by partial bladder outlet obstruction [14]. Levels of thin filament-associated proteins (e.g., calponin, TPM, and caldesmon) are also
contractile properties of actin stress fibers may determine the structure of associated focal adhesions [16]. Creed et al. reported that TPM1 induces increased filopodia and generates a functionally distinct filament population [17]. Thus, the current study investigated TPM1 function using TPM1 plasmid DNA in control SMCs.
After TPM1 transfection, SMCs exhibited dis-tinct morphological features. The edges of the SMCs (i.e., focal adhesions) were particularly more developed in TPM1 overexpressing cells. Furthermore, the expression rate of TPM1 was significantly reinforced in megaureter and transfected SMCs. The loss of actin stress fibers was related to cell transformation and metastasis. TPM1 stabilizes focal adhesions and inhibits cell migration. Raval et al. revealed that overexpression of high-molecular-weight TPM in transformed or tumor cells suppresses anchorage-independent cell growth, leading to anoikis [18]. The existence of anoikis is regu-lated by various factors, including integration signaling, focal adhesions, and cell-cell interac-tions [19]. In the present study, the rate of apoptosis was markedly increased in transfect-ed and megaureter SMCs, compartransfect-ed to control SMCs. The proportion of apoptotic cells was nearly 50% in transfected SMCs, while the pro-portions were 27.4% and 10.7% in megaureter and control groups, respectively. Apoptosis of SMCs promotes tissue remodeling and repair via activation of cell migration, proliferation, and collagen synthesis [20]. Payabvash et al. discovered that muscular contents were re- duced in obstructed vesicoureteral junctions, suggesting that the substitution of connective tissue may lead to functional obstructions in primary obstructive megaureters [21].
The present study compared expression levels of proteins in megaureter and control ureter SMCs via proteomic analyses. Although cur- rent results are unable to explain the underly-ing gene regulation pathways, they show that TPM1, a protein statistically overexpressed in megaureter SMCs, is a significant contributing factor in the development of obstructive me- gaureters.
Conclusion
TPM1 was overexpressed in megaureter SMCs, compared to control ureter SMCs. As previously shown, increased expression of TPM1 alters
adhesions. These changes may interrupt cell-cell and cell-cell-matrix signal pathways, inducing anoikis of SMCs. Because of reduced migration of SMCs, the empty spaces left by dead cells are filled with connective tissue rather than myocytes. This may lead to the development of obstructive megaureters.
Disclosure of conflict of interest None.
Address correspondence to: Dr. Sang Won Han, Department of Urology, Urological Science Institute, Yonsei University College of Medicine, 134 Shinchon-Dong, Seodaemoon-Gu, Seoul 120-752, Korea. Tel: +82-2-2228-2310; Fax: +82-2-312-2538; E-mail: [email protected]
References
[1] Zhong W, Yao L, Cui H, Yang K, Wang G, Xu T, Ye X, Li X and Zhou L. Laparoscopic ureteral reim-plantation with extracorporeal tailoring and di-rect nipple ureteroneocystostomy for adult ob-structive megaureter: long-term outcomes and comparison to open procedure. Int Urol Nephrol 2017; 49: 1973-1978.
[2] Choi YH, Cheon JE, Kim WS and Kim IO. Ultra-sonography of hydronephrosis in the newborn: a practical review. Ultrasonography 2016; 35: 198-211.
[3] Tenkorang S, Omana JP, Mellas S, Tazi FM, El Ammari JE, Khallouk A, El Fassi MJ and Farih MH. Urolithiasis secondary to primary obstruc-tive megaureter in an adult: a case report. J Med Case Rep 2017; 11: 177.
[4] Kang HJ, Lee HY, Jin MH, Jeong HJ and Han SW. Decreased interstitial cells of cajal-like cells, possible cause of congenital refluxing megaureters: histopathologic differences in re-fluxing and obstructive megaureters. Urology 2009; 74: 318-323.
[5] Winder SJ and Ayscough KR. Actin-binding pro-teins. J Cell Sci 2005; 118: 651-654.
[6] Gunning PW and Hardeman EC. Tropomyosins. Curr Biol 2017; 27: R8-R13.
[7] Squire JM, Paul DM and Morris EP. Myosin and actin filaments in muscle: structures and inter-actions. Subcell Biochem 2017; 82: 319-371. [8] Wen LP, Fahrni JA, Troie S, Guan JL, Orth K and
Rosen GD. Cleavage of focal adhesion kinase by caspases during apoptosis. J Biol Chem 1997; 272: 26056-26061.
[9] Janco M, Bonello TT, Byun A, Coster AC, Lebhar H, Dedova I, Gunning PW and Bocking T. The impact of tropomyosins on actin filament as-sembly is isoform specific. Bioarchitecture 2016; 6: 61-75.
[10] Hanash S. Disease proteomics. Nature 2003; 422: 226-232.
[11] Kart Y, Karakus OZ, Ates O, Hakguder G, Ol-guner M and Akgur FM. Altered expression of interstitial cells of Cajal in primary obstructive megaureter. J Pediatr Urol 2013; 9: 1028-1031.
[12] Kajbafzadeh AM, Payabvash S, Salmasi AH, Monajemzadeh M and Tavangar SM. Smooth muscle cell apoptosis and defective neural de-velopment in congenital ureteropelvic junction obstruction. J Urol 2006; 176: 718-723. [13] Lee BR, Silver RI, Partin AW, Epstein JI and
Gearhart JP. A quantitative histologic analysis of collagen subtypes: the primary obstructed and refluxing megaureter of childhood. Urology 1998; 51: 820-823.
[14] Mannikarottu AS, Disanto ME, Zderic SA, Wein AJ and Chacko S. Altered expression of thin fil-ament-associated proteins in hypertrophied urinary bladder smooth muscle. Neurourol Urodyn 2006; 25: 78-88.
[15] Mannikarottu AS, Changolkar AK, Disanto ME, Wein AJ and Chacko S. Over expression of smooth muscle thin filament associated pro-teins in the bladder wall of diabetics. J Urol 2005; 174: 360-364.
[16] O’Neill GM. The coordination between actin fil-aments and adhesion in mesenchymal migra-tion. Cell Adh Migr 2009; 3: 355-357.
[17] Creed SJ, Desouza M, Bamburg JR, Gunning P and Stehn J. Tropomyosin isoform 3 promotes the formation of filopodia by regulating the re-cruitment of actin-binding proteins to actin fila-ments. Exp Cell Res 2011; 317: 249-261. [18] Zheng Q, Safina A and Bakin AV. Role of
high-molecular weight tropomyosins in TGF-beta-mediated control of cell motility. Int J Cancer 2008; 122: 78-90.
[19] Zhong X and Rescorla FJ. Cell surface adhe-sion molecules and adheadhe-sion-initiated signal-ing: understanding of anoikis resistance mech-anisms and therapeutic opportunities. Cell Signal 2012; 24: 393-401.
[20] Yu H, Clarke MC, Figg N, Littlewood TD and Bennett MR. Smooth muscle cell apoptosis promotes vessel remodeling and repair via ac-tivation of cell migration, proliferation, and col-lagen synthesis. Arterioscler Thromb Vasc Biol 2011; 31: 2402-9.
[21] Payabvash S, Kajbafzadeh AM, Tavangar SM, Monajemzadeh M and Sadeghi Z. Myocyte apoptosis in primary obstructive megaureters: the role of decreased vascular and neural sup-ply. J Urol 2007; 178: 259-264.