© Korean Powder Metallurgy Institute 1054 -1. Introduction
Tungsten-copper composites are used in the electrical and electronic fields such as heavy-duty electrical contacts, high-current circuit breakers, resistance welding electrodes and contact tips of arc welding guns [1-5]. Pure tungsten fractures completely in a brittle manner at room temperature but W-19vol%Cu composite demonstrates a certain amount of plastic strain before fracture [6]. This result was explained by both higher maximum strength and lower yield strength compared with recrystallized pure tungsten.
In this study, W-22vol%Ag and W-19vol%(BAg-8) composites were prepared by an infiltrating method and their mechanical properties were examined and compared with those of W-19vol%Cu composite. Silver (Ag) has thermal and electrical conductivities as high as copper (Cu) and shows a better oxidation resistance than copper. However, wetting between silver and tungsten is worse than that between copper and tungsten. On the other hand, BAg-8 (72wt%Ag-28wt%Cu) is one of commercial Ag-Cu alloys and has a better wetability to tungsten than silver. First, microstructure of the composite was observed using a scanning electron microscope (SEM). Then, yield and/or maximum strengths and ductility were evaluated using a three-point bend testing at temperatures between 77 and 473 K. Fracture surfaces were examined using SEM. In these ways, strengths and ductility of the composite were discussed in terms of microstructure and fractography.
2. Experimental
W-19vol%Cu, W-22vol%Ag and W-19vol%(BAg-8) composites were prepared by infiltrating tungsten powder skeleton with alternatively copper, silver or BAg-8, respectively. These composites were designated as W-Cu, W-Ag and W-(BAg-8) in this text. Rectangular specimens of 4 mm wide, 25 mm long and about 1.5 mm thick were cut out from these composites. Surfaces of the specimens were polished using emery papers (#180-#600) and buff clothes.
Microstructure of the composite was observed using SEM. Distribution of Cu-phases, Ag-phases or (BAg-8)-phases in the matrix of W-phases and pores were examined.
Three-point bend testing was carried out at temperatures between 77 and 473 K with a crosshead speed of 0.011 mm/s. From the load-displacement curve, yield (σy) and maximum (σm) strengths were calculated using the following equation.
σy(m)=3aPy(m)/wt2 (1)
2a (=16 mm) is the span of supporting pins. Py (N) and Pm (N) are the load at the yield point and the maximum point, respectively. w (mm) and t (mm) are the specimen width and thickness, respectively. Ductility of the composite was represented by DBTT [7]. Lastly, fracture surface of the composite was observed using SEM and fracture mode was examined.
2006 POWDER METALLURGY World Congress
PC03-W-03
Mechanical Properties of W-X (X=Cu, Ag or BAg-8) Composites
H.Hanado1,a, Y.Hiraoka2,b , T.Inoue1,c, and N.Akiyoshi3,d1
Graduate student, Okayama University of Science, 1-1 Ridai-cho, Okayama 700-0005, Japan 2
Okayama University of Science, 1-1 Ridai-cho, Okayama 700-0005, Japan 3
R&D Division, Toho Kinzoku Co., Ltd., 26-5 Ikeda-nishi-machi, Neyagawa, Japan a
[email protected] ac.jp, [email protected] ac.jp, [email protected] ac.jp, d
[email protected] Abstract
Bend tests were performed at temperatures between 77 and 473K for W-19vol%Cu, W-22vol%Ag and W-19vol%(BAg-8) composites. Yield and maximum strengths and ductility of the composite were discussed in terms of microstructure and fractography. Results are summarized as follows. (1) Almost no difference was recognized in yield strength between the composites. In contrast, a large difference was recognized in maximum strength and ductility between the composites. (2) Inferior mechanical properties of W-Ag composite to W-Cu composite are attributed to heterogeneous distribution of Ag-phases, whilst inferior mechanical properties of W-(BAg-8) composite to W-Cu composite are attributed to large pores at grain boundaries.
© Korean Powder Metallurgy Institute 1055
-3. Results 3-1 Microstructure
Typical SEM micrograph of W-Ag is shown in Fig.1. Microstructure of W-Ag was apparently similar to that of W-Cu [6]. Ag-phases were isolated in the matrix of W-phases. Such a microstructure suggests that W-W contiguity is primary and Ag-phases might construct a three-dimensional network. On the other hand, area fraction of (BAg-8)-phases in W-(BAg-8) was smaller than that of Cu-phases in W-Cu. In addition, a number of large pores were observed.
Fig. 1. Micrograph of W-Ag. 3-2 Strengths and Ductility
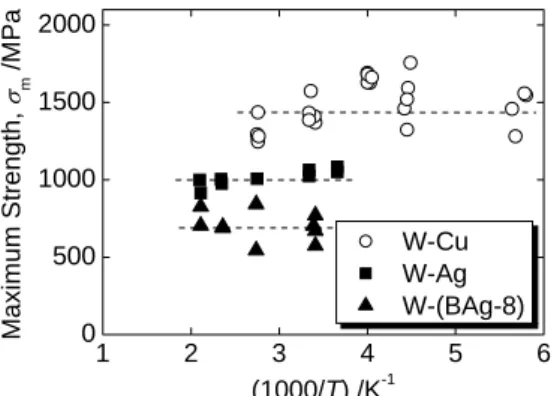
Almost no difference was recognized in yield strength between W-Ag and W-Cu. W-(BAg-8) fractured without plastic deformation and hence the yield strength was not obtainable. Maximum strength of the composite is plotted against reciprocal of test temperature in Fig.2. A large difference was recognized in maximum strength between the composites. Hiraoka et al. [6] report that maximum strength of W-Cu at room temperature is higher than that of recrystallized pure tungsten. On the other hand, maximum strength of W-Ag was almost equal to pure tungsten and maximum strength of W-(BAg-8) was lower than that of recrystallized pure tungsten.
DBTT of W-Ag (357 K) and W-(BAg-8) (500 K) were higher than W-Cu (250 K). Here DBTT of W-(BAg-8) was not obtained experimentally and hence was estimated assuming that yield strength was equivalent.
Fig. 2. Maximum strength vs. reciprocal of temperature.
3-3 Fractography
Typical SEM fractograph of W-Ag is shown in Fig.3. Fracture mode of W-Ag was apparently similar to that of W-Cu. Both intergranular and transgranular fracture surfaces of W-phases as well as deformed Ag-phases surrounding W-phases were observed. Only difference is that distribution of Ag-phases was more heterogeneous. On the other hand, in W-(BAg-8), intergranular fracture surface was predominant and a number of large pores were observed.
Fig. 3. Fractograph of W-Ag. 4. Summary
(1) Almost no difference was recognized in yield strength between W-Cu and W-Ag.
(2) A large difference was recognized in maximum strength between the composites. Maximum strengths of W-Ag and W-(BAg-8) were generally lower than that of W-Cu.
(3) Inferior mechanical properties of W-Ag to W-Cu are attributed to heterogeneous distribution of Ag-phases in the matrix of W-phases. On the other hand, inferior mechanical properties of W-(BAg-8) to W-Cu are attributed to large pores at grain boundaries.
5. References
1. K.VSebastian: Int. J. Powd. Metall. & Powd. Tech. Vol.17 (1981), p.279
2. M.-H.Hong et al: Proc. of the 13th Int. Plansee Sem., Plansee AG, Reutte-in-Tirol, (1993), p.45
3. K.Wojtasik and S.Stolarz: Proc. of the 13th Int. Plansee Sem., Plansee AG, Reutte-in-Tirol, (1993), p.471
4. I.-H.Moon, S.-S.Ryu and J.-M.Kim: Proc. of the 14th Int. Plansee Sem., Plansee AG, Reutte-in-Tirol, (1997), p.16 5. W.S.Wang and K.S.Kwang, Metall. Trans. A, Vol.29A
(1998), p.1509
6. Y.Hiraoka et al.: Mater. Trans., Vol.46, (2005), p.1664 7. Y.Hiraoka, S.Yoshimura and K.Takebe: Int. J. Refr. Met.
& Hard Mater., Vol.12 (1993-1994), p.261
8. Y.Hiraoka and H.Kurishita: unpublished work (2005)
1 2 3 4 5 6 0 500 1000 1500 2000 Ma xi m u m S tre ngth , σm /M Pa (1000/T) /K-1 W-Cu W-Ag W-(BAg-8)