This study explores to what extent health behaviors are linked the incidence of chronic diseases by following a cohort of respondents who initially report no chronic disease of any sort using the data from the American Changing Lives survey. Health behaviors are operationalized as four variables: physical activity, smoking, drinking, and body mass index. Initially, we investigated whether there are differences in health behaviors by gender, race, education level and marital status. Multinomial logistic regression models were estimated to explore the association between health behaviors and the emergence of chronic diseases. We found that women, African Americans, lower educated persons, and the unmarried are at higher risk of chronic diseases. Also, health behaviors are associated with chronic diseases. These associations appeared in different and interesting ways when we compared the seriousness(or lethality) of chronic diseases.
Key words: health behavior, chronic disease, longitudinal analysis
HEALTH BEHAVIOR AND CHRONIC
DISEASE: A LONGITUDINAL ANALYSIS OF
A HEALTHY POPULATION
Hyeyoung Woo*, W. Parker Frisbie**
** Department of Sociology & Population Research Center University of Texas at Austin ** Department of Sociology & Population Research Center University of Texas at Austin
Ⅰ
Ⅰ. INTRODUCTION
A large body of research attempted to explain variation in health in terms of sociodemographic variables as well as individuals’ behaviors. With respect to sociodemographic variables, it is well documented that male, high educated and married tend to enjoy better health than female, low educated and non-married, respectively. It is also known that health behaviors(i.e. smoking, drinking, physical activity and eating behaviors) are associated with prevalence of health problems. Although previous research made a substantial contributions to disentangle individual’s health conditions using social variables rather than genetic attributes, few studies, however, looked at an individual’s health as a result of the cumulative effects of social factors(i.e. such as educational attainment) and little is known about whether or not the effects vary by seriousness of chronic health conditions.
The study explores the cumulative effects of health behaviors on risk of health problems using a longitudinal research design. Considering that the cumulative effects seem likely to manifest chronic symptoms rather than infectious diseases or disability, the analytic focus is on chronic diseases. Healthy life styles are encouraged as a way of avoiding chronic diseases, but there are relatively few related studies that show the impact of health behaviors on risk of chronic diseases, especially compared to the studies that address the association of social factors(i.e. educational 70 保健社會硏究 第26卷 第2號
attainment or marital status) and various health outcomes. Research that explores differentials in relationships for both less serious chronic ailments and more lethal chronic conditions is even more sparse. We believe especially valuable insights may be gained by following overtime a group of adults who are initially free of chronic ailments.
Ⅱ
Ⅱ. HEALTH BEHAVIOR & CHRONIC
DISEASE
In many cases, the causes of chronic diseases are not well established. Previous studies suggest that factors such as socioeconomic status, physical environment, and genetic characteristics affect risk of disease, as exogenous factors. Health care by institutions and individual response are believed to mediate the associations(Corin. 1994; Evens and Stoddart. 1994). Individual responses can be divided into two components. One is related to health behaviors, the other is a biological.
Many studies have focused on the relationship between social variables and health. Generally, men, persons who are married, whites, and the highly educated are healthier compared to females and those who are unmarried, black and less educated. According to Mirowsky and Ross(2003), among these variables, only education correlates positively and consistently with healthy behaviors. However, there are few studies that show a clear picture of the association of health(or illness) in the context of health behaviors
using nationally representative and longitudinal data sets. Chronic diseases are expected to be affected by health behaviors gradually through time. Therefore, longitudinal data sets will facilitate a better understanding of the association of health behaviors and chronic diseases. As already noted, the factors that affect the risk of chronic diseases are numerous, and are never available in their entirety in any known data sets. In this study, research interest is limited to social variables that affect health behaviors.
Ⅲ
Ⅲ. RESEARCH DESIGN
1. RESEARCH QUESTIONS
This study focuses on two substantive issues. The first question is, how are social factors related to an individual’s health-related behaviors? To address this question, the relationship of individuals’ health behaviors with education level is investigated as well as sociodemographic variables such as gender, race and marital status. We use t-tests to determine whether health behaviors vary significantly by sociodemographic characteristics. Secondly, what are the effects of health behaviors on risk of chronic disease? And how do the effects vary by seriousness of the chronic conditions? These relationships are investigated with multinomial logistic regression models.
Although there are no measures of motivations or attitudes in our data, it is assumed that avoidance of smoking, moderation in the 72 保健社會硏究 第26卷 第2號
consumption of alcohol, a regimen of appropriate physical activity and maintenance of a healthy body mass index are based on the motivation to achieve a healthy life style. One can certainly assume that persons who smoke, abuse alcohol, lead sedentary life styles and/or have unhealthy diets are not forced into these unhealthy behaviors. Thus, almost by definition, avoidance of such unhealthy activities and engaging in healthy behaviors imply higher level of cognition, which is based on social factors, although the exact source of motivation may not appear in the present analysis.
2. DATA AND METHODS
The data are from three-wave panel “Americans’ Changing
Lives”(ACL) survey1)
. The survey was designed to investigate a wide range of activities and social relationships of American adults using a nationally representative probability sample. Surveys were conducted in 1986, 1989, and 1994. Wave Ⅰ interviewed 3,617 persons ages 25 and older. The attrition rates are 21% from Wave Ⅰ to Wave Ⅱ, and 29% from Wave Ⅰ to Wave Ⅲ. That is, the numbers of respondents are 2,867 and 2,562 in Wave Ⅱ and Ⅲ, respectively. To test whether the drop-out cases cause nonrandom sampling bias errors, we performed auxiliary analyses. The results
suggest that our empirical estimates are not significantly affected.2)
HEALTH BEHAVIOR AND CHRONIC DISEASE: A LONGITUDINAL ANALYSIS OF A HEALTHY POPULATION73
1) House, James S. AMERICANS’CHANGING LIVES: WAVE I, II, AND III, 1986, 1989, 1994 [Computer file]. ICPSR version. Ann Arbor, MI: University of Michigan, Institute for Social Research, Survey Research Center [producer], 2002. Ann Arbor, MI: Inter-university Consortium for Political and Social Research [distributor], 2003. 2) The results are not shown in the paper.
This study was designed to examine the relationships between health behaviors and the development of chronic diseases among respondents who were reportedly free of chronic ailments at the time of the first interview. We employ data from Wave Ⅰ and Wave Ⅲ. It is important to note that we began with a group of respondents who initially reported being free of chronic diseases. Such a strategy allows a more precise examination of the emergence of chronic disease by observing health status over the longest time period possible with these data. The longitudinal aspect of the analysis and the opportunity to follow a group of persons who were the most robust respondents at Wave Ⅰ set this study apart from most previous work in this area.
The methodological strategy of estimating the association of health behaviors with chronic diseases is to select the 1,249 cases that did not have a chronic disease at Wave Ⅰ(after weighting). Beginning only with persons who are free of chronic diseases in the first wave allows for a prospective study that facilitates the inference of causality over the time interval. However, it is possible that some people may have had chronic diseases but simply have
not known it at Wave Ⅰ. Therefore, we control health satisfaction3)
to minimize this possible error. Essentially the latter item asks respondents to assess their health at Wave Ⅰ.
The reason that we use the health satisfaction variable instead of
‘self-rated health’, which is widely used as an indicator for general
health condition, is that health satisfaction, for our purposes, is a
74 保健社會硏究 第26卷 第2號
3) For more detail about health satisfaction variable, see the measurement section for ‘major explanatory variables’in this paper.
more reliable indicator. Although self-rated health is known to be strongly related to health status, it is also affected by age. For example, older people have more health problems, but tend to be more positive in rating their health compared to younger people with the same problems(Ferraro and Yu. 1995). In addition, self-rated health might not clearly reflect the relationship between the body mass index and health. That is, it is possible that people rate their health as good, even though they might not be satisfied with their health condition if they are overweight(or underweight).
Because we have limited the sample to those surviving at Wave Ⅲ and who reported no chronic disease at Wave Ⅰ, we are essentially focusing on the important question of how health behaviors impact the healthiest people. This means that we have excluded Wave Ⅰ respondents who died during the interval between Wave Ⅰ and Wave Ⅲ and those who could not be located at later waves, and any who, though located, refused continued participation. This avoids certain methodological problems that accompany sample attrition and allows us to observe the impact of behaviors on those who are initially largely disease free. However, this approach means that we are able to generalize only to the more robust proportion of the population. Those in our sample may also be less geographically mobile than the group lost
to the sample because they could not be found at later waves4)
. The analysis is also limited to blacks and whites. Other non-whites are included in the category for blacks because the number of
HEALTH BEHAVIOR AND CHRONIC DISEASE: A LONGITUDINAL ANALYSIS OF A HEALTHY POPULATION75
4) Whatever the situation regarding spatial mobility, and some tentative inferences can be drawn about respondents who “disappeared”based on their characteristics recorded at Wave Ⅰ, nothing at all is known about their health at Wave Ⅲ.
persons in other racial groups was too small to support the analysis
as a separated racial group5).
Using these data, multinomial logistic regression models were estimated. Since responses to the questions about chronic diseases are dichotomous and chronic diseases vary in terms of lethality, multinomial logistic regression is a more efficient approach than a series of binomial logistic models. In addition, it provides more accurate estimates especially when the sample sizes are limited. The results are presented directly in terms of the logistic coefficients, not in terms of the exponentiated coefficients(odds ratios).
3. MEASUREMENT
Precursors. We include sociodemographic and socioeconomic variables, such as age, gender, race, education, marital status, and economic hardship as controls. Age is measured as a continuous variable, and education is measured as a set of dummy variables. Gender, race, and marital status variables are dichotomies. To control economic factors, we used an economic hardship variable, constructed using three questions. Respondents were asked: How satisfied are you with(your/your family’s) present financial situation? How difficult is it for(you/your family) to meet the
monthly payments on your(family’s) bills? And in general how do
your(family’s) finances usually work out at the end of the month?
For the first question, respondents selected one of five choices: completely satisfied, very satisfied, somewhat satisfied, not very
76 保健社會硏究 第26卷 第2號
5) Other non-whites include Hispanic, Asian population, as well as other racial groups. They are 59 out of 1,249 in our sample.
satisfied, and not at all satisfied. The choices to the second question are ‘extremely difficult’, ‘very difficult’, ‘somewhat difficult’, ‘slightly difficult’, and ‘not difficult’. To the third question,
respondents chose among ‘some money left over’, ‘just enough
money’, and ‘not enough money’. The first question was coded 1
to 5(‘completely satisfied’ to ‘not at all satisfied’). The second
question was scored in the same direction as the first item; that is, high values indicate a higher level of financial stress for the respondents. The third question was coded 1 to 3. The operationalization of this variable was the recode provided in the
ACL data files which averages the means for the three items6).
Major Explanatory Variables. In this study, we use four types of health behavior: physical activity, drinking alcohol, smoking cigarettes, and the body mass index. The physical activities measure was constructed with three questions: 1) how often do you work in the garden or yard, would you say? 2) how often do you engage in active sports or exercise? And 3) how often do you
take walks? Response categories are ‘often’, ‘sometimes’, ‘rarely’
or ‘never’. This variable is also the recode provided in the ACL
data files which takes the arithmetic means of these three items. Consumption of alcohol was operationalized as a set of dummy variables using three categories of consumption during the past month, viz., non-drinker, moderate drinker(less than 60 cans of
beer, glasses of wine, or drinks of liquor)7), and heavy drinker(60 or
HEALTH BEHAVIOR AND CHRONIC DISEASE: A LONGITUDINAL ANALYSIS OF A HEALTHY POPULATION77
6) It is standardized using the means and standard deviations of above three variables (House. 2003).
7) Units for the drinking refer to ‘cans of beer’, ‘glasses of wine’, or ‘drinks of liquor’ in last month.
more drinks). Also, respondents were classified as never smoked, current smoker, and past smoker at the time of the third interview. This measure allows assessment of change in smoking behavior between Wave Ⅰ and Ⅲ. Unlike the case with drinking, a non-negligible number of respondents quit smoking after Wave Ⅰ. Some of the respondents who quit smoking between Wave Ⅰ and Wave Ⅲ likely did so because of health concerns(including perhaps the onset of disease).
We also use the body mass index(BMI) as another explanatory variable. Although the BMI per se is not a type of health
behaviors, it often reflects individual’s eating habits. There are five
categories for this variable, which are ‘under weight’(lowest 5% of
cases), ‘low normal’(next to lowest 25%), ‘mid-normal’(middle
30%), ‘high normal’(next to highest 25%), and ‘over weight’
(highest 15%). These classifications, instead of calculated BMI values, are used because they are defined by fixed BMI cutpoints derived from morbidity and mortality data for adults(Strawbridge et al. 2000; World Health Organization. 1996). The categories were developed separately for males and females, computed as weight(in pounds) divided by height(in inches squared).
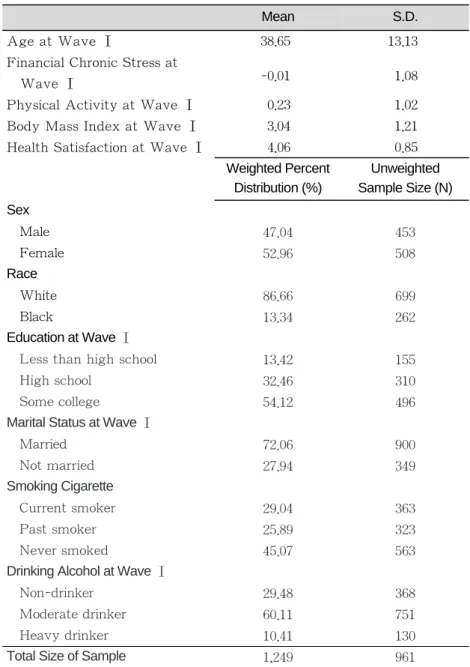
In the ACL data set, ages of respondents ranged from 25 to 95, and the mean age was 53.6. However, after selecting persons who did not have any chronic disease at Wave Ⅰ and who remained in the sample at Wave Ⅲ, the age range became 25 to 92, and the mean age was 38.65. This supports the conclusion stated above that chronic disease risk increases with age. Table 1 provides descriptive statistics for all variables(Total N = 961).
The fact that respondents did not report any chronic symptoms
78 保健社會硏究 第26卷 第2號
at Wave Ⅰ does not mean that all such persons were actually free of chronic diseases. Also, it is possible that people in our sample might have had some chronic diseases at Wave Ⅰ and died before Wave Ⅲ, even though all cases in our sample reported being free of chronic ailments at Wave Ⅰ. We try to reduce this potential problem by controlling health satisfaction at Wave Ⅰ. For this variable, respondents were asked ‘how satisfied are you with your health?’ and the answers were measured by five possible responses, which are ‘completely satisfied’, ‘very satisfied’, ‘somewhat satisfied’, ‘not very satisfied’, and ‘not at all
satisfied’. In the analysis, the higher values of this variable indicate
higher levels of health satisfaction. Means and standard deviations describe the continuous variables, such as age, financial situation, physical activity, the body mass index and health satisfaction. Percent distributions characterize the other(categorical) variables(see Table 1).
Dependent Variables: The dependent variable is whether people
have any kind of chronic disease at Wave Ⅲ. Some conditions are relatively minor, such as foot problems(i.e. problems with circulation, corns or callouses) or urine beyond control while some others are leading causes of death such as heart disease or cancer.
To estimate how health behaviors are associated with chronic diseases, we created a dependent variable with three categories, measured at Wave Ⅲ. The first category consists of those who did not have any chronic ailments. The second indicates those who had “mild”chronic diseases, and the third group consists of respondents who reported one or more of the five most lethal chronic diseases. For example, the “ mild category” includes ‘ arthritis’,
80 保健社會硏究 第26卷 第2號
Note: Means and SDs are weighted.
Table 1. Descriptive Statistics of Variables
Age at Wave Ⅰ
Financial Chronic Stress at Wave Ⅰ
Physical Activity at Wave Ⅰ Body Mass Index at Wave Ⅰ Health Satisfaction at Wave Ⅰ
Sex Male Female Race White Black Education at Wave Ⅰ
Less than high school High school
Some college
Marital Status at Wave Ⅰ
Married Not married Smoking Cigarette Current smoker Past smoker Never smoked
Drinking Alcohol at Wave Ⅰ
Non-drinker Moderate drinker Heavy drinker Total Size of Sample
47.04 52.96 86.66 13.34 13.42 32.46 54.12 72.06 27.94 29.04 25.89 45.07 29.48 60.11 10.41 1,249 453 508 699 262 155 310 496 900 349 363 323 563 368 751 130 961 Mean 38.65 -0.01 0.23 3.04 4.06 Weighted Percent Distribution (%) S.D. 13.13 1.08 1.02 1.21 0.85 Unweighted Sample Size (N)
‘hypertension’, ‘foot problems’, ‘broken bones’, and ‘urine beyond
control’. On the other hand, ‘stroke’, ‘lung disease’, ‘heart
attack’, ‘cancer’, and ‘diabetes’are included in the third category,
based on leading causes of death among U.S. adults(Kochanek et al. 2004). Given different levels of access to health care and medical service and insurance coverage in the U.S., self reported health problems are often considered as the most widely used measures of the health status(Krause and jay. 1994). Table 2 shows the distribution of chronic diseases, according to both absolute and relative frequencies.
HEALTH BEHAVIOR AND CHRONIC DISEASE: A LONGITUDINAL ANALYSIS OF A HEALTHY POPULATION81
Table 2. Chronic Diseases at Wave Ⅲ
1 2 3 4 5 6 7 8 9 10 Arthritis Foot problems Hypertension Broken bones Urine beyond control Lung disease Heart Attack Cancer Diabetes Stroke 15.30 13.60 9.74 3.12 2.78 2.78 2.77 1.99 0.99 0.65 161 145 122 31 33 28 30 26 12 11 Weighted Percentages (%) Unweighted Sample Size (N)
Ⅳ
Ⅳ. RESULTS
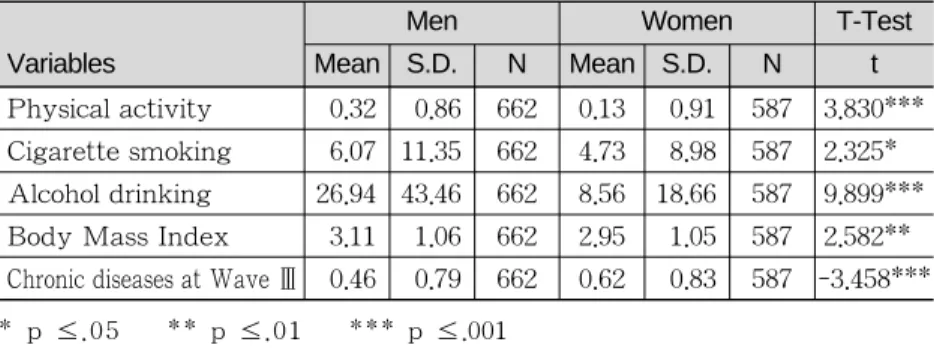
Before estimating regression models, we investigated the distribution of health behaviors and chronic disease by various risk factors, including gender, race, education level, and marital status. Table 3 shows the differences by gender. According to this table, men are more likely involved in physical activity, cigarette smoking, and alcohol drinking than women. However, women tend to have more chronic diseases and maintain a lower body mass index compared to men. All these differences are significant statistically.
Table 4 focuses on differences between Blacks and Whites. Race differences also exist, but only physical activity and chronic diseases are significant. Whites report more physical activity, and Blacks have more chronic diseases than Whites. The differences in cigarette smoking, alcohol drinking and the BMI are not statistically significant in Table 4.
82 保健社會硏究 第26卷 第2號
* p ≤.05 ** p ≤.01 *** p ≤.001
Table 3. Means and Standard Deviations for Variables by Gender
Variables Physical activity Cigarette smoking Alcohol drinking Body Mass Index Chronic diseases at Wave Ⅲ
0.32 6.07 26.94 3.11 0.46 0.86 11.35 43.46 1.06 0.79 662 662 662 662 662 0.13 4.73 8.56 2.95 0.62 0.91 8.98 18.66 1.05 0.83 587 587 587 587 587 3.830*** 2.325*** 9.899*** 2.582*** -3.458*** Men Mean S.D. N Mean S.D. N t Women T-Test
The next tables show the differences by social variables including education and marital status. There are two tables related to education. The first(Table 5) is a comparison of the lowest educated group with all others, and the other(Table 6) is a comparison of the highest educated group with all others.
The lowest educated group was composed of those who completed 8 years or less education. The ‘others’were those who completed more than 8 years education. The differences are consistent except for alcohol drinking. The lowest educated group is
HEALTH BEHAVIOR AND CHRONIC DISEASE: A LONGITUDINAL ANALYSIS OF A HEALTHY POPULATION83
* p ≤ .05
Table 4. Means and Standard Deviations for Variables by Race
Variables Physical activity Cigarette smoking Alcohol drinking Body Mass Index Chronic diseases at Wave Ⅲ
0.26 5.59 18.70 3.03 0.53 0.88 10.59 36.29 1.05 0.80 1,082 1,082 1,082 1,082 1,082 0.06 4.47 15.65 3.09 0.59 0.93 8.35 28.17 1.11 0.91 167 167 167 167 167 2.483* 1.547* 1.248* -0.692* -0.825* White Mean S.D. N Mean S.D. N t Black T-Test ** p ≤ .01 *** p ≤ .001
Table 5. Means and Standard Deviations for Variables by Education: Lowest Educated Compared to All Other Education Group
Variables Physical activity Cigarette smoking Alcohol drinking Body Mass Index Chronic diseases at Wave Ⅲ
-0.14 8.07 15.79 3.03 0.77 1.10 12.02 39.19 1.10 1.13 168 168 168 168 168 0.29 5.03 18.68 3.04 0.5 0.84 9.97 34.69 1.05 0.75 1,081 1,081 1,081 1,081 1,081 4.781*** -3.110*** 0.900*** 0.040*** -3.059*** 8 years or less Mean S.D. N Mean S.D. N t Others T-Test
less physically active and more apt to smoke cigarette, but less likely to consume alcohol. They have more chronic diseases than their counterparts.
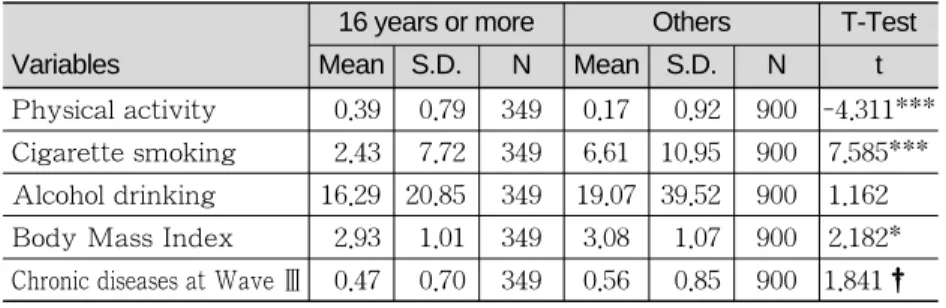
In Table 6, the most highly educated respondents report more physical activity. They smoke less, and their body mass indexes are lower on average. Also, they are at less risk of chronic diseases than the less educated. The difference between these two groups in alcohol consumption is not significant.
Table 7 shows that, with the exception of the body mass index, married people are advantaged compared to the unmarried people. Married adults are also less likely to suffer from chronic diseases.
Based on the above tables, all sociodemographic variables seem to be related to individuals’ health behaviors and health status. However, the differences of health behaviors and health status appear most clearly and consistently by gender and education level. The next table(Table 8) presents the results of the multinomial logistic regression.
84 保健社會硏究 第26卷 第2號
† p ≤ .1 * p ≤ .05 *** p ≤ .001
Table 6. Means and Standard Deviations for Variables by Education: Highest Educated Compared to All Other Education Group
Variables Physical activity Cigarette smoking Alcohol drinking Body Mass Index Chronic diseases at Wave Ⅲ
0.39 2.43 16.29 2.93 0.47 0.79 7.72 20.85 1.01 0.70 349 349 349 349 349 0.17 6.61 19.07 3.08 0.56 0.92 10.95 39.52 1.07 0.85 900 900 900 900 900 -4.311*** 7.585*** 1.162*** 2.182*** 1.841†* 16 years or more Mean S.D. N Mean S.D. N t Others T-Test
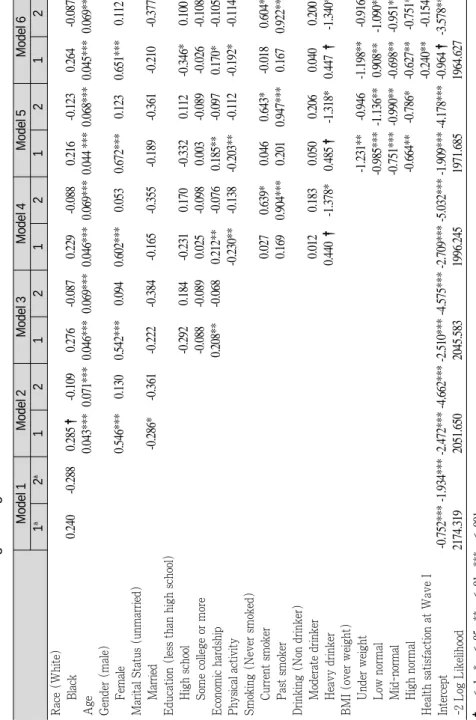
Model 1 of Table 8 includes only the race variable. Age, sex and marital status are included in Model 2. Education and economic hardship are added in Model 3. Model 4 adds health behaviors: physical activity, smoking and drinking. Considering that body mass may itself be a function of health behaviors, it is added in Model 5. Model 6 controls health satisfaction at Wave I along with all other risk factors. Each model shows the estimates of two categories,
which are those who reported one or more “mild”chronic conditions
and those who had one or more serious chronic diseases. The reference group consists of respondents who did not report any chronic disease.
Table 8 shows that the risk of all chronic diseases is greater among older persons, women, and the unmarried, while marital status is generally not statistically significant. For health behaviors, the regression coefficients are generally consistent. That is, physical activity has a negative effect on all chronic diseases, and those who smoke are at higher risk of chronic diseases. It may seem surprising that past smokers are at greater risk of chronic diseases than current smokers. A plausible explanation is that a number of people
HEALTH BEHAVIOR AND CHRONIC DISEASE: A LONGITUDINAL ANALYSIS OF A HEALTHY POPULATION85
* p ≤ .05 ** p ≤ .01
Table 7. Means and Standard Deviations for Variables by Marital Status
Variables Physical activity Cigarette smoking Alcohol drinking Body Mass Index Chronic diseases at Wave Ⅲ
0.27 5.22 17.66 3.06 0.50 0.87 10.31 36.61 1.05 0.78 900 900 900 900 900 0.12 5.99 19.93 2.98 0.63 0.92 10.33 31.74 1.08 0.88 349 349 349 349 349 -2.688** 1.176** 1.084** -1.180** 2.377** Men Mean S.D. N Mean S.D. N t Women T-Test
86 保健社會硏究 第26卷 第2號
Table 8. The Multinomial Logistic Regression Coefficients for Chronic Conditions Race (White)
Black
Age Gender (male)
Female
Marital Status (unmarried)
Married
Education (less than high school)
High school Some college or more Economic hardship Physical activity Smoking (Never smoked)
Current smoker Past smoker
Drinking (Non drinker)
Moderate drinker Heavy drinker
BMI (over weight)
Under weight Low normal Mid-normal High normal Health satisfaction at Wave I Intercept -2 Log Likelihood
0.240 -0.288 0.285 † -0.109 0.276 -0.087 0.229 -0.088 0.216 -0.123 0.264 -0.087 0.043*** 0.071*** 0.046*** 0.069*** 0.046*** 0.069*** 0.044 *** 0.068*** 0.045*** 0.069*** 0.546*** 0.130 0.542*** 0.094 0.602*** 0.053 0.672*** 0.123 0.651*** 0.112 -0.286* -0.361 -0.222 -0.384 -0.165 -0.355 -0.189 -0.361 -0.210 -0.377 -0.292 0.184 -0.231 0.170 -0.332 0.112 -0.346* 0.100 -0.088 -0.089 0.025 -0.098 0.003 -0.089 -0.026 -0.108 0.208** -0.068 0.212** -0.076 0.185** -0.097 0.170* -0.105 -0.230** -0.138 -0.203** -0.112 -0.192* -0.114 0.027 0.639* 0.046 0.643* -0.018 0.604* 0.169 0.904*** 0.201 0.947*** 0.167 0.922*** 0.012 0.183 0.050 0.206 0.040 0.200 0.440 † -1.378* 0.485 † -1.318* 0.447 † -1.340* -1.231** -0.946 -1.198** -0.916 -0.985*** -1.136** 0.908** -1.090** -0.751*** -0.990** -0.698** -0.951** -0.664** -0.786* -0.627** -0.751* -0.240** -0.154 -0.752*** -1.934*** -2.472*** -4.662*** -2.510*** -4.575*** -2.709*** -5.032*** -1.909*** -4.178*** -0.964 † -3.578*** 2174.319 2051.650 2045.583 1996.245 1971.685 1964.627 Model 1 1 a 2 a 1 2 1 2 1 2 1 2 1 2 Model 2 Model 3 Model 4 Model 5 Model 6 † p ≤ .1 * p ≤ .05 ** p ≤ .01 *** p ≤ .001
aNote: 1 refers those who report chronic conditions except for five serious chronic diseases at Wave III, and 2 refers only thos
e who have five serious chronic diseases at Wave
Ⅲ
. who developed serious chronic diseases quit smoking when the
disease was diagnosed. It is clear that ‘over weight’people have higher odds of chronic diseases. Interestingly, chronic diseases are less likely for lower levels of the body mass index, and all coefficients are significant.
On the other hand, the effects of some variables differ depending on the types of chronic diseases. For example, Table 8 shows that Blacks are at a higher risk of “mild”chronic diseases than Whites, but the coefficients for serious chronic diseases are negative. Also the coefficients of education variables are consistent for serious chronic diseases, while they are not for minor chronic diseases. Moreover, it appears that heavy drinkers are less apt to have serious chronic diseases compared to non-drinkers.
Plausible, but of course not definitive, explanations for the unexpected findings may be offered. For example, it may be that, due to less health care access, Blacks are more likely not to know whether they had chronic diseases at the first wave and also perhaps they were more likely to die before the third wave due to late diagnosis and/or lack of care. The finding that women are at higher risk of chronic diseases is not necessarily surprising. It has been shown that women are more likely to be aware of illnesses and health statuses than men. Women are more perhaps apt to have chronic diseases detected due to the greater tendency to visit a physician, and thus, to be more aware of morbidity(Verbrugge. 1985).
With respect to drinking, the unexpected result is something of a data artifact. That is, there were no respondents who were heavy drinkers and who also had a serious chronic disease. If people have
an especially serious diseases, they may be unable to drink heavily, or they may tend to quit, or at least reduce, drinking. Nevertheless, it is not completely clear why non-drinkers fare better than moderate drinkers. It is certainly plausible that person with serious chronic diseases often try to improve their health by adopting healthy behaviors(i.e., reducing smoking and consumption of alcohol). It is possible that health behaviors such as smoking and alcohol consumption tend to be underreported, and exercise may be overreported because of social desirability(Newsom et al. 2005). Also, the effects of the body mass index may be overestimated if being overweight is viewed as less socially acceptable than being
“thin”.
Ⅴ
Ⅴ. SUMMARY & FUTURE DIRECTIONS
This study was designed to explore the association of health behavior and chronic diseases by seriousness in a sample of healthy individuals. In this study, we used health behavior variables, which include physical activity, smoking, drinking and the body mass index to estimate the association of these health behaviors and chronic diseases. We used 10 chronic conditions categorized as “mild”and “serious”and adopted a multinomial logistic regression approach. For multinomial logistic models, we classified respondents into three groups to distinguish respondents who have no chronic disease, those with less serious chronic conditions, and those with the more lethal chronic diseases.
88 保健社會硏究 第26卷 第2號
The results support the findings of previous studies in that men, Whites, younger, educated, married, and more affluent persons are less apt to have chronic diseases, compared to women, Blacks, and older, less educated, unmarried, and less affluent persons. Health behaviors clearly affect risk of chronic disease. It was also found that these health behaviors are closely related to socioeconomic status, especially education. More highly educated people tend to engage in more physical activity, less drinking and smoking, and to have a lower body mass index. They are less likely to suffer chronic ailments. Also, it was found that economic hardship increases the risk of less serious chronic diseases, but is not significantly related to the more serious conditions. The latter finding should be the focus of future research.
While age and smoking are related as expected to risk of serious chronic diseases, the direction of the coefficients of economic hardship is reversed. This may be yet another instance of “selectivity.”That is, persons with more life threatening conditions may lack the resources to access health care and thereafter be more likely to have “left the sample”due to death before the third wave of the interview. Also, the effect of drinking on serious chronic diseases is different from what we was expected. As we mentioned earlier, we suspect that these results emerge from the greater probability of “negative selectivity.” These problems might be alleviated in future studies by data sets that are larger and that contain additional items to operationalize other risk factors. In addition, psychological variables should be helpful in understanding the processes of interest.
References
Corin, E. 1994. “The Social and Cultural Matrix of Health and Disease.” Pp. 93-132, In R. G. Evans, M. L. Barer, and T. R. Marmor (ed.) Why Are Some People Healthy and Others Not? Hawthorne, NY: Aldine De Gruyter.
Evans, R. G., and G. L. Stoddart, 1994. “Producing Health, Consuming Health Care.” Pp. 27-64, In R. G. Evans, M. L. Barer, and T. R. Marmor (ed.) Why Are Some People Healthy and Others Not? Hawthorne, NY: Aldine De Gruyter. Ferraro, K. F., and Y. Yu, 1995. “Body Weight and Self-ratings of
Health.” Journal of Health and Social Behavior, 36 (3): 274-284.
House, James S. AMERICANS’ CHANGING LIVES: WAVE Ⅰ, Ⅱ, AND Ⅲ, 1986, 1989, 1994 [Computer file]. ICPSR version. Ann Arbor, MI: University of Michigan, Institute for Social Research, Survey Research Center [producer], 2002. Ann Arbor, MI: Inter-university Consortium for Political and Social Research [distributor], 2003.
Kochanek, K. D., S. L. Murphy, R. N. Anderson, and C. Scott, 2004. “Deaths: Final Data for 2002.” National Vital Statistics Reports, 53 (5). Retrieved October 22, 2004, from http://www.cdc.gov/nchs/ data/nvsr/nvsr53/nvsr53_05acc.pdf. Krause, N. and G. Jay. 1994. “What Do Global Self-Rated Health
Items Measure?” Med Care, 32:930-942.
Mirowsky, J., and C. E. Ross, 2003. Education, Social Status, and Health, Hawthorne, NY: Aldine de Gruyter.
90 保健社會硏究 第26卷 第2號
Newsom, J. T., B. H. McFarland, M. S. Kaplan, N. Huguet, and B. Zani. 2005. “The Health Consciousness Myth: Implications of the Near Independence of Major Health Behaviors in the North American Population.” Social Science & Medicine, 60 (2): 433-437.
Strawbridge, W. J., M. I. Wallhagen and S.J. Sherma. 2000. “New NHLBI Clinical Guidelines for Obesity and Overweight: Will They Promote Health?” American Journal of Public Health, 90:340-343.
Verbrugge, L. M. 1985. “Gender and Health: An Update on Hypotheses and Evidence.” Journal of Health and Social Behavior, 26 (3): 156-182.
World Health Organization Expert Committee on Physical Status. 1996. “The Use and Interpretation of Anthropometry.” Physical Status: Report of a WHO Expert Committee: WHO Technical Report Series 854, Geneva, Switzland: World Health Organization.
92 保健社會硏究 第26卷 第2號 사망을 초래하는 주요 질병이 급성 전염성 질환에서 만성 퇴행성 질환 으로 전화되는 과정을 경험하면서 사회인구학내에서의 만성 질환에 대한 관심 또한 고조되어 왔다. 특히 만성 질환의 발병과 관련하여 규칙적인 운 동과 건전한 건강행태가 만성 질환의 발병과 관련되어 있다는 것은 이미 관련 선행 연구들로 인하여 널리 인식되어 왔다. 그러나 규칙적인 운동과 흡연 및 음주와 관련된 건전한 건강행태가 만성 질환의 발병을 억제하는 중요한 요소라는 인식에도 불구하고, 대부분의 기존 연구는 횡단 자료 (cross sectional data)에 기반한 연구로서, 종단 자료(longitudinal data)를 이용한 경험적 연구는 상대적으로 드물었다.
본 연구는 American Changing Lives survey(이하 ACL)의 자료를 이용하여 자기 규제화된 건강 행태가 만성 질환의 발병에 미치는 영향을 분석하였다. ACL은 미국 전체 국민의 대표성을 확보한 표본에 기반하여 미국 국민의 가정과 사회 생활 전반에 이르는 일상 생활의 변천을 조사하 기 위하여 1986년에 처음 실시되어 1989년과 1994년에 각각 두 번째, 세 번째 조사가 실시되었다. 본 연구에서는 만성 질환이 전혀 없다고 응답한 응답자들을 첫번째 패널조사에서 선택한 후, 8년 후 실시된 세번째 패널 조사에서의 만성 질환 발병 여부를 분석하였다. 본 연구의 주요 독립 변수인 자기 규제화된 건강 행태는 신체적 활동, 흡연, 음주, 그리고 체질량 지수(body mass index)를 포함한 네 가지 변 수로 구체화 되었다. 한편 종속 변수인 만성 질환의 발병 여부는 열 가지 만성 질환과 관련된 증상을 한 가지 지표로 종합한 후, 심각성 여부를 기