Pre-resilience Group Activities Against
a Forthcoming Big Flood Disaster in Tokyo Below-Sea-Level Area
Taro ICHIKO1)․Takaarki KATO2)․Kinji ISHIKAWA3)Abstract
In April 2010, Japan Cabinet Office has published the first countermeasure report for severe flood disasters. This report showed various flood-disaster scenarios and factors that widened damages. One of important suggestions was to transmit precious information for long-distance evacuation. So far, local municipalities have made Flood Hazard Map to inform resident risk and evacuation.
In this paper, cognition and effectiveness of a flood hazard map in the down ARAKAWA river Tokyo were measured by social questionnaire survey. In conclusion, there were 3 factors to effect validity of a flood hazard map. There were (1) commitment to their neighborhood organization, (2) experience of Kathleen typhoon in 1947 and (3) level of using targeted river. As results, a logical diagram about a flood hazard map perception was drawn and discussed from a view of community-based approach.
Keywords: Flood hazard map, the down ARAKAWA river basin in Tokyo, residents social questionnaire survey, a long-way evacuation, a sense of community defence
1. Introduction
According to Japan Ministry of Land, Infrastructure, Transport and Tourism (MLIT) 2005, a population living in areas under the sea level is said to be a total of more than four million in three major metropolitan areas in Japan, i.e. Tokyo, Osaka and Nagoya metropolitan areas. We call these areas “BELLOW-SEA-LEVEL CITIES (BSLCs)”. BSLCs have been exposed to flood risk and the risk has been increasing corresponding to climate change.
In April 2010, Japan Cabinet Office has published the first countermeasure report for metropolitan deluges. This report showed various flood-disaster scenarios and factors that widened damages.
As one of critical mitigation tools, amending flood prevention law in 2005 has obligated municipalities to publish a flood hazard map. Most of local municipalities have published flood hazard maps to inform residents flood risk and evacuation space. Though, municipalities in BSLCs have difficulties to make residents understand a hazard map because there are a few safe evacuation spaces in case of flood. For example in Katsushika city located in BSLC of Tokyo, more than 27 million people have to evacuate toward a hillside apart from more than 10km. The evacuation will be difficult under the present condition in case of wide scale flood.
In this paper, cognition and effectiveness of a flood hazard map in the down ARAKAWA river Tokyo were measured by social questionnaire survey. We think a flood hazard map is useful not only for individual person but also community-based planning. Our researcher and engineer team have been making mitigation outreach programs since 2005. During those activities, some hypothetical to be test by a questionnaire survey were suggested.
2. Flood Risk in case study area
2.1 BSLCs : Below Sea Level Cities
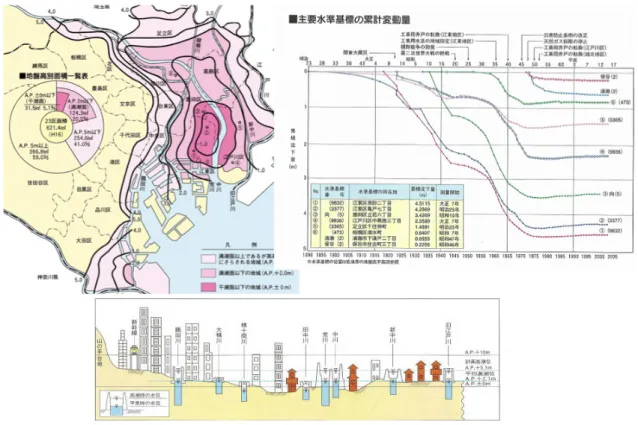
Fig. 1 shows location and time series of land sinking. In 20’s century, these area were intensively industrialized. A lot of factories pumped ground water to produce manufactured goods. The ground condition in this area is weak because of locating a big river basin. And Tokyo Metropolitan Government didn’t design adequate regulations for ground water pumping. So, those area had sank max 4.5m and it’s in below sea level. Approximately two million people are living in Tokyo BSLCs.
1) Assistant Prof., Tokyo Metropolitan University, Japan 2) Associate Prof. University of Tokyo, Japan
Fig. 1. Tokyo BSLCs: Below Sea Level Cities 2.2 Flood Risk Estimation
This district has not experienced since flood disaster in 1947. The residents had little interest in flood disaster.
However, recently, few floods have occurred in BSLCs because of the enhancement of flood-control. As a result, the awareness of flood risk has been declining and the preparation for flood cannot be enough.
Each local government in Tokyo BSLC’s published flood hazard map. Fig. 2 shows a map made by Katsushika city located surveyed area. It is estimated that flood water reached max 5.0m above ground level.
3. Methods of questionnaire survey
3.1 Early studies
To design a questionnaire sheet, early studies about perception and utilize of a flood hazard map in Japan were referred. There were discussed at least three hypothetical.
H1: Family having survivors from flood disasters checked a hazard map higher than others. H2: A flood hazard map makes person more sensitively to risk awareness.
H3: Understanding flood hazard map promotes preparation behavior like designing evacuation route. 3.2 Adding hypothetical
Through mitigation outreach activities by ourselves, newly two hypothetical to be surveyed were reached. It is also necessary to consider long way evacuation in Tokyo BSLC.
(1) Participation level in neighborhood community activities.
In Tokyo west downtown covered Tokyo BSLCs, neighborhood community (“町内会” or “自治会”) was well organized. They had been working on neighbor defence which contains both disaster corresponds and crime prevention activities. Neighborhood community are also relied on as communicator between municipalities and residents.
(2) Relationship level between a person and a river.
Surveyed areas are along with the Arakawa river. But accessibility to the river is not good because of high bank and water pollution. There are great differences among residents in daily use of a river space.
It is reasonable that a person who are not interested in a river would be less imaginable about a flood than interested one. 3.3 Design and distribution of a questionnaire sheet
As results, a questionnaire sheet was composed of about 19 questions. In this paper, Those 7 question results were discussed. 1) family status (number, age)
2) experience flood disasters
3) participation level of community activities 4) daily use of a river space
5) perception of a flood hazard map
6) judgement for the success about long way evacuation 7) participation for community resilience activities
Fig. 4 shows distributed area which separated with Horikiri and Shinkoiwa. 4,600 sheets were distributed by community leaders. 21.5% of them were collected.
4. Perception of a flood hazard map
4.1 Relating basic factors to hazard map perception (1) experience of flood disasters
Table 1 shows experiences of 1947 Kathleen Typhoon. This typhoon caused enormous damages in surveyed area. It occurred about 60 years ago, but it is a most recently flood disaster in Tokyo BSLC. About 40% of respondents had experienced persons in their family.
Table 2 shows the year when respondents began to live in their present houses. Total 27.1% of respondents have been living in before 1947 typhoon. 1947 typhoon experienced persons level is 11.5% higher than living before 1947 typhoon because of there are families who moved in affected area within BSLCs.
(2) Participation level of community activities
Table 3 shows participation level for community activities. About 40% of respondents commit to community activities. It’s not so high level. Community leaders said that “ Young family didn’t come up with our activities. Especially young single family definitely join a few.”
Fig. 3. Daily use of river space
Fig. 4. Surveyed area (3) Daily use of a river space
4.2 Perception of a flood hazard map
Fig. 5 shows a perception of a flood hazard map. Fig. 4 is a cross table aggregated by flood experience and participation level of community activities. 70% of respondents looked a flood hazard map. Families who had experienced 1947 Kathleen Typhoon looked a flood hazard map more than non experienced families. Also, families who involved in community activities looked it more than not involved one. These differences had statistical significance (p<0.01).
Fig. 5. Perception of a flood hazard map 4.3 Judgement for the success about long way evacuation
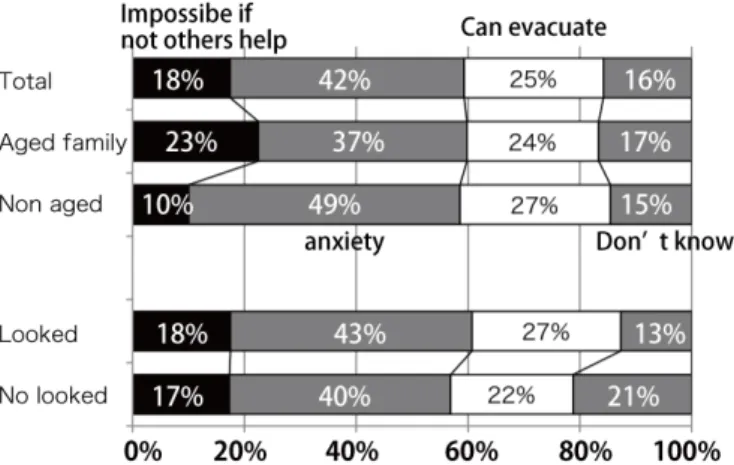
Fig. 6 shows judgement of success or failure for a long way evacuation. 25% of respondents have success prospect for evacuation by themselves. But 23% of respondents families living with aged persons judged impossible if not others support.
Fig. 6. Judgement for the success about long way evacuation 4.4 Participation for community resilience activities
Fig. 7 shows attendant for community-based disaster prevention training. 54% of respondents has participated this training. Families involved community activities also participated a training 27% higher than others.
Fig. 7. Participation for community resilience activities
5. Logical model from our questionnaire survey
5.1 Logical diagram about map perception
In the previous section, questionnaire data were analyzed by cross aggregation. Three plus effecting factor to perception of a flood hazard map are evidenced.
(1) Experience of 1947 Kathleen typhoon (39% of respondents) (2) Participation level of community activities (40% of respondents) (3) Daily use of a river space
It’s means that two hypothetical in this survey (above (2) and (3)) are proved and one early study’s hypothetical (disaster experiences) are also certified.
As a result, a logical diagram about a flood hazard map perception could be drawn (Fig. 8).
Fig. 8. Logical diagram about map perception
6. Conclusion
70% of respondents looked a distributed flood hazard map. But 23% of families within aged person judged impossible to evacuate a long way if not others support.
We mentioned a role of neighborhood community for flood disaster prevention. Finally, some pre-resilience group activities for a long way evacuation were suggested from community-based approach.
(1) How to care for families within aged person in communities. (2) How to involve young families having babies and children. (3) Some periodical activities using river spaces
At the present time, there is no perfect solution for BSLCs, therefore, consideration of countermeasures and various kinds of planning including mitigation and evacuation will be essential. We would like to continue mitigation outreach programs.
Reference
[1] Takaaki KATO, Hitoshi NAKAMUA, Yuto SHIOZAKI and Kinji ISHIKAWA The Community-based Planning and Consideration of Countermeasures through Workshop in “Below-Sea-Level City” against Forthcoming Flood Disasters– Case in Katsushika City in Tokyo - New Technologies for Urban Safety of Mega Cities in Asia, 2010
[2] Tokyo Metropolitan Governments: height of low land in Tokyo, Japan.