Metformin stimulates IGFBP-2 gene
expression through PPARalpha in
diabetic states
Hye Suk Kang
1,*, Ho-Chan Cho
2,*, Jae-Ho Lee
1, Goo Taeg Oh
3, Seung-Hoi Koo
4,
Byung-Hyun Park
5, In-Kyu Lee
6, Hueng-Sik Choi
7, Dae-Kyu Song
1& Seung-Soon Im
1The anti-diabetic drug, metformin, exerts its action through AMP-activated protein kinase (AMPK), and Sirtuin (Sirt1) signaling. Insulin-like growth factor (IGF)-binding protein 2 (IGFBP-2) prevents IGF-1 binding to its receptors, thereby contributing to modulate insulin sensitivity. In this study, we demonstrate that metformin upregulates Igfbp-2 expression through the AMPK-Sirt1-PPARα cascade pathway. In the liver of high fat diet, ob/ob, and db/db mice, Igfbp-2 expression was significantly decreased compared to the expression levels in the wild-type mice (p < 0.05). Upregulation of Igfbp-2 expression by metformin administration was disrupted by gene silencing of Ampk and Sirt1, and this phenomenon was not observed in Pparα-null mice. Notably, activation of IGF-1 receptor (IGF-1R)-dependent signaling by IGF-1 was inhibited by metformin. Finally, when compared to untreated type 2 diabetes patients, the metformin-treated diabetic patients showed increased IGFBP-2 levels with diminished serum IGF-1 levels. Taken together, these findings indicate that IGFBP-2 might be a new target of metformin action in diabetes and the metformin-AMPK-Sirt1-PPARα-IGFBP-2 network may provide a novel pathway that could be applied to ameliorate metabolic syndromes by controlling IGF-1 bioavailability.
In biological fluids, the insulin-like growth factor binding protein (IGFBP) family proteins can complex with both IGF-I and II, and are regulators of IGF actions on metabolism and growth1,2. Currently, there are six mammalian
IGFBPs designated IGFBP-1–6 have been characterized3 and newly IGFBP-7 was identified as a member of the
IGFBP superfamily4. The primary function of the IGFBPs is to restrict the bioavailability of IGF-1 in target
tis-sues5. Among the IGFBPs, IGFBP-2 modulates IGF-1 bioactivity by interacting with IGF-16. IGFBP-2 is highly
expressed in the liver, adipocytes, and central nervous system, and is involved in metabolic homeostasis, insulin resistance, diabetes, and obesity7–9. Moreover, IGFBP-2 is suggested to be used as a marker protein for metabolic
dysfunction10,11. IGFBP-2 is the abundant in blood, and has been shown to play a role in preventing insulin
resist-ance and diet-associated obesity in mice9. However, the regulatory mechanism of IGFBP-2 expression and its
clinical relevance to diabetic states in mice and humans remain poorly understood.
Sirtuin 1 (Sirt1), an NAD+-dependent protein deacetylase, is involved in controlling glucose, lipid
homeosta-sis, aging, inflammation, and circadian regulation of metabolism and cellular processes12. It regulates metabolic
homeostasis by deacetylating crucial transcriptional factors such as peroxisome proliferator-activated receptor α (PPARα ), PPARγ , farnesoid X receptor (FXR), liver X receptor α (LXRα ), PPARγ coactivator 1-α (PGC-1α ), and p5313.
PPARα belongs to the nuclear receptor superfamily; it functions as a transcription factor and plays crucial roles in the regulation of varieties of metabolic dysfunctions related to inflammatory response, glucose and lipid
1Department of Physiology, Keimyung University School of Medicine, Daegu 42601, Korea. 2Department of Internal
Medicine, Keimyung University School of Medicine, Daegu 41931, Republic of Korea. 3Department of Life Sciences,
Ewha Womans University, Seoul 03760, Republic of Korea. 4Division of Life Sciences, Korea University, 145 Anam-Ro,
Seongbuk-Gu, Seoul, 02841, Republic of Korea. 5Department of Biochemistry, Chonbuk National University Medical
School, Jeonju, Jeonbuk 54896, Republic of Korea. 6Division of Endocrinology and Metabolism, Department of
Internal Medicine, Kyungpook National University School of Medicine, Daegu, 41944, Republic of Korea. 7National
Creative Research Initiatives Center for Nuclear Receptor Signals, Hormone Research Center, School of Biological Sciences and Technology, Chonnam National University, Gwangju, 61186, Republic of Korea. *These authors
contributed equally to this work. Correspondence and requests for materials should be addressed to S.-S.I. (email: ssim73@kmu.ac.kr)
Received: 11 October 2015 Accepted: 11 March 2016 Published: 24 March 2016
OPEN
www.nature.com/scientificreports/
metabolism14. PPARα is expressed in various tissues including the liver, adipose tissue, heart, kidney, and
intes-tine14,15. PPARα is activated during fasting or by ligands; PPARα induces fatty acid oxidation and
gluconeogene-sis16. In addition, PPARα is known to suppress inflammation and to preserve insulin sensitivity17. It also interacts
with the retinoid X receptor, and the resulting heterodimer promotes the transcriptional activation of target genes by binding to the consensus PPAR response element (PPRE) on target gene promoters18. Further, PPARα
regulates cancer metabolism by attenuating IGF-1R signaling and Akt phosphorylation in various cancer cells19,20.
However, a potential link between the Sirt1-PPARα axis and IGF-1 signaling system has not been elucidated yet. The antidiabetic drug, metformin, is widely used for the treatment of type 2 diabetes. Metformin attenuates hepatic glucose production and triglycerides accumulation by ameliorating hyperglycemia and fatty oxidation in the liver21–23. Metformin also improves hepatic dysfunction by stimulating liver kinase B-1, which promotes
the expression of AMP-activated protein kinase (AMPK) in the liver24. Because AMPK functions as a potential
intracellular energy sensor and a master regulator of metabolic homeostasis, understanding the mechanisms of its activation by various physiological stimuli or therapeutic drugs and several hormones including adiponectin and leptin25 are of utmost importance in developing anti-diabetic drugs.
In this study, we elucidated the potential role of IGFBP-2 in diet-induced obesity or diabetic mice. Our results demonstrated that metformin controls Igfbp-2 gene transcription through the AMPK-Sirt1-PPARα signaling pathway. Moreover, we showed that regulation of the Sirt1-PPARα -IGFBP-2 signaling cascade by AMPK acti-vator represents a novel pathway that could be applied to ameliorate metabolic syndromes by controlling IGF-1 homeostasis.
Results
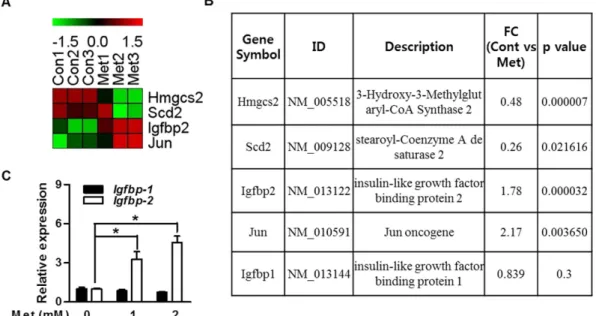
Metformin increases Igfbp-2 gene expression in primary hepatocytes.
Igfbp-2 gene expression isdecreased in diabetic condition and increased when insulin resistance was improved in diabetic animal model10.
We first performed DNA microarray analysis and compared global mRNA expression patterns in the primary hepatocytes by gene profiling to find putative target genes of metformin. Among genes that exhibited significant change in expression of 1.5-fold or higher, IGFBPs gene with control genes are listed in Fig. 1A. Because met-formin as an anti-diabetic drug is able to improve insulin sensitivity in diabetic patients26, we have speculated
that metformin might be responsible for the regulation of Igfbp-2 gene expression and biological function. The expression level of Igfbp-2 was significantly increased in the metformin-treated primary hepatocytes (Fig. 1B). Next, to confirm microarray data under in vitro conditions, we performed quantitative polymerase chain reaction (qPCR) analysis on metformin-exposed mouse primary hepatocytes. As shown in Fig. 1C, Igfbp-2 expression was markedly increased by metformin compared to untreated control (p < 0.05); however, Igfbp-1 expression was not induced by metformin treatment (Fig. 1C). Together, these findings demonstrate that metformin upregulates
Igfbp-2 expression in vitro.
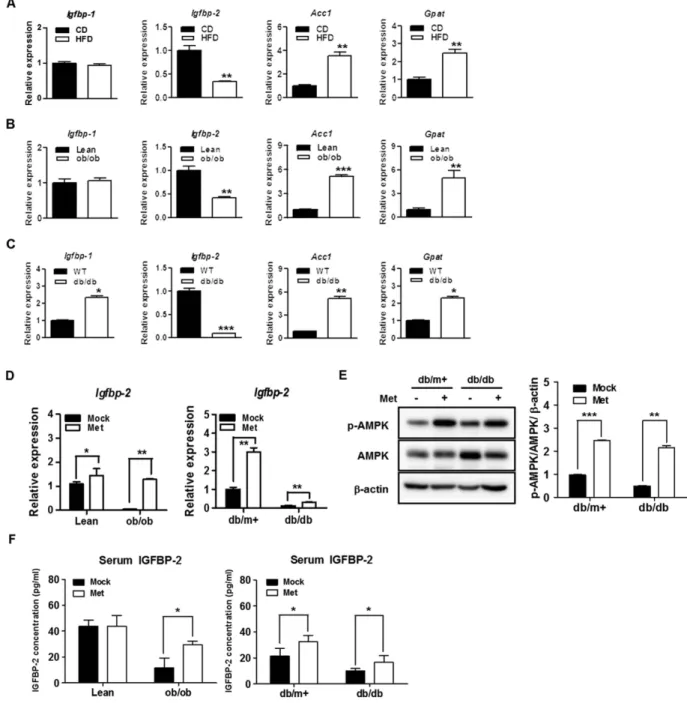
Hepatic Igfbp-2 gene expression in HFD, ob/ob, and db/db mice.
To determine the potential role of Igfbp-2 in obese and diabetic states, we observed the expression level in mouse liver. Igfbp-2 expression wasFigure 1. Metformin increases IGFBP-2 gene expression in primary hepatocytes. DNA microarray analysis
of gene expression in the metformin-treated primary hepatocytes. The ratios of gene profiles were presented by either heatmap (A) or gene expression pattern (B). (B) Representative values from the DNA microarray. Relative Igfbp-1 and Igfbp-2 mRNA levels with metformin treatment compared to control group in primary hepatocytes. (C) Igfbp-2 expression in primary hepatocytes stimulated by metformin (12 h) for the indicated dose. *p < 0.05, **p < 0.01 vs. untreated control.
significantly decreased in the livers of high-fat diet-fed (HFD), ob/ob and db/db mice (p < 0.05); however, Igfbp-1 was not significantly different. Lipogenic gene expressions (Acc1 and Gpat) were increased in HFD, ob/ob, and
db/db mice, which were measured as positive controls (Fig. 2A–C). Interestingly, the expression level of hepatic Igfbp-1 as well as lipogenic genes was significantly increased in db/db mice (Fig. 2C). To observe the effects
of metformin on IGFBP-2 level in vivo, ob/ob and db/db mice were treated by oral gavage with 100 mg/kg/day metformin for 3 weeks and observed increased IGFBP-2 level from serum and livers. Metformin administration was induced significantly an increase of Igfbp-2 mRNA level in the livers of ob/ob and db/db mice and phos-phorylation of AMPK protein was also increased in the livers of metformin-administrated lean and db/db mice (Fig. 2D,E). As was the case with the mRNA expression, serum levels of IGFBP-2 were also significantly increased in the metformin-fed mice, particularly in the ob/ob and db/db mouse rather than their littermates control groups (Fig. 2F). Taken together, these results suggested that Igfbp-2 might be involved in the development obesity- and diabetes-associated metabolic dysfunction of the liver.
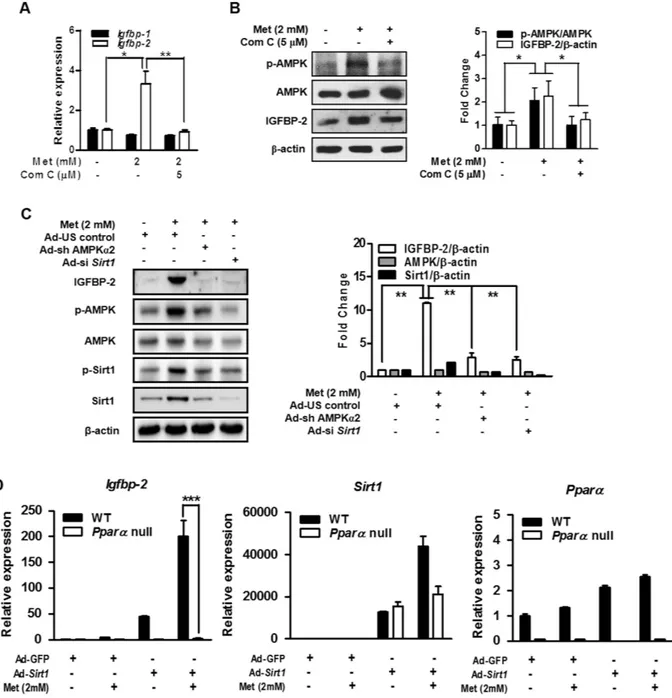
Metformin-induced Igfbp-2 gene expression is mediated by AMPK.
To determine whether metformin-mediated AMPK activation is involved in the induction of Igfbp-2, we examined the effect of metformin-AMPK pathway on IGFBP-2 after treating primary hepatocytes with metformin and compound C (Com C), an AMPK inhibitor. Com C significantly repressed metformin-mediated induction of Igfbp-2 mRNA and protein (Fig. 3A,B). Next, to confirm that metformin-mediated Igfbp-2 expression occurs through AMPK, we adopted adenovirus-mediated gene silencing of AMPK (Ad-si Ampkα2) in the AML12 cell line. As shown in Fig. 3C, Ad-si Ampkα2 significantly decreased IGFBP-2 protein level in the AML12 cells treated with metformin. In addition, Ad-si Sirt1 treatment also decreased metformin-induced IGFBP-2 protein level (Fig. 3C). To further demonstrate effect of AMPKα 1 on Igfbp-2 gene regulation, mouse primary hepatocytes were infected with ade-novirus overexpressing dominant negative form of AMPK (Ad-DN-Ampk). As expected, up-regulation of Igfbp-2 mRNA and protein levels by metformin were markedly attenuated by Ad-DN-Ampk when compared with that of the controls (Supplementary Fig. 1). In addition, we measured Ampkα1 and Ampkα2 mRNA expression levels in the Ad-si Sirt1 infected ALM12 cell line and Ad-Sirt1 infected mouse primary hepatocytes with metformin treatment to confirm whether Sirt1 expression affects Ampk expression. Increased Ampkα1 and Ampkα2 mRNA expression levels by metformin were significantly decreased by Sirt1 depletion and were increased by Sirt1 over-expression (Supplementary Fig. 2). Next, to confirm that metformin mediates Igfbp-2 over-expression through PPARα , we overexpressed Sirt1 using adenovirus with metformin treatment in Pparα null primary hepatocytes and meas-ured Igfbp-2 expression level. As expected, in Pparα null cells, even when Sirt1 is overexpressed, metformin was unable to increase Igfbp-2 mRNA expression level (Fig. 3D). This result suggests that Sirt1 may be involved in regulation of Igfbp-2 expression essentially through PPARα . Collectively, these results indicate that AMPK plays a major role in regulating metformin-mediated stimulation of Igfbp-2 expression in primary hepatocytes and the AML12 cell line and Sirt1 could be also involved in the transcriptional regulation of metformin-mediated Igfbp-2 gene expression.Sirt1 controls Igfbp-2 expression via PPARα-dependent pathway.
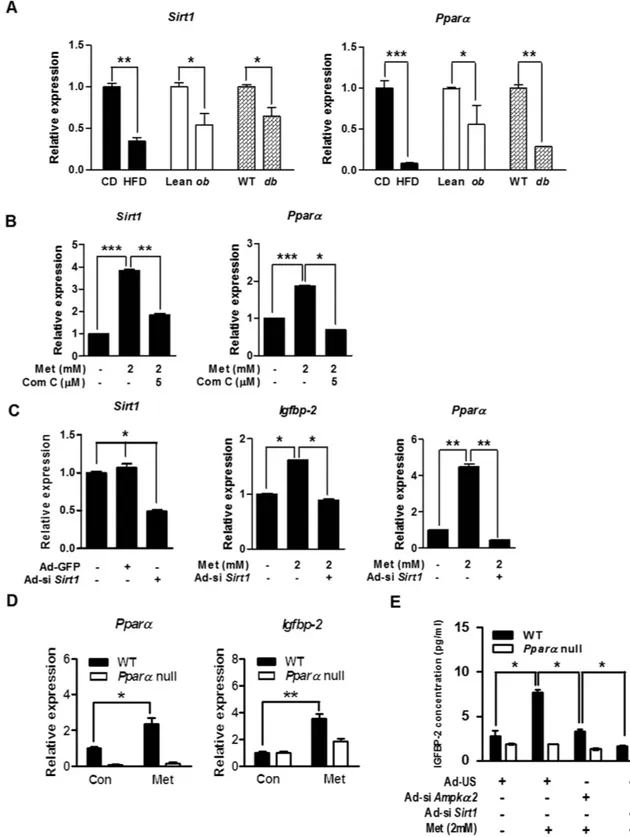
To further confirm the relation-ship between Sirt1 and Igfbp-2 gene expression in vivo, we performed qPCR analysis on liver samples obtained from obese and diabetic mice. The expression levels of Sirt1 and Pparα mRNA were significantly decreased in the obese and diabetic mice compared to respective control groups (Fig. 4A). Metformin significantly elevated Sirt1 and Pparα mRNA levels which were markedly diminished by Com C in primary hepatocytes (Fig. 4B). Next, we investigated whether Sirt1 is also involved in the regulation of Igfbp-2 expression by silencing Sirt1 (Ad-siSirt1). We infected adenovirus of si Sirt1 in primary hepatocytes. Metformin significantly elevated Igfbp-2 and Pparα mRNA levels, and this stimulatory effect of metformin was markedly attenuated by Ad-si Sirt1 (Fig. 4C).
Interestingly, the increase in the mRNA levels of Igfbp-2 and Pparα was observed in metformin-administered wild-type (WT) mice but not in Pparα-null mice (Fig. 4D). Furthermore, metformin increased IGFBP-2 secre-tion in primary hepatocytes isolated from WT mice, whereas Ampkα 2- or Sirt1-silenced primary hepatocytes exhibited significantly reduced IGFBP-2 secretion compared with primary hepatocytes from Pparα-null mice (Fig. 4E). Taken together, these results suggest that the metformin-AMPK-Sirt1 signaling network controls
Igfbp-2 gene expression in a PPARα -dependent manner.
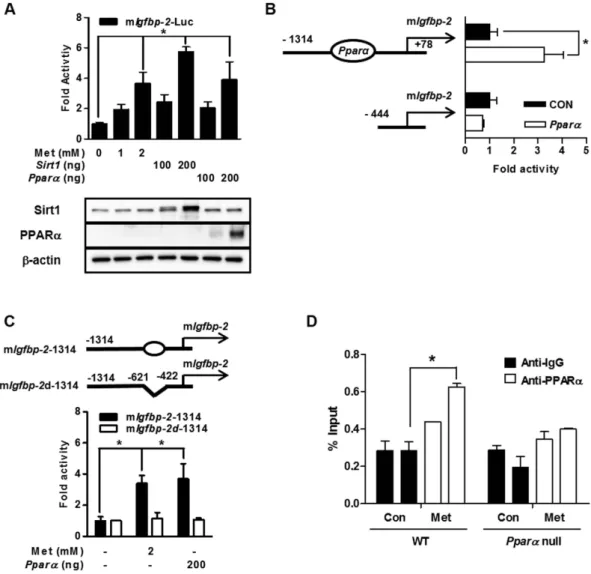
Metformin regulates PPARα-mediated Igfbp-2 gene promoter activity.
To investigate whether metformin modulates the promoter activity of mouse Igfbp-2, we performed transient transfection reporter assay using mouse Igfbp-2-Luc (mIgfbp-2-Luc) and Sirt1 and Pparα expression vectors. As expected, the tran-scriptional activity of Igfbp-2 gene promoter activity was significantly increased by metformin treatment and by overexpression of Sirt1 or Pparα genes (Fig. 5A). Serial deletion and/or PPRE deletion of the Igfbp-2 promoter was performed. Promoter activity of Igfbp-2 gene was increased by overexpression of Pparα and truncations of the PPRE on the promoter resulted in a loss of PPARα responsiveness (Fig. 5B). Moreover, metformin and PPARα -mediated activation of Igfbp-2 gene promoter activity was decreased by internal deletion of PPRE on full length of Igfbp-2 gene promoter (Fig. 5C). ChIP assays of mouse primary hepatocytes in the presence of metformin showed that PPARα occupancy was greater on the Igfbp-2 promoter when metformin was treated (Fig. 5D). These results strongly suggest that metformin positively regulates the Igfbp-2 promoter through PPARα occupancy.Metformin controls IGF-1 signaling cascade in primary cultured hepatocytes.
To evalu-ate the potential effect of PPARα on hepatic IGF-1 bioactivity, we treevalu-ated primary hepatocytes isolevalu-ated from mice which were treated with IGF-1 and metformin. Metformin decreased IGF-1-induced IGF-1R and mTORwww.nature.com/scientificreports/
phosphorylation in primary cultured hepatocytes (Fig. 6A,B). These findings further support our data showing that metformin regulates the IGF-1 signaling system.
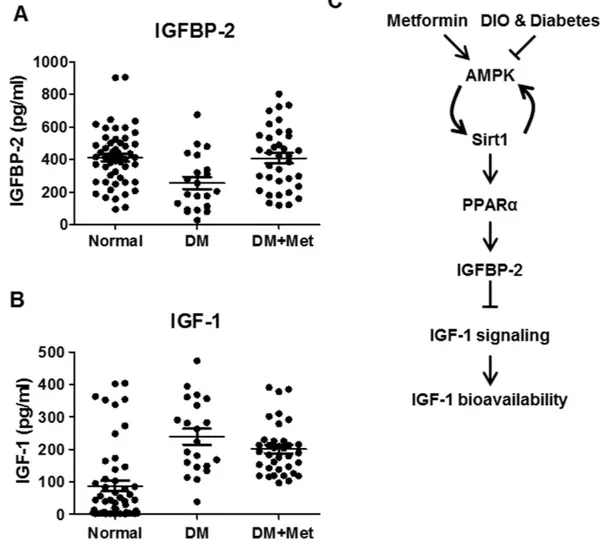
Metformin improves IGF-1 bioavailability in diabetic patients.
Finally, we attempted to elucidate the relationship between metformin and hormonal profile in diabetic patients whose biochemical characteris-tics of patients were recorded. The anthropometric measurements and biochemical characterischaracteris-tics of all studyFigure 2. Hepatic Igfbp-2 gene expression in HFD, ob/ob, and db/db mice and the effects of in vivo treatment with metformin on liver tissue IGFBP-2 expression in ob/ob and db/db mice. (A) Expression
of hepatic Igfbp-2 in response to obesity and diabetes states. Quantitative polymerase chain reaction (qPCR) analysis of total RNAs from liver of chow diet (CD) and high-fat diet (HFD) mice (n = 5). (B) Hepatic expression of Igfbp-2 in liver from ob/ob mice (n = 5). (C) Relative Igfbp-2 mRNA expression in liver tissue of db/db mice (n = 5). *p < 0.05, **p < 0.01, ***p < 0.001 vs. CD or Lean or WT mice. Metformin was administered to lean, ob/ob, db/m+ , and db/db mice for 3 weeks (100 mg/kg/day). (D) Total RNA was isolated from liver tissues of the mouse and the levels of IGFBP-2 mRNA expression were quantified by quantitative real-time PCR. (E) Proteins were extracted from liver tissue of the db/m+ and db/db mouse administered with water or metformin. AMPK phosphorylation were detected by immunoblotting. (F) Blood sample was collected from lean, ob/ob, db/m+ , and db/db mouse treated with water or metformin. Secretion levels of IGFBP-2 were measured by ELISA. *p < 0.05, **p < 0.01, ***p < 0.001 vs. vehicle administered control.
groups are summarized in Table 1, and the hormonal profiles of patients and control individuals are listed in Table 2. Blood sugar, HbA1c, markers of liver function (alanine transaminase and aspartate aminotransferase), lipid parameters (triglycerides, cholesterol, low-density lipoprotein and non-esterified fatty acid), and circulating C-reactive protein levels were significantly elevated in diabetic patients relative to control groups. These metabolic parameters were well ameliorated in patients group who took metformin. Indeed, serum IGFBP-2 level was mark-edly reduced in diabetic patients. On the contrary, circulating IGFBP-2 level of metformin treatment group was restored to similar with that observed in control group (Fig. 7A). Interestingly, even though IGF-1 level is huge increased in diabetic patients, metformin treatment did not suppress an increased IGF-1 level in diabetic patients
Figure 3. Metformin-induced Igfbp-2 gene expression is mediated by AMPK. (A) Igfbp-1 and Igfbp-2
mRNA expressions in mouse primary hepatocytes treated with metformin and compound C (Com C) for 12 h. (B) Effect of metformin and compound C (Com C) on the expression of IGFBP-2 and AMPK in primary hepatocytes. The bar graph on the right shows the quantification of IGF-1 phosphorylation over total IGF-1. (C) Effect of metformin on IGFBP-2 protein level when Ampk or Sirt1 was knocked down. AML12 cells were infected with Ad-si Ampkα 2 and Ad-si Sirt1 for 36 h and then treated with metformin for 24 h. IGFBP-2, Sirt1 and AMPK phosphorylation in AML12 cell line for the indicated conditions were detected by immunoblotting. *p < 0.05, **p < 0.01 vs. untreated control and/or metformin-treated cells. (D) Relative hepatic Igfbp-2, Sirt1, and Ppara mRNA level in the primary hepatocytes from WT and Ppara null mice transfected with Ad-GFP or Ad-Sirt1. Mouse primary hepatocytes from WT and Ppara null mice were infected with Ad-GFP or Ad-Sirt1 for 24 h and then treated with metformin for 12 h. ***p < 0.001 vs. WT mice.
www.nature.com/scientificreports/
Figure 4. Sirt1 controls Igfbp-2 expression via a Pparα-dependent. (A) Relative Sirt1 and Pparα mRNA
expression in liver tissue from HFD, ob/ob, and db/db mice (n = 5). *p < 0.05, **p < 0.01, ***p < 0.001 vs. CD or Lean or WT mice. (B) Expression of hepatic Sirt1 and Pparα in mouse primary hepatocytes treated with metformin and compound C (Com C) for 12 h. (C) qPCR analysis of hepatic Sirt1, Igfbp-2, and Pparα mRNA level in the primary hepatocytes transfected with Ad-si Sirt1. Mouse primary hepatocytes were infected with Ad-si Sirt1 for for 36 h and then treated with metformin for 12 h. (D) Mouse primary hepatocytes from WT and Pparα null mice were incubated in the presence or absence of metformin for 12 h Igfbp-2 and Pparα mRNA expression were measured by qPCR analysis. (E) Secretion level of IGFBP-2 in vitro. Mouse primary hepatocytes from WT and Pparα null mice were infected with Ad-si Ampkα 2 and Ad-si Sirt1 for 36 h and then treated with metformin for 24 h. Supernatant medium were collected and secretion levels of IGFBP-2 were measured by ELISA. *p < 0.05, **p < 0.01, ***p < 0.001 vs. untreated control or metformin-treated cells.
(Fig. 7B). These findings suggest that metformin plays a pivotal role in regulating IGF-1 bioavailability without reducing total IGF-1 level in diabetic patients.
Discussion
In this study, we demonstrate that metformin increases Igfbp-2 expression through the AMPK-Sirt1-PPARα sign-aling cascade both in vitro and in vivo. Conversely, these effects of metformin were attenuated by si Ampkα 2 over-expression as well as silencing of Sirt1 and Pparα genes. Further analysis revealed that metformin stimulates the
2 promoter activity by PPARα . Previously we have reported the presence of PPARα response element on Igfbp-2 promoter that contributes to fasting induction of IGFBP-Igfbp-227. Based on these data, we speculated that metformin
decreased IGF-1 action by upregulating Igfbp-2 gene expression through an AMPK-Sirt1-PPARα signaling network. Circulating IGFBP-2 levels are correlated with metabolic dysfunction including obesity, diabetes, and insulin resistance as Igfbp-2 gene expression is lower in obese and diabetic patients28. IGFBP-2 is a negative
regula-tor of IGF-1 homeostasis7,8,29. A previous study showed IGFBP-2 concentrations were lower in serum of mildly
insulin-resistant glucose-tolerant patients28. Also, restoration of IGFBP-2 in insulin-resistant patients is
associ-ated with improved insulin sensitivity30,31. These clinical observations are consistent with the results of our study,
where a decrease in Igfbp-2 expression and serum levels were observed in both diet-induced obese and diabetic
Figure 5. Metformin regulates PPARα-mediated Igfbp-2 gene expression. (A) Effect of the Pparα on mouse
Igfbp-2 promoter activity. Transient transfections were performed using observed promoter construct, Igfbp-2
(− 1314/+78) in 293T cell. Below, immunoblot analysis of Sirt1 and Pparα expression in transfected HEK293T cells, detected with anti-Sirt1 and PPARα . Equal amounts of protein were confirmed using β -actin. (B) Schematic drawing of Pparα binding region of Igfbp-2 promoter. Serial deletion constructs of Igfbp-2 promoter (− 698/− 686 bp) were transiently transfected with Pparα to 293T cell. (C) PPRE-dependent activation of Igfbp-2 promoter activity. Alignment of potential PPRE in Igfbp-2 promoter is indicated (top panel). (D) ChIP assay. Mouse primary hepatocytes were treated metformin for 24 h. Chromatin was precipitated using an anti-PPARα antibody from primary hepatocytes, and purified DNA samples were used to perform qPCR with primers binding to the PPRE regions on the Igfbp-2 gene promoter. Input represents 10% of purified DNA in each sample. *p < 0.05 vs. untreated control or individual-treated cells. mIgfbp-2, mouse Igfbp-2.
www.nature.com/scientificreports/
Figure 6. Metformin controls IGF-1 signaling cascade in primary cultured hepatocytes. (A) Mouse
primary hepatocytes were pretreated with metformin for 12 h and then exposed to IGF-1 for 15 min at the indicated conditions. Whole cell extracts were isolated from primary hepatocytes of the indicated groups and measured by western blot analysis with various antibodies. (B) The left panel reveals the quantification of IGF-1 phosphorylation over total IGF-1, right panel indicates mTOR phosphorylation over total mTOR, and bottom panel indicates p70S6K phosphorylation over total p70S6K. *p < 0.05, **p < 0.01 vs. untreated control or IGF-1-treated cells.
Characteristic Nor DM DM + Met
N(M/F) 53 (17/36) 20 (9/11) 36 (21/15) Age (years) 58.33 ± 3.83 54.31 ± 3.36 63.53.31 ± 2.95 Height (cm) 158.81 ± 1.95 163.74 ± 1.77 159.92 ± 2.12 Weight (g) 62.02 ± 2.26 67.62 ± 3.38 65.13 ± 3.15 BMI (kg/m2) (male) 24.03 ± 3.03 26.16 ± 0.89 25.6 ± 3.13 BMI (kg/m2) (female) 24.96 ± 2.84 23.24 ± 1.56 24.88 ± 4.68
Table 1. Clinical characteristics of the participants.
Characteristic Nor DM DM + Met
FBS (mg/dl) 94.58 ± 5.16 132.92 ± 13.51 ** 117.53 ± 7.88 ** HbA1c (mmol/l) 6.18 ± 0.13 8.16 ± 0.62 * 6.85 ± 0.15 * Insulin (pmol/l) 32.56 ± 4.97 24.08 ± 4.38 ** 24.73 ± 2.66 C-peptide 10.4 ± 0.87 8.03 ± 1.1 * 7.9 ± 0.97 ALT (IU/l) 26.17 ± 5.27 28.69 ± 4.44 * 19.8 ± 2.51 ** AST (IU/l) 30.83 ± 2.8 25.23 ± 3.38 * 20.4 ± 1.17 * TG (mg/dL) 147.36 ± 38.4 152.22 ± 17.2 * 118.69 ± 14.64 ** Chol (mg/dl) 165.75 ± 11.06 193.38 ± 12.43 ** 164.53 ± 11.22 ** HDL (mg/dl) 48.43 ± 3.01 44.73 ± 3.88 * 43.87 ± 1.74 LDL (mg/dl) 96.35 ± 9.88 113.28 ± 10.87 * 101.87 ± 9.2 ** CRP (mg/dl) 3.03 ± 1.31 9.59 ± 6.51 *** 1.39 ± 0.51 *** NEFA (μEg/l) 762.08 ± 125.83 562.31 ± 80.32 ** 522.13 ± 78.28 *
Table 2. Biochemical characteristics of the participants with metformin-challenged type2 diabetes mellitus. Nor-Normal; DM-Diabetes mellitus; Met-Metformin. FBS-fasting blood sugar; ALT-Alanine
aminotransferase; AST-Aspartate aminotransferase. TG-Triglyceride; Chol-Cholesterol; HDL-High-density lipoprotein; LDL-Low Density lipoprotein; CRP-C-reactive protein; NEFA-Non-esterified fatty acids. Data presented as Mean ± SEM, n = 12–15, *p < 0.05, **p < 0.01, ***p < 0.001 vs. Nor or DM.
animal models as well as in diabetic patients compared to control groups. IGF-1 levels were also significantly higher in diabetic patients. From these findings, we propose that IGFBP-2 may modulate hepatic metabolic dys-function by regulating IGF-1 homeostasis.
As mentioned previously, Sirt1 is associated with metabolic diseases involving the IGF-1 signaling system in the liver12,32,33. However, the connection between the IGFBP-2-IGF-1 axis and the beneficial effects of Sirt1 in the
liver was not previously understood. We demonstrated that metformin significantly elevated hepatic Sirt1 gene expression in an AMPK-dependent manner. We verified that metformin-induced Igfbp-2 expression was medi-ated by the Sirt1-dependent pathway and the effect of metformin was disrupted by gene silencing of Sirt1. Thus, our studies strongly suggest that regulation of the metformin-AMPK pathway through Sirt1 plays an important role in ameliorating hepatic metabolic dysfunction by controlling Igfbp-2 gene expression. However, there is a report suggesting that Sirt1 affects AMPK activation34. In our data, we showed that metformin-induced Ampkα1
and Ampkα2 mRNA expression levels were decreased by knockdown of Sirt1 and were increased by Sirt1 overex-pression (Supplementary Fig. 2). These results indicated that AMPK exoverex-pression might be also regulated by Sirt1 in a feedback regulatory mechanism.
PPARα acts a key role in regulating diverse metabolic processes and maintaining metabolic balance in response to changes in fuel availability14,15. A recent study demonstrated that AMPK activators such as
met-formin and panduratin A control diet-induced obesity and inflammation through the PPARα pathway in the liver35. Therefore, it has been suggested that AMPK activators, including resveratrol, EGCG, and other
natu-ral products, might have beneficial effects on hepatic metabolic dysfunction. We also demonstrated that the metformin-AMPK-PPARα pathway significantly activates Igfbp-2 expression in mice and that metformin treat-ment is correlated with increased serum levels of IGFBP-2 in human patients.
Figure 7. Metformin improves IGF-1 bioavailability in diabetic patients. Serum IGFBP-2 (A) and IGF-1
(B) in the control normal, diabetes (DM), and metformin-treated diabetes patients (DM + Met). (C) Scheme of the role of metformin in the regulation of IGFBP-2-IGF-1 signaling network. Metformin elevates Igfbp-2 gene expression though AMPK-Sirt1-PPARα signaling pathway and then improves IGF-1 bioavailability via attenuation of IGF-1 signaling. However, the beneficial effects of metformin are counteracted in diet-induced obesity and diabetes states.
www.nature.com/scientificreports/
This report suggests that metformin may be involved in IGF-1 homeostasis in response to metabolic dysfunc-tion, and this effect was disrupted by gene silencing of AMPK expression and in Pparα-null mice. Our results imply that activation of AMPK and PPARα in human patients might be possible to regulate the IGFBP-2-IGF-1 axis. Meanwhile, there is possibility that another signaling pathway might exist between the IGFBP-2-IGF-1 axis and the metformin-AMPK-PPARα pathway in the liver. Moreover, interestingly, we showed Pparα expression level was increased by metformin treatment in primary hepatocytes and AML12 cells. Indeed there were putative transcription factors binding sites on the Pparα promoter. Even though we did not provide a mechanistic mech-anism for how metformin actually induced Pparα gene expression here, the signaling system underlying these effects of metformin needs to be elucidated in future studies. Also, even though IGFBP-2 secretion was completely inhibited, metformin treatment of PPAR-null cell showed slight induction of Igfbp-2 expression (Fig. 4D). We speculated that transcription factors other than PPARα may be involved in the regulation of Igfbp-2 gene expres-sion. Moreover, IGFBP-2 secretion has been known to be stimulated by growth hormone36, but the underlying
regulatory mechanism has not been addressed yet. Understanding the discrepancy between intracellular and secretory IGFBP-2 regulation could be an interesting research in the future.
In conclusion, as depicted in the novel schematic model in Fig. 7C, our current study suggests that upregu-lation of Igfbp-2 by metformin activates the AMPK-Sirt1-PPARα signaling network. Furthermore, our results also indicate that metformin affects IGF-1 homeostasis by modulating IGF-1 bioavailability in the diabetic con-dition. These findings may aid the development of a novel pathway that could be applied to ameliorate metabolic dysfunction.
Materials and Methods
Reagents.
Metformin (Sigma-Aldrich, St. Louis, MO, USA), compound C (Calbiochem, Billerica, MA, USA), and recombinant human IGF-1 (Life Technologies, Carlsbad, CA, USA) were purchased from the indi-cated companies and dissolved in the recommended solvents. Cell culture media were purchased from Gibco-BRL (Grand Island, NY, USA).Animal studies.
All animal experiments were performed in accordance with the approved guidelines and the protocol is approved by the Institutional Animal Use and Care Committee (IAUCC), Keimyung University School of Medicine (KM-2014-33R3). Male C57BL6 mice, ob/ob, db/db (Jung-Ang Experimental animals, Seoul, Republic of Korea), and Pparα null mice (8-weeks-of-age) were used in experiments, as previously described37.For the diet experiment, 8-week-old male mice were fed with a LFD (10% of total calories in the form of lard fat) or HFD (60% of total calories in the form of lard fat) for 12 wks (D12450B or D12492; Research Diets, New Brunswick, NJ, USA.
Metformin administration.
The male mouse (7 weeks, n = 32) strains db/m+ (C57BLKS/J lar-m+/Leprdb), db/db (C57BLKS/J lar-Leprdb/Leprdb), lean and ob/ob (C57BL/6J Ham Slc-ob/ob) were divided into two
groups: metformin (n = 16) and control groups (n = 16). In the metformin group, metformin (100 mg/kg/day) was administered by the oral for 3 weeks. In control group, vehicle (water) was administered by daily oral gav-age. After the mice were fasted for 12 h at the end of the treatment period, blood samples were collected. Blood samples were used for determinations of serum IGFBP-2 levels. Real-time PCR and Western blot analysis were performed to examine IGFBP-2 mRNA and protein expression in the removed liver tissues, respectively. All animal experiments were carried out in accordance with the institutional guidelines and the all procedures and care administered were approved by the Institutional Animal Use and Care Committee (IAUCC), Keimyung University School of Medicine (KM-2012-55R and KM-2016-3R).
Construction of plasmids and DNA.
The cDNA encompassing the Igfbp-2 open reading frame was cloned by reverse transcriptase-PCR. Primers containing EcoRI were used for cloning of mouse Igfbp-2. The PCR prod-uct was digested by EcoRI and ligated into pcDNA3 (Invitrogen, CA, USA). The reporter plasmid mouse Igfbp-2 promoter was PCR-amplified form mouse genomic DNA (Novagen, Merck KGaA, Darmstadt, Germany) and inserted into the pGL3 Basic vector (Promega, Madison, WT, USA) using the SmaI and EcoRI restriction enzyme sites. Expression vector for Sirt1 and Pparα were previously described38. The deletion form of mouse Igfbp-2-Lucwas generated using PCR analysis. Plasmids were confirmed by sequencing analysis.
Cell culture and transient transfection assays.
AML-12 immortalized mouse hepatocytes were cultured in DMEM/F-12 medium (Gibco-Brl) supplemented with 10% FBS, insulin-transferrin-selenium (Gibco-BRL), dexamethasone (40 ng/mL; Sigma-Aldrich), and antibiotics in a humidified atmosphere contain-ing 5% CO2 at 37 °C. HEK293T cells were cultured in Dulbecco’s modified Eagle’s medium (DMEM; Gibco-BRL,Grand Island, NY, USA) supplemented with 10% fetal bovine serum (FBS; Hyclone, Logan, UT, USA) and anti-biotics in a humidified atmosphere containing 5% CO2 at 37 °C. Transient transfections were conducted using
Lipofectamine 2000 (Invitrogen, Carlsbad, CA, USA) according to the manufacturer’s instruction.
Isolation and culture of primary mouse hepatocytes.
Mouse primary hepatocytes were isolated from the livers of 8-week-old male mice (Samtako, Osan, Republic of Korea). The protocol for isolation of hepatocytes was described previously39.Microarray expression profiling and CyberT analysis.
Total RNA was prepared from each primary hepatocytes separately and equal amounts from 9 different individual samples were pooled together. Equal amounts of RNA (500 ng) from each pool were used to hybridize to triplicate microarray slides covering the entiretranscriptome (Operon Whole 27K Oligo chip from Operon). The results for the triplicate chips were analyzed by GenePix operating software (GenePix pro 4.1). For statistical and biological significance, we set the Standard Deviation of Differential Expression (SD < p) at <0.5 and fold change at 1.5. These data were used to construct the “heat-map” using MeV v4.61 multiexperiment viewer software (http://www.tm4.org/mev).
Recombinant adenovirus.
Adenoviruses expressing US, sh Ampkα 2, si Sirt1, Sirt1, and green fluorescence protein (GFP) have been described previously40,41.Measurement of mRNA.
Total RNA was isolated from liver tissue and used for qPCR as previously described37. The expression of all transcripts using qPCR data were normalized to ribosomal L32 expression. Thesequences of the primers used for gene expression analyses are reported in Supplementary Table 1.
Immunoblotting.
Proteins were isolated from liver tissues and analyzed according to the methods described previously. The membranes were probed with antibody against phospho-AMPK, AMPK, phospho-IGF-1R, phospho-Akt, Akt, phospho-Sirt1, Sirt1, phospho-p70S6K, p70S6K (Cell Signaling Technology, Danvers, MA, USA), PPARα , IGFBP-2, IGF-1R, and β -actin (Santa Cruz Biotechnology, Santa Cruz, CA, USA), and then devel-oped using an ECL Western blot detection kit (Amersham Bioscience, Piscataway, NJ, USA).Human study population.
This study was carried out in adherence with the guidelines of the Declaration of Helsinki and approved by the Institutional Review Boards of Keimyung University Dongsan medical center in Korea (DSMC2013-09-003-010), and informed consents were obtained from all subjects. The present study was conducted on patients with type 2 diabetes (n = 56) and non-diabetic control (n = 53) who were confirmed with insulin secretion test in the department of Internal Medicine in Dongsan medical center from October 2012 to October 2014. Among the 56 patients with type 2 diabetes, the prevalence of metformin medication was 64.3% (n = 36) and medication without metformin was 35.7% (n = 20). Exclusion criteria were: chronic alcohol drink-ing, hepato-biliary abnormalities, or any other acute disease.Human study design and assessments.
A detailed questionnaire was completed for each of the 109 participating subjects. Information obtained included age, gender, height, weight, blood pressure, smoking his-tory, history of alcohol consumption or hepatobiliary disorders, duration of diabetes, and history of hyperten-sion or cardiovascular diseases. Additionally, fasting blood glucose (FBG), 2 hour postprandial blood glucose (2PPBG), C-peptide, insulin, insulin-like growth factors-binding protein-2 (IGFBP-2) levels were obtained. Fasting venous blood was drawn on the day of examination via a venipuncture from the subject’s antecubital vein and baseline biochemical profiles including serum total glycosylated hemoglobin (HbA1c) and glucose were analyzed using automated glycohemoglobin analyzer HLC-723G7 (Tosoh , Japan) and BIOSEN C-line, clinic (EKF Diagnostic, Germany). For serum and plasma IGFBP-2 measurement, blood samples were collected in tubes containing EDTA and IGFBP-2 concentrations were analyzed with RayBio Mouse IGFBP-2 ELISA Kit (RayBiotech, Inc., Norcross, GA, USA). This study was approved by the Institutional Review Boards of Keimyung University Dongsan medical center in Korea (DSMC2013-09-003-010), and informed consents were obtained from all subjects.Statistical analysis.
Data calculation and statistical analyses were performed using GraphPad Prism 3–5.0 software. The statistical significance of differences between groups was determined using Student’s t test and multiple comparisons were analyzed using one-way ANOVA under treatment and experiment as factors. Results are presented as mean ± standard deviation of at least three separate experiments. All P values less than 0.05 were considered significant.References
1. Oh, Y., Muller, H. L., Lee, D. Y., Fielder, P. J. & Rosenfeld, R. G. Characterization of the affinities of insulin-like growth factor (IGF)-binding proteins 1–4 for IGF-I, IGF-II, IGF-I/insulin hybrid, and IGF-I analogs. Endocrinology 132, 1337–1344 (1993).
2. Firth, S. M. & Baxter, R. C. Cellular actions of the insulin-like growth factor binding proteins. Endocrine reviews 23, 824–854 (2002). 3. Lappas, M. Insulin-like growth factor-binding protein 1 and 7 concentrations are lower in obese pregnant women, women with
gestational diabetes and their fetuses. J Perinatol 35, 32–38 (2015).
4. Yamanaka, Y., Wilson, E. M., Rosenfeld, R. G. & Oh, Y. Inhibition of insulin receptor activation by insulin-like growth factor binding proteins. The Journal of biological chemistry 272, 30729–30734 (1997).
5. Arnaldez, F. I. & Helman, L. J. Targeting the insulin growth factor receptor 1. Hematology/oncology clinics of North America 26, 527–542, vii-viii (2012).
6. Ricort, J. M. Insulin-like growth factor binding protein (IGFBP) signalling. Growth Horm IGF Res 14, 277–286 (2004). 7. Hedbacker, K. et al. Antidiabetic effects of IGFBP2, a leptin-regulated gene. Cell metabolism 11, 11–22 (2010).
8. Rajaram, S., Baylink, D. J. & Mohan, S. Insulin-like growth factor-binding proteins in serum and other biological fluids: regulation and functions. Endocrine reviews 18, 801–831 (1997).
9. Wheatcroft, S. B. & Kearney, M. T. IGF-dependent and IGF-independent actions of IGF-binding protein-1 and -2: implications for metabolic homeostasis. Trends in endocrinology and metabolism: TEM 20, 153–162 (2009).
10. Laughlin, G. A., Barrett-Connor, E., Criqui, M. H. & Kritz-Silverstein, D. The prospective association of serum insulin-like growth factor I (IGF-I) and IGF-binding protein-1 levels with all cause and cardiovascular disease mortality in older adults: the Rancho Bernardo Study. J Clin Endocrinol Metab 89, 114–120 (2004).
11. Heald, A. H. et al. Insulin-like growth factor binding protein-2 (IGFBP-2) is a marker for the metabolic syndrome. Exp Clin
Endocrinol Diabetes 114, 371–376 (2006).
12. Chang, H. C. & Guarente, L. SIRT1 and other sirtuins in metabolism. Trends in endocrinology and metabolism: TEM 25, 138–145 (2014).
13. Schug, T. T. & Li, X. Sirtuin 1 in lipid metabolism and obesity. Annals of medicine 43, 198–211 (2011).
14. Contreras, A. V., Torres, N. & Tovar, A. R. PPAR-alpha as a key nutritional and environmental sensor for metabolic adaptation.
www.nature.com/scientificreports/
15. Monsalve, F. A., Pyarasani, R. D., Delgado-Lopez, F. & Moore-Carrasco, R. Peroxisome proliferator-activated receptor targets for the treatment of metabolic diseases. Mediators of inflammation 2013, 549627 (2013).
16. Peeters, A. & Baes, M. Role of PPARalpha in Hepatic Carbohydrate Metabolism. PPAR Res 2010 (2010).
17. Eder, K. & Ringseis, R. The role of peroxisome proliferator-activated receptor alpha in transcriptional regulation of novel organic cation transporters. Eur J Pharmacol 628, 1–5 (2010).
18. Yoon, M. The role of PPARalpha in lipid metabolism and obesity: focusing on the effects of estrogen on PPARalpha actions.
Pharmacological research : the official journal of the Italian Pharmacological Society 60, 151–159 (2009).
19. Drukala, J. et al. ROS accumulation and IGF-IR inhibition contribute to fenofibrate/PPARalpha -mediated inhibition of glioma cell motility in vitro. Molecular cancer 9, 159 (2010).
20. Urbanska, K. et al. Activation of PPARalpha inhibits IGF-I-mediated growth and survival responses in medulloblastoma cell lines.
International journal of cancer. Journal international du cancer 123, 1015–1024 (2008).
21. Lin, H. Z. et al. Metformin reverses fatty liver disease in obese, leptin-deficient mice. Nature medicine 6, 998–1003 (2000). 22. Kim, M. J. et al. Metformin-associated lactic acidosis: predisposing factors and outcome. Endocrinol Metab (Seoul) 30, 78–83 (2015). 23. Zhou, G. et al. Role of AMP-activated protein kinase in mechanism of metformin action. J Clin Invest 108, 1167–1174 (2001). 24. Shaw, R. J. et al. The kinase LKB1 mediates glucose homeostasis in liver and therapeutic effects of metformin. Science 310,
1642–1646 (2005).
25. Zhang, B. B., Zhou, G. & Li, C. AMPK: an emerging drug target for diabetes and the metabolic syndrome. Cell metabolism 9, 407–416 (2009).
26. Velazquez, E. M., Mendoza, S., Hamer, T., Sosa, F. & Glueck, C. J. Metformin therapy in polycystic ovary syndrome reduces hyperinsulinemia, insulin resistance, hyperandrogenemia, and systolic blood pressure, while facilitating normal menses and pregnancy. Metabolism 43, 647–654 (1994).
27. Kang, H. S. et al. Regulation of IGFBP-2 expression during fasting. The Biochemical journal 467, 453–460 (2015).
28. Frystyk, J., Skjaerbaek, C., Vestbo, E., Fisker, S. & Orskov, H. Circulating levels of free insulin-like growth factors in obese subjects: the impact of type 2 diabetes. Diabetes Metab Res Rev 15, 314–322 (1999).
29. Wheatcroft, S. B. et al. IGF-binding protein-2 protects against the development of obesity and insulin resistance. Diabetes 56, 285–294 (2007).
30. Rasmussen, M. H., Juul, A., Kjems, L. L. & Hilsted, J. Effects of short-term caloric restriction on circulating free IGF-I, acid-labile subunit, IGF-binding proteins (IGFBPs)-1–4, and IGFBPs-1–3 protease activity in obese subjects. Eur J Endocrinol 155, 575–581 (2006).
31. Arafat, A. M. et al. The role of insulin-like growth factor (IGF) binding protein-2 in the insulin-mediated decrease in IGF-I bioactivity. J Clin Endocrinol Metab 94, 5093–5101 (2009).
32. Yamamoto, M. et al. SIRT1 regulates adaptive response of the growth hormone–insulin-like growth factor-I axis under fasting conditions in liver. Proc Natl Acad Sci USA 110, 14948–14953 (2013).
33. Lemieux, M. E. et al. The Sirt1 deacetylase modulates the insulin-like growth factor signaling pathway in mammals. Mechanisms of
ageing and development 126, 1097–1105 (2005).
34. Hou, X. et al. SIRT1 regulates hepatocyte lipid metabolism through activating AMP-activated protein kinase. J Biol Chem 283, 20015–20026 (2008).
35. Buler, M. et al. Energy-sensing factors coactivator peroxisome proliferator-activated receptor gamma coactivator 1-alpha (PGC-1alpha) and AMP-activated protein kinase control expression of inflammatory mediators in liver: induction of interleukin 1 receptor antagonist. J Biol Chem 287, 1847–1860 (2012).
36. Pollak, M. Insulin and insulin-like growth factor signalling in neoplasia. Nat Rev Cancer 8, 915–928 (2008).
37. Im, S. S. et al. Peroxisome proliferator-activated receptor {alpha} is responsible for the up-regulation of hepatic glucose-6-phosphatase gene expression in fasting and db/db Mice. J Biol Chem 286, 1157–1164 (2011).
38. Chanda, D., Xie, Y. B. & Choi, H. S. Transcriptional corepressor SHP recruits SIRT1 histone deacetylase to inhibit LRH-1 transactivation. Nucleic acids research 38, 4607–4619 (2010).
39. Im, S. S. et al. Glucose-stimulated upregulation of GLUT2 gene is mediated by sterol response element-binding protein-1c in the hepatocytes. Diabetes 54, 1684–1691 (2005).
40. Lee, J. H. et al. Overexpression of SIRT1 protects pancreatic beta-cells against cytokine toxicity by suppressing the nuclear factor-kappaB signaling pathway. Diabetes 58, 344–351 (2009).
41. Lee, H. M. et al. Acromegaly with Normal Insulin-Like Growth Factor-1 Levels and Congestive Heart Failure as the First Clinical Manifestation. Endocrinol Metab (Seoul) 30, 395–401 (2014).
Acknowledgements
We thank Dr. Timothy F. Osborne (Sanford-Burnham-Prebys Medical Discovery Institute, FL, USA) and Dr. Yong-Ho Ahn (Yonsei University College of Medicine) for helpful discussion and reading critically. This study was supported by a grant of the Korea Health Technology R&D Project, Ministry of Health & Welfare, Republic of Korea (No. A120864) and supported by the National Research Foundation of Korea (NRF) Grant funded by the Korean Government (MSIP) (No. 2014R1A5A2010008) to S.S.I. This research was supported by Basic Science Research Program through the National Research Foundation of Korea (NRF) funded by the Ministry of Education (No. 2015R1D1A1A01057610) to H.S.K.
Author Contributions
H.S.K. and H.C.C. contributed to the design and performance of experiments, analysis and interpretation of data, writing the draft; J.H.L., G.T.O., S.H.K., B.H.P., I.K.L. and H.S.C. contributed to the performance of experiments, analysis of experimental results; H.S.C. and D.K.S. contributed to the analysis and interpretation of data, and critical review of the manuscript; S.S.I. contributed to the conception and design of the experiments, wrote the manuscript and critical review of the manuscript. S.S.I. is the guarantor of this work, as such, had full access to all of the data in the study and takes responsibility for the integrity of the data and the accuracy of the data analysis.
Additional Information
Supplementary information accompanies this paper at http://www.nature.com/srep Competing financial interests: The authors declare no competing financial interests.
How to cite this article: Kang, H. S. et al. Metformin stimulates IGFBP-2 gene expression through PPARalpha
This work is licensed under a Creative Commons Attribution 4.0 International License. The images or other third party material in this article are included in the article’s Creative Commons license, unless indicated otherwise in the credit line; if the material is not included under the Creative Commons license, users will need to obtain permission from the license holder to reproduce the material. To view a copy of this license, visit http://creativecommons.org/licenses/by/4.0/