A National CGE modeling for
Resource Circular Economy
∣ KEI❘2006❘WO-02∣Research Staff Leading Researcher Sang In Kang (Korea Environment Institute) Jae Joon Kim (Korea Environment Institute) Participating Researcher Toshihiko Masui (National Institute for Environmental Studies)
Copyright ⓒ 2006 by Korea Environment Institute
All rights reserved. No part of this publication may be reproduced or transmitted in any form or any means without permission in writing from the publisher Publisher Suh Sung Yoon Published by Korea Environment Institute 613‐2 Bulgwang‐Dong, Eunpyeong‐Gu, Seoul, 122‐706, Republic of Korea Tel.(822) 380‐7777 Fax.(822) 380‐7799 http://www.kei.re.kr, http://eng.kei.re.kr
Published and printed in Aug. 2006 ISBN 978‐89‐8464‐217‐1 93530
Foreword
In spite of the lack of available data and appropriate econometric estimates, quantitative modeling approach based on the general equilibrium theory is widely used to understand the linkage between economy and environment.The Korea Environment Institute, enhancing its science based analytical capacity through international cooperative research program, contributes to develop more robust quantitative analytical tools designed for the integrated economic and environmental policy research area.
This report is one of the joint research results made by the Korea Environment Institute and the National Institute for Environmental Studies of Japan. The national computable general equilibrium model presented here shares the basic fundamentals with the AIM‐material model developed by the NIES for a quantitative analysis of economic feedbacks from environmental policy intervention to promote environmental industry.
In the model with computable general equilibrium and recursive dynamic framework managing pollution activities are integrated as an independent economic sector through which diverse wastes from production process become a primary recycled input resources. I believe that this type of quantitative approach opens a new way to understand better the role of environmental investment promoting environmentally sound and sustainable growth.
I would like to thank Dr. Sang In Kang and Mr. Jae Joon Kim of KEI for their devotion in this study, and my special thanks goes to Dr. Toshihiko Masui for his excellent contribution and spirit of collaboration to this study. Suh Sung Yoon President Korea Environment Institute.
Abstract
We are well aware that economic growth has degraded environment and depleted natural resources. Global warming, deforestation, depletion of the ozone layer and other primary resources threaten of ecosystems and human life.
Due to strict environmental regulation, it is becoming important to quantify the costs and benefit of environmental and economic policy intervention to promote open and non‐discriminatory global market system together with the sound and sustainable ecosystem. General equilibrium model is widely accepted as a quantitative analtical tool for integrated economics and environment impact analysis in recent years.
In spite of many researches on the effects of domestic environmental policy and its economic implications, the environmental policy feedback mechanism at national or global economy level doesn’t seems to fully integrated into a CGE model. This is partly because of the difficulty in collecting and setting up a necessary empirical database. But the main challenge rests still on the way of evaluating and linking material flow to monetary transaction in a CGE model.
This research is to elaborate a Korean national CGE model based on the Asia Integrated Model‐Material/CGE developed by the National Institute on Environmental Studies in Japan, designed for the evaluation of environmental policy impacts on the national economy under given environmental regulation scheme challenging global environmental issues such as global warming.
In the current modeling work for Korean economy in 2000, ○1 we make a social accounting matrix including industrial waste management as an economic activity with its input data, ○2 we elaborate a waste material flow on 19 waste types, balancing waste generation from production activity, recycling through waste management process, and final discharge, and ○3 we construct a national CGE model with GAMS‐algebraic subsystems instead
of GAMS‐MPSGE which was used in AIM/Material/CGE, and solve the model equilibrium with MCP solver. To link the physical energy input with CO2 emission, we get energy demand data from the yearbook of energy statistics 2001 and use the coefficient of carbon ton per unit ton of energy (TC/TOE). Waste generation, recycling and final disposal data are obtained from various statistical sources including census and annual reports of relevant ministries and agencies.
Benchmark replication check for the base static model was completed successfully without any problem. The base model can be used for various empirical simulation researches on the impact of environmental and economic policy intervention.
The current study does not introduce a dynamic version of the base static model, although it includes variables and parameters necessary to extend the base model in the form of recursive dynamic one. The extension of the base model with a recursive dynamic module remains for further work to be taken.
|Contents|
FORWARD ABSTRACT I. Introduction ...1 1. Computable General Equilibrium ...1 2. Integrated Environmental and Economic Model ...2 3. AIM/Material/CGE Modeling...5 II. Integrated National CGE modeling for Korea...11 1. Pollution Management and Waste Recycling ...11 2. Data ...16 A. SAM...17 B. Waste Flow ...19 3. Model...25 A. Structure ...25 B. Equations...29 III. Conclusion ...41 References...43 Appendix1: Recursive Dynamics in AIM CGE ...46 Appendix2: Main Data Sheets ...47 Appendix3: GAMS Programming Code ...59 국문요약 (Abstract in Korean) ...79| Tables |
Table I‐1. AIM/Material/CGE Simulation Scenarios ...10
Table II‐1 Difference between AIM/Material/CGE and INCGE_Korean ...16
Table II‐2 Data and Sources...17
Table II‐3. Activities and Commodities ...25
Table II‐4 Notational Principles ...29
| Figures |
Figure I‐1. AIM/Material/CGE Production structure...7 Figure I‐2. Waste flow in AIM/Material ...9 Figure II‐1. Industrial Waste Flow in Korea ...20 Figure II‐2. Compilation Procedure for Waste Flow v (make matrix)...21 Figure II‐3. Compilation Procedure for Waste Flow u (use matrix) ...22 Figure II‐4. Aggregated Social Accounting Matrix ...23 Figure II‐5. Diagram of the Integrated National CGE (Korean) Model ..24 Figure II‐6. Flow of Economy: Goods, Services, Factors and Pollutions 28I. Introduction
1. Computable General Equilibrium
With recent development of the mathematical programming tool and numerical method, the economic model dealing with large empirical data and statistics of various accountings has enabled us to analyze economic and environmental policy implications in an integrated quantitative manner. Computable general equilibrium model set up on the general equilibrium theory is one of the major numerical analysis methodologies to find an economic equilibrium point with which divers economic and environmental policy impact can be simulated.
Since the most eminent mathematical work on the general equilibrium theory with its application to CGE modeling analysis was introduced by Scarf (1973), lots of researchers have worked to find more efficient algorithm for solutions with numeric general equilibrium model. With a series of contribution made by Scarf, Shoven and Whally(1973, 1984, 1992) in the field, CGE models have been used for quantifying the impacts of economic and environmental policy interventions to the economy, international trade and environment at national and global level.
In spite of the weakness fron insufficient data and appropriate econometric estimates1, CGE model, firmly based on the established economic theory i.e.
the general equilibrium theory, seems to compete well with another type of empirical analysis tool such as economy wide econometric modeling approach. The major virtue of CGE approach relative to econometric approach is that 1 Jorgenson, ‘Econometric methods for applied general equilibrium analysis, in H.E Scarf and J.B. Shoven. Eds, Applied general equilibrium analysis, New York: Cambridge Univ. Press, pp. 139~203.
the need for data is not necessary required in econometric model. Especially, CGE model can offer insight into the likely effects of shocks for which there is no historical experience, for example, a sharp increase of oil prices in 1973 which the applicability of an econometric model highly dependent on time‐series data is quite limited.2 In the case of CGE model including oil
prices as variables in production functions, the impacts of price increase can easily be simulated in the same way as increasing prices of other inputs.
In fact, CGE modeling has been established a field of applied economic research area which we can easily incorporate divers analytical issues developed in modern macro and micro economic theory into a quantitative model. Actually, quantitative analysis model ranging from simple Leontief type input‐output model to more elaborated CGE model is widely used in the applied economic studies on the impacts of policy intervention, especially in environmental and resource economics.
The recent progress in the data availability and its compilation at the same time with the development of programming tools such as GEMPACK and GAMS3 contribute also to the wide use of CGE model as one of the most
important quantitative analysis tools for integrated policy studies in the
economy and environment area.
2. Integrated Environmental and Economic Model
More and more we recognize that economic growth harms environment and exhausts natural resources. Global warming, deforestation, depletion of the ozone layer and other primary resources threaten ecosystems and human life. Since then the World Summit on Sustainable Development in 2002 endorsed the importance of mutual supportiveness between environmental
2 Peter B. Dixon and B.R. Parameter, ‘Computable General Equilibrium Modeling for Policy Analysis and Forecasting’, Handbook of Computational Economics, V. 1, Chapter 1. p 7~8.
3 GEMPACK ( General Equilibrium Modeling Package), GAMS( General Algebraic Modeling System)
protection and promotion of sustainable development, the environmental impacts of economic policy have become critical agenda at global, regional and national level.4
Facing the challenge to enforce more restrictive national and global environmental regulation, all the policy decision makers eager to identify the economic and environmental impacts of such regulations in a quantitative manner to perform cost benefit analysis. They want to assure that the environmental and economic policy interventions promote a mutual supports between the open and non‐discriminatory global market system and the sound and sustainable ecosystem.
More strict environmental regulations, such as large emission reductions or mitigations of greenhouse gas, tend to increase production costs in most economic sectors at national and regional level.5 The relative price change of
fossil energy related products leads general equilibrium effects throughout the whole economy. This is why recent empirical studies on the climate change often use CGE model in evaluating the effect of countervailing environmental policy measures on national and global economy.
Besides the global environmental issues such as climate change, each individual country faces with domestic or local environmental issues such as waste management, local air pollution control, and waste water management etc. Policy interventions against to these environmental problems are often closely related to each other and they can contribute to create diverse ‘ancillary benefits’ such as health improvement, longer life expectancy and decrease of premature death etc.6 It seems evident that these ancillary
4 Kang and Kim et all, A Comparative Study on the Environmental Impact of Korea‐Japan Free Trade, 2004, Re‐11, KEI, p 1‐2.
5 Zhang Xiang and Folmer Henk, ‘Economic Modeling approaches to cost estimate for the control of carbon dioxide emission’, Energy Economics, 1998.
Kang S.J, ‘ The modeling study of the energy‐economy‐environment system’ Korea Energy Economic Institute, 99‐12, 1999.
Kim et all, ‘The effects of imposing carbon tax on the economy, the environment and the health in Seoul’, Environmental and Resource Economics Review Vol 11, Num 1, Mar 2002.
6 Kseniya Lvovsky and Gordon Hughes, ‘Environmental Challenges of Fuel Use’, Pollution Management Discussion Notes No7,, World Bank, 1999.
benefits needs to be dealt with properly in the cost‐benefit analysis for a given policy intervention and the use of CGE type modeling approach including diverse ancillary benefits would be very important.
In the case that the government policy intervention promotes environmental protection activity including recycling as well as management of waste treatment and final disposal, those environmental activities can be considered as a new business opportunity. The role of environmental regulation as a creator of environment industry also needs to be fully evaluated, as the pollution management sector represents an independent economic activity per se in modern economy.
In spite of many researches made so far on the effects of domestic environmental policy and its economic implications using CGE model(Shin, 1997, Kang S.J, 1999, Joe et al, 2000, Kim et al, 2002), the environmental policy feedback mechanism at national or global economy level doesn’t seem to integrate into a CGE modeling approach. This is partly because of the difficulty in collecting and setting up a necessary empirical database. But the main challenge rests still on the way of evaluating and linking material flow of recycling materials to monetary transaction of conventional goods and services in a CGE model.
This is one of the main motives of our current research focusing on the identification of material flow regarding waste management and of environmental capital goods in the national economic accounts. Our research goal is to identify waste recycling activities as an independent economic activity and integrate it into a recursive dynamic CGE model.
For this, we elaborate a Korean CGE model based on the AIM/Material/CGE developed by the NIES in Japan, which is designed to evaluate an environmental policy impacts on the national economy under certain environmental regulation framework challenging global
Richard F. Garbaccio, Mun S. Ho, and D. W. Jorgenson , ‘The Health Benefit of Controlling Carbon Emission in China’, Kennedy School of Government Harvard University, MA 02138, Cambridge, Feb 2000.
Chestnut, Lauraine G., Ostro, Bart D, et al, ‘Transferability of air pollution control health benefits estimates from the United States to Developing Countries’, American Journal of Agricultural Economics, Vol. 59, Issue 5, P 1630, 1999.
environmental issues such as global warming.7
In the section below, we present the basic structure of simple AIM/Material/CGE model and its application to greenhouse gas mitigation policy impacts.
In chapter II, we will introduce a Korean CGE model developed by the joint research group of KEI and NIES based on AIM/Material/CGE with its data and full diagram of activity and commodity flow. The difference between AIM/Material/CGE and the Korean model will be detailed. Also, we present the system of equations in mathematical form which applied in our model programming. In chapter III, we present some simulation results using a static model and and identify the limits of current study and future works.
3. AIM/Material/CGE Modeling
The AIM/Material/CGE model, a country based CGE model with recursive dynamics is developed by Masui 8 in NIES (National Institute forEnvironmental Studies), Japan. It was used for an empirical study on the economic impacts of environmental policy intervention regarding CO2 reduction and solid waste management targets.
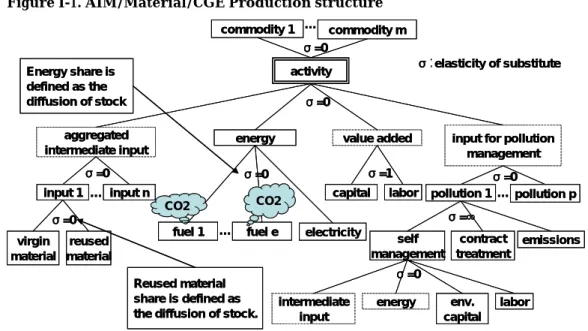
Figure I‐1 shows the production structure embedded in the model. The model follows the conventional CGE approach regarding the treatment of products and inputs. Labor and capital as a primary input for value added enter the Cobb‐Douglas type production function. The value added product together with the composed intermediate goods, composed energy goods and
7 AIM/Material, a bottom‐up model integrating economic and environmental dimension of Japanese economy and AIM/Material/CGE model, a top‐down model based on the AIM/Material model was developed by the research group in National Institute for Environmental Studies, Japan, see T. Masui(2000a).
8 Toshihiko Masui, ‘Policy Evaluations under Environmental Constraints using a Computable General Equilibrium Model’ National Institute for Environmental Studies. masui@nies.go.jp
composed pollution enters a Leontief type production function for final goods and services.
With regard to the integration of the environmental protection activities and the emission of pollution, the model treats the pollution as an input in production process. For example, composed pollution goods produced with divers primary pollutions enter as an input in final goods and services. In this way, environmental policy target such as reduction of CO2 emission or pollution (or waste) emission could be interpreted as a physical restriction on the amount of CO2 input or pollution input.
And then the production of primary pollution, represented by 3 types of pollution management mode: Self management, Contract management and Discharge, uses intermediate goods, energy, environmental capital and labor as input. As the elasticity of substitution among the 3 types of pollution management in the model was assumed infinite, the model did not differentiate in fact each type of pollution management mode.
Figure I-1. AIM/Material/CGE Production structure
commodity m
activity
input 1
energy
capital labor pollution 1 value added
input n aggregated intermediate input
…
input for pollution management pollution p … commodity 1 … σ=0 σ=1 σ=0 σ=0 σ=0 electricity fuel 1 … fuel e σ=0 virgin material reused material σ=0 σ:elasticity of substitute env. capital labor energy intermediate input σ=0 self management contract treatment emissions σ=∞ Energy share is defined as the diffusion of stock Reused material share is defined as the diffusion of stock.
CO2 CO2
As to the material feedback recovered after waste recycling, the model assumed that the recycled materials (or goods) entered the production of intermediate goods at the same time with produced goods. The elasticity of substitution between produced goods and recycled goods was assumed to be 0 and the share of recycled material depends on the diffusion of capital stock. In Spite of the pollution management activities and composed pollution goods including CO2 as well as recycled materials was very sophisticatedly designed in the model conception stage, the 3 different activities managing pollution were integrated into one waste management sector in the actual model for the simplicity. Finally the linkage between recycled materials used as intermediate input for composed intermediate goods in the model was assumed to be products of waste management sector using intermediate goods, energy, capital and labor as input.
Regarding technological innovation resulting in input efficiency such as energy efficiency and waste management efficiency, it was assumed that the elasticity of substitution among all inputs is to be zero except two primary inputs for value added production. Although the energy input share is fixed
in advance, this value can be changed by the introduction of new equipment in the long term. It means that in a short term, the substitution of energy input and recycled waste does not occur as the investment efficiency is not changed. The technological efficiency improvement can be introduced then in an exogenous manner with the estimate coming from bottom‐up approach to the related technology. The basic AIM/Material/CGE model assumed also that the elasticity of substitution for the Armington9 technology is to be zero.
Figure I‐2 shows the latest version of waste flow structure in AIM/Material model developed by NIES. Wastes are handled in three ways, self management (intra firm), contract‐out management through specialized sewage or waste management company, and discharge without treatment into environment, in which an upper limit is set on direct discharges so as not to violate the domestic environmental regulation. Solid wastes are disaggregated into industrial waste and municipal waste. Each waste generation enters the process of direct reuse, direct final disposal, and intermediate management. The residuals from intermediate management are reused or disposed. Total reused wastes are supplied to the market as recycled materials. As we can see from figure I‐1, recycled wasted are used as intermediate inputs in the specific production sectors. For example, ash is used in the construction sector, the ceramic, stone, and clay products sector. Quantification of this kind of flow of recycled waste depends highly on the availability and reliability of the raw data on the recycled material output from waste management sector and the recycled material input to specific production sector.
In its empirical simulation form, the AIM/Material/CGE model adopted a simplified waste flow structure and integration of the waste flow was done in exogenous manner. 9 The elasticity of substitution between supply goods, domestic and imported goods is to be zero. The price of import and export goods is set exogenously as numeraire.
Figure I-2. Waste flow in AIM/Material Production Industrial wastes (18 types) Municipal wastes (8 types)
Household Municipal wastes (8 types) Self management Recycle Fin. disposal Ind. waste man. sector Int. man. Dir. reuse Dir. disposal Mun. waste man. sector Int. man. Dir. reuse Dir. disposal Recycle Fin. disposal Recycle Fin. disposal Production Industrial wastes (18 types) Municipal wastes (8 types)
Household Municipal wastes (8 types) Self management Recycle Fin. disposal Ind. waste man. sector Int. man. Dir. reuse Dir. disposal Mun. waste man. sector Int. man. Dir. reuse Dir. disposal Recycle Fin. disposal Recycle Fin. disposal In the use of the model for policy impact simulation, such as CO2 reduction or waste reduction targets, the model designed several scenarios detailed in table I‐1. The results shows that the economic loss resulting from heavy regulations such as reduction of final solid waste disposal and CO2 reduction under the Kyoto Protocol amounted to 0.2% of GDP estimate in 2010 compared to BAU (Business As Usual) case. The study also found that a series of mixed environmental policy counter measures made Japan recover about 55% of its GDP loss due to enhanced environmental regulation.
It was also shown that, in addition to the 0.2% GDP loss in 2010 from stricter environmental regulations (Scenario2) in place, raw material production sectors suffer more severely from environmental constraint. But the restriction on the solid waste disposal stimulated waste recycling activities. Increased environment investment gave environmental industry and waste management sector a direct promotion effect and as a result the activity level of related sectors was enhanced.
countermeasure might have a negative impact to other environmental issues such as air quality, in the case that the countermeasure contributed to the increase of fuel energy consumption. But the author there focused on the point that diverse environmental policy counter measures could mitigate the burden of stricter environmental regulation.
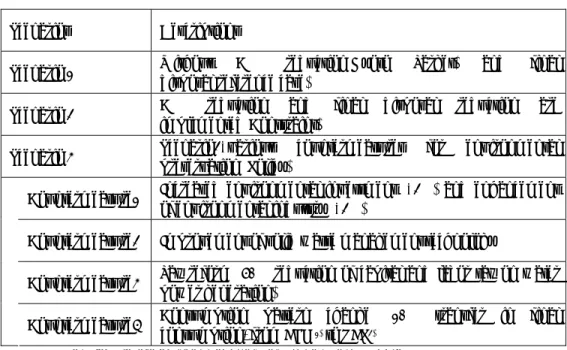
Table I-1. AIM/Material/CGE Simulation Scenarios
Scenarios Descriptions
Scenario 1 Without CO2 reduction(Kyoto Target) and final disposal(reference case)
Scenario 2 CO2 reduction and final disposal reduction are implemented(Constraint)
Scenario 3 Scenario2+various countermeasures for environmental preservation (Policy)
Countermeasure1 Increased environmental investment (+2%) and enhancement of environmental industry (+2%)
Countermeasure2 Improvement of solid waste management technology
Countermeasure3 Tax reform (50% reduction of capital and labor tax on water power generation)
Countermeasure4 Consumption pattern change (10% transfer in final consumption, from ELM1) to REP2)
1) ELM: Manufacture of electrical machinery, equipment, and supplies 2) REP: Car and machinery repair
II. Integrated National CGE modeling for Korea
1. Pollution Management and Waste Recycling
The current Korean national CGE model is elaborated based on a similar framework of the AIM/Material/CGE model, designed as a quantitative analysis tool for impacts of environmental regulation on the national environment and economy.
One of the main characteristics of the AIM/Material/CGE is that the model introduced material flow of waste from generation and recycling to final disposal. And what is more, the model includes pollution and other environmental effluent such as greenhouse gases as input to the production. This enables the model to analyze the impact of restrictive policy intervention on the pollution effluent or green house gas emission. This represents an important advance in modeling exercise compared to the precedent studies focusing on the simple impact from level change of industrial activities to induced environmental pollution effects.
Originally in its theoretical form, the AIM//Material/CGE considers waste management activity as an independent economic sector in the model. The role of the sector is then to recycle the materials recovered from waste treatment and disposal process. The recycled materials are used as an intermediate input to form the intermediate composite goods, made of both produced and recycled products. 10 But this type of waste recycling structure
needs detailed waste output and input flow accounts, which are not always available for Korean as well as Japanese case. And this is why the empirical version of the AIM//Material/CGE used a simplified waste flow structure and 10 Waste material flow means that the produced or generated wastes are treated by self or contract management process, direct reuse, disposal (emission, dump). For more detail, see the next chapter
integration of the waste flow was done in exogenous manner.
Instead, the AIM//Material/CGE introduces an environmental capital good production activity as a production sector of which the output is used as intermediate good. The environmental capital good sector is designed for capturing the proactive policy intervention impact on the efficiency of waste management activities. A policy intervention increasing the supply of environmental capital goods would produce positive impact on the economic and environmental performance in the model simulation.
In Korean model, we introduce an environmental pollution management sector (A29) instead of the environmental capital good sector in Japanese model. The environmental pollution management sector is a service sector of which the role is to provide pollution management services to other conventional economic sectors. The activity of this sector relates to the effective implementation of the national environmental regulation by each economic sector. It is assumed that the current level of the pollution management sector assures that the all the economic sectors meet the standard by the national environmental regulation.
With regards to the treatment of wastes generated from economic sectors, we take a similar approach to that of Japanese empirical simulation model. We assume that once after recyclable materials are extracted from wastes generated, the residuals of waste are dumped to the environment as final waste disposal. In fact the activity level of environmental pollution management sector may relate to the level of waste recycling. But the recycling activity needs to be treated in a different manner from environmental pollution management activity, as the output of recycling sector is not a service but a manufactured good.
Compared to conventional production activity, the recycling sector takes waste as primary input, which does not have any economic value in itself as it is considered as a kind of pollution effluent instead of a product. The recycling sector employs then labor and capital as other primary inputs and purchases other intermediate inputs from other sectors. The recycled waste, i.e. the output of recycled sector, is a product having economic value and entering production process as intermediate recycled products with other
produced intermediate products as it is in AIM/Material/CGE model. 11
Integrating recycling sector as an independent economic activity in the model poses substantial technical difficulties. In the case that the recycling process can be treated as an independent manufacturing sector, the output of the recycling sector in fiscal year
t
enters the production process of the same fiscal year. In this case, the activity level of recycling sector will be determined based on the market price based decision‐making process within the model. And the impact of a proactive recycling policy intervention can be dealt with in a simple comparative static model.But if we suppose that the output of recycling process in fiscal year
t
is a recycled material resource entering the production process of the fiscal year1
+
t
as a primary input as like labor or capital, the recycling process can be considered as a primary resource (development) sector. In this case, we do not necessarily need to elaborate a recycling process as a manufacturing sector employing labor, capital and other intermediate products.The current Korean model follows the second case, and it introduces recycling process with recycled waste flow accounts composed of ‘v matrix and u matrix’12 of 19 waste types for 32 sectors and 37 commodities. The model can’t take into account the recycling process as a separated economic sector due to the lack of necessary data on the use of primary and intermediate inputs of the sector. It means that the waste generation from economic activity and its recycling in Korean model are compiled as separated u and v matrix for a fiscal year
t
. And the recycled materials are used as primary input in the production process of next fiscal yeart
+
1
.Besides of environmental pollution management sector and waste recycling process dealt with exogenously, the current Korean model introduce a concept of environmental capital resulting from investment on the physical facilities for environmental pollution control following a similar approach of Japanese case. In the model, environmental investments (Ienv) are factored out
11 In fact, the theoretical form of AIM/Material/CGE treat waste management sector as a manufacturing sector producing recycled intermediate products, even if the empirical simulation version of the model does not introduce explicitly the theoretical dissertation as an executable code.
of conventional investment data.
Even if the current static version of Korean model does include neither variables on fixed environmental capital stock (Kenv) and relevant environmental capital services (kenv) nor the specific link among environmental investment, environmental capital stock and relevant environmental capital services, we assume that level of environmental investment relates to the efficiency of environmental pollution management performance of the economy
In fact, if we factor out environmental investments from common investment (Icom), it is natural that there should be two types of capital stock, i.e. the one for common capital stock (Kcom) and the other for environmental capital stock (Kenv) together with their relevant capital services (kcom and kenv) as a primary input for the production.
In the case that environmental pollution management activity takes either the form of self ‐management process within a given manufacturing sector or contracted‐out management by a specialized pollution management sector, this type of capital division is appropriate approach for including the role of environmental investment in the integrated model, as each economic sector needs to have certain amount of environmental capital stock (or pollution treatment facility) for self‐management of pollution effluent. But the modeling this type of division poses still substantial challenge for compilation of relevant data on the stock and flow of sectoral investment and capital.
One way to circumvent practical difficulties is that we assume that all the pollution management activities take a form of contracted‐out pollution management by a specialized sector, for example, the sector A29 in the current Korean model. In this case, environmental capital accumulation through environmental investment and its use as a primary input (environmental capital services) are limited to the pollution management sector A29. Even though the current Korean static model does not include environmental capital and its relevant services in the model, a recursive dynamic extension of the static model can take this type of environmental capital treatment in its modeling.
Major differences of the current model compared to AIM/Material/CGE are presented in Table II‐1. The AIM/Material/CGE model uses GAMS/MPSGE as
a programming tool, but the current Korean model is programmed in GAMS conventional programming language with variables and equations. The AIM/Material/CGE model has 49 commodities and 41 activities. It integrates material flows of CO2 as well as 18 types of industrial and municipal wastes. Due to limited data sources and lack of sufficiently disaggregated data, the current Korean model has only 37 commodities from 32 activities. But it deals with 19 types of industrial wastes and CO2 as pollution effluent. In its recursive dynamic extension, the AIM/Material/CGE model assumes that all the initial equilibrium prices for goods and services are equal to 1 for the initial year, and it maintains the same price assumption for the subsequent years. The subsequent equilibrium points are calculated based on a new social account matrix integrating technological progress. The technical progress is introduced exogenously and interpreted by increased input efficiency or increase of recycled intermediate materials extracted from wastes by waste recycling process during the precedent year.
Table II-1Difference between AIM/Material/CGE and INCGE_Korean
AIM/Material/CGE INCGE_Korean Reference
Code‐algorithm Solver GAMS‐MPSGE Mcp1 (path) GAMS‐algebraic Mcp (path, miles) Activity Commodity Waste flow 41 activities (V) 49 commodities (U) CO2 Industrial waste Municipal waste (18 types of waste) 32 activities 37 commodities CO2 Industrial waste ( by 19 waste types)
Env. Sector Environmental Capital Formation Sector Environmental Pollution Management Sector Pollution Emission Top‐Down: Total emission is allocated by
activities or
commodities
Bottom‐Up: Total emission level is calculated based on sectoral unit ton per TOE2 1. Mixed Complementarity Problem (solver for GAMS system) 2. TOE: Ton of Energy, 1 TOE = 10^7kcal
2. Data
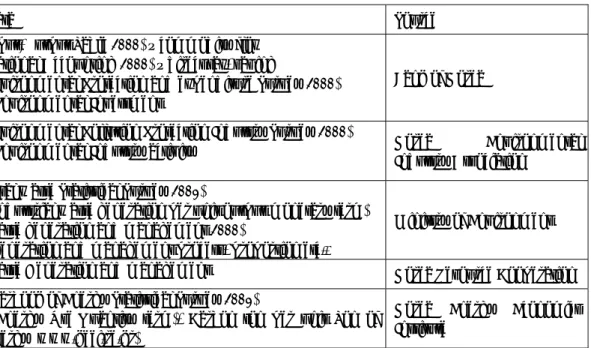
To construct a national CGE model integrating environmental pollution management and industrial waste recycling process with other economic activities in order to analyze resource circular economic impacts of domestic environmental policy, we elaborated a social accounting matrix (SAM) based on various economic and environmental data sources including Input‐Output table for the fiscal year of 2000, relevant national accounting reports and yearbooks of Energy Statistics. In the SAM, environmental pollution management sector was separated from other conventional industry sectors.
Disaggregating of energy sector by energy product types was also considered in order to analyze the effect of CO2 reduction policy intervention
on economic activities. The table II‐2 shows the data and source used to the benchmark test and simulation of the model. Most of economic data come from the Bank of Korea. For the environmental protection activities and waste management flow, we counted on multiple data sources from the Korean Environmental Industry Association, Ministry of Environment, Korea Resource Cooperation, and Korea Energy Economics Institute.
Table II-2Data and Sources
Data Source Input‐Output Table(2000) – commodity flow National Accounting(2000) – direct tax, saving Environmental Protection and expenditure Survey(2000) ‐ Environmental Investment Bank of Korea Environmental Pollution Protection Industry Survey(2000)
‐ Environmental Industry activity Korea Environmental
Industry Association Total waste Statistical Survey(2001) ‐ Industrial waste generation per unit output(monetary term) Waste generation and management(2000) ‐ generation and management process, proportion etc.. Ministry of Environment Waste Generation and management Korea Resource Cooperation Yearbook of Energy Statistical Survey(2001)
‐ Energy Use(Quantity term), Carbon ton per unit Ton of Energy (www.keei.re.kr)
Korea Energy Economics Institute
A. SAM13
SAM shows a cross sectional view of whole national economy. The AIM/material for CGE deal with production (activity) and commodity (level) separately. All the activities and commodities are summarized in the form of V (make) and U (use) matrix, representing respectively supply and demand of the economy.
But Korean Input‐Output table in official publication gives only information on industrial transaction measured by commodity type. It does not differentiate commodities from activities. As a result, the table may have cells with some negative value for intermediate input, value added, and final demand including fixed capital formation.
It is necessary then to elaborate V and U matrix from I‐O table of Korea, and we use following procedures.14 ○1 Start ‐> IO table: Basic data Commodities IO table 1 2 3 Final demand sum 1 X11 X12 X13 F1 Y1 2 X21 X22 X23 F2 Y2 Commodity 3 X31 X32 X33 F3 Y3 Value added Xv1 Xv2 Xv3 Sum Y1 Y2 Y3 ○2 IO table with negative input Commodities IO table 1 2 3 Final demand sum 1 N11 NF1 2 N23 Commodity 3 N31 Value added Sum
14 We appreciate very much the valuable advices of Dr. Masui in NIES Japan for the elaboration of the Korean V and U matrix.
○3 V matrix, Vji(j=i) = Yj‐Nij, Vji(i=/=j) = ‐Nij
Commodities IO table 1 2 3 sum A Y1-N11 - N31 Qa B Y2 Qb Activity C - N23 Y3 Qc FD Nv2 Sum ○4 U matrix from IO (input) Ujj) = Xij Commodities IO table A B C Final demand sum A U11 U12 U13 F1 Y1 B U21 U22 U23 F2 Y2 Activity C U31 U32 U33 F3 Y3 Value Uv1 Uv2 Uv3 Sum Qa Qb Qc B. Waste Flow
As we pointed out in the previous section, we compiled waste data on generation, reuse and recycling, and final disposal for 19 types of waste. We found there that a amount of waste materials are generated from economic activities and a large part of them is taken into the production process as recycled intermediate input.
In this section describes Korea waste treatment and flow structure from generation and recycling to final disposal. We show also how to supply
(generation) and use (reuse and recycling input) data for industrial waste from production activity by 19 waste types.
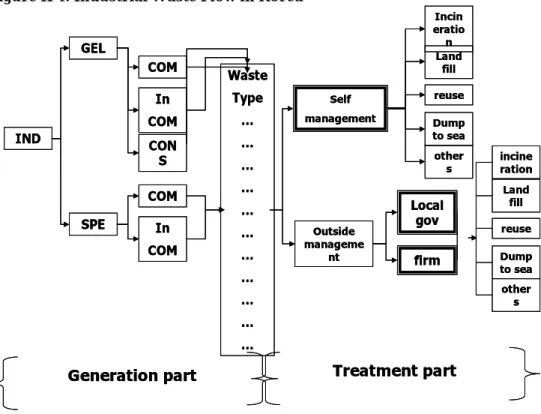
Figure II-1. Industrial Waste Flow in Korea
IND GEL SPE COM In COM CON S Waste Type … … … … … … … … … … …
Generation part Treatment part
Self management Outside manageme nt Incin eratio n Land fill reuse Dump to sea other s Local gov firm incine ration Land fill reuse Dump to sea other s COM In COM IND GEL SPE COM In COM CON S Waste Type … … … … … … … … … … …
Generation part Treatment part
Self management Outside manageme nt Incin eratio n Land fill reuse Dump to sea other s Local gov firm incine ration Land fill reuse Dump to sea other s COM In COM
IND: Industry, GEL: General waste, SPE: Specific waste, COM: Combustible waste, InCOM: Incombustible waste, CONS: Construction waste
In the modeling work, we take into account only the industrial waste flow as it is in figure II‐1. Industrial waste materials are disaggregated into two categories: general waste and specific waste. Each waste category is composed of three types of waste: combustible, incombustible, and waste from construction. We can get the ton/year waste generation data by waste type.
There exist two types of waste treatment: self‐management with own environmental facilities and contracted‐out management by specialized pollution management firms. In Korea, the responsibility of industrial waste treatment and final disposal falls on the waste generating company and the
wastes are treated by governments with public treatment facilities or specialized waste management firms in the case that the waste is not handled with by self‐management. The waste materials not recovered or recycled are taken into the final disposal process composed of incineration, dump to the sea or landfill site etc.
We can get the value of total waste generation from industry from waste generation and management database compiled by the KMOE. But the total value of industrial waste generation and treatment isn’t disaggregated into each of industrial activities. We then on ad‐hoc based sectoral waste survey data held in KEI. Data on sectoral waste recycling comes from the database managed by ENVICO.
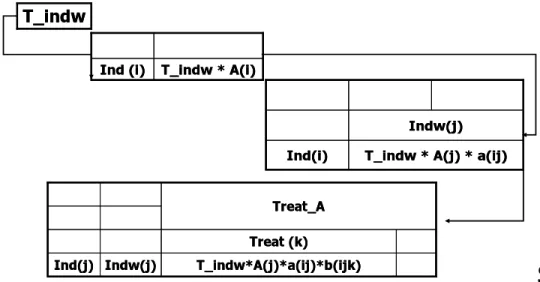
Figure II-2. Compilation Procedure for Waste Flow v (make matrix) T_indw
T_indw
T_indw * A(i) Ind (i) T_indw * A(i) Ind (i)
T_indw * A(j) * a(ij) Ind(i)
Indw(j) T_indw * A(j) * a(ij) Ind(i) Indw(j) T_indw*A(j)*a(ij)*b(ijk) Indw(j) Ind(j) Treat (k) Treat_A T_indw*A(j)*a(ij)*b(ijk) Indw(j) Ind(j) Treat (k) Treat_A
Figure II‐1 shows the matrix of waste treatment by industries and waste types. We used total waste generation value (T_indw) compiled by KMOE. Total waste generation T_indw is then distributed to each industry sector as a sectoral waste generation value by waste type (T_indw
×
A(i)×
a(i,j)) with the help of distribution coefficient A(i) and a(i,j) for industry i and waste type j, calculated based on the KEI’s waste survey data. We then get a sectoral waste data by treatment method (T_indw×
A(i)×
a(i,j)×
B(i,j,k)) usingmanagement method coefficient
b
ijk, for treatment methodk
, waste typej
, and industryi
. From the sectoral waste data by treatment method in figure II‐1, we finally factor out the reused value of recycled waste material (T_indw×
A(i)×
a(i,j)×
B(i,j,reuse)) as a form of v matrix (make matrix).The reused value of a recycled waste material represents in fact a total recycled input value of the material recovered. Figure II‐3 shows the procedure to find the waste flow in the form of u matrix (use matrix).
Figure II-3. Compilation Procedure for Waste Flow u (use matrix)
Δ
-recycling
Self management By gov… Treat Ind_w … B04… A02… B02 B01 A01 waste sectors … D-disposal Δ -recycling
Self management By gov… Treat Ind_w … B04… A02… B02 B01 A01 waste sectors … D-disposal Recycled waste commodity B02… - Δ B02 B01 A02… A01b A01a Recycled waste commodity B02… - Δ B02 B01 A02… A01b A01a Substitute ->> A03 A02 - Δ A01 sectors A02… A01b A01a
Commodities substituted by recycling goods A03 A02 - Δ A01 sectors A02… A01b A01a
Commodities substituted by recycling goods
Used by input factor
Finally figure II‐4 and Figure II‐5 shows the structure of aggregated social accounting matrix and the structure of the static computable general equilibrium model developed during this research.
Factor supply Factor Demand factor inflow Invest-ment expenditure Supply Purchase Total outflow closure Import Foreign Saving Saving G Saving p Capital (saving) Revenue Tax (direct) Tax on import Tax (indirect) Public Income Transfer income Private demand Export invest Consume Consume Market Sale Producer total Foreign Capital (inv) public private factor market Producer Factor supply Factor Demand factor inflow Invest-ment expenditure Supply Purchase Total outflow closure Import Foreign Saving Saving G Saving p Capital (saving) Revenue Tax (direct) Tax on import Tax (indirect) Public Income Transfer income Private demand Export invest Consume Consume Market Sale Producer total Foreign Capital (inv) public private factor market Producer Each cell made in a separate manner Constraint condition: purchase = sale, supply = demand, income = expenditure, investment = saving (Closure)
production ACT(J)
Factor Composite Intermediate
L C Non-energy Energy
10a~h(I,J)
H-income
Labor Capital
Goods and services (i)
Disposable income
H-expenditure Direct tax
H-Consumption H-Saving G-income G-expenditure G-Saving G-Consumption Transfer Foreign
Import good (i)
Tariff (i) Export (i) Domestic (i) Total Supply Total Demand Investment Market (I)
Inter Demand industry
LEF
Lef
CD CD
Fossil fuel electricity
Quantity I O (i, j) recycling LEF Indirect tax Pollution P1~P19 CO2 CO2 production ACT(J)
Factor Composite Intermediate
L C Non-energy Energy
10a~h(I,J)
H-income
Labor Capital
Goods and services (i)
Disposable income
H-expenditure Direct tax
H-Consumption H-Saving G-income G-expenditure G-Saving G-Consumption Transfer Foreign
Import good (i)
Tariff (i) Export (i) Domestic (i) Total Supply Total Demand Investment Market (I)
Inter Demand industry
LEF
Lef
CD CD
Fossil fuel electricity
Quantity I O (i, j) recycling LEF Indirect tax Pollution P1~P19 CO2 CO2 Act: Activities, L: Labor, C: Capital, H: Household, G: Government
3. Model
A. Structure As noted, the current Integrated National CGE model for Korea follows the basic structure of AIM/material/CGE model, and Table II‐3 shows the activities and commodities used in Korean model.
Table II-3.Activities and Commodities
Activity Commodity 01 Agriculture, forestry and fishing 01 Agriculture, forestry and fishing 02 Coal mining 02 Coal mining 03* Crude oil mining 03 Crude oil mining 04* Natural gas mining 04 Natural gas mining 05 Other mining 05 Other mining 06 Food products and beverages 06 Food products and beverages 07 Textiles 07 Textiles 08 Pulp, paper and paper products 08 Pulp, paper and paper products 09 Chemicals 09 Chemicals
10 Petroleum products 10a Gasoline
10b Jetfuel 10c Kerosene 10d light oil 10e heavy oil 10f Naptha 10g LPG 10h Other petrorium products
11 Coal products 11a Coaks
11b Other coal products
11c1) None
12 Non‐metallic mineral products 12 Non‐metallic mineral products
14 Fabricated metal products 14 Fabricated metal products
15 Machinery 15 Machinery
16 Electrical machinery ,equipment
and supplies 16
Electrical machinery ,equipment and supplies
17 Transport equipment 17 Transport equipment
18 Precision instruments 18 Precision instruments
19 Other manufacturing 19 Other manufacturing
20 Construction 20 Construction
21a2) Coal power plant 21 Electricity
21a Oil power plant 21a Gas power plant 21b Nuclear power plant 21c Hydro power plant 21d Self power generation 21e3) None 22 Town gas 22 Town gas 23 Water supply 23 Water supply 24 Wholesale and retail trade 24 Wholesale and retail trade 25 Finance and insurance 25 Finance and insurance 26 Real estate 26 Real estate 27 Transport and communications 27 Transport and communications 28 Service activities 28 Service activities 29 Industrial waste management 29 Industrial waste management *: There is no domestic production. (It is pure import sector in Korea model) 1), 3) data was not available for Korea. 2) Aggregate to the fuel power plant
Figure II‐6 shows the framework of flow diagram of goods, services, production factors, and waste generation sources from each institute (or agent) and activities. Production sector uses capital, labor and energy intermediate, and emits pollutions. Goods and services produced domestically or imported are supplied to the market. Regarding the waste treatment process, waste effluent is divided into the recyclable or the non‐recyclable. Pollution management sector provide pollution management service for treatment of the non‐recyclable. Non‐recyclable materials are divided into treated effluent and non‐treated effluent in the final disposal
process. Eventually, all the treated and non‐treated effluents are disposed to the environment. Though the model integrates waste recycling process in the model, the recycling sector it is not yet fully endogeneized as an economic activity. In sum, the current model considers 19 types of waste and CO2 as environmental effluent.
production
sector
household
capital
labor
government
abroad
market
import
export
produced commodity
energy
intermediate
CO2
energy
final demand
CO2
Waste
generation
pollution
Management service
energy
intermediate
CO2
capital
labor
environmental
investment
Recycled
material
Final
disposal
production
sector
household
capital
labor
government
abroad
market
import
export
produced commodity
energy
intermediate
CO2
energy
final demand
CO2
Waste
generation
pollution
Management service
energy
intermediate
CO2
capital
labor
environmental
investment
Recycled
material
Final
disposal
B. Equations
This section summarizes the mathematical model statement. In general, executable CGE model is composed of a series of simultaneous nonlinear equation system. To solve this system of equation using GAMS solver such as miles or path, we need to set a number of equations equal to the number of variables to determine. That means the system of simultaneous equation of the model is square. This is a necessary condition for a unique solution but not a sufficient one.
We compose this equation system of five blocks: supply and distribution of market commodities, production activities, pollution generation, household and government activities, and investment. The name and form of set, parameter, and variable are described in table II‐2.
Table II-4Notational Principles
Item Notation Basic set indices I: commodities E: energy commodities Fe: fossil fuel energy commodities J: activities W: waste Si: social investment Exogenous variables Latin letters with a bar Price variable Start with ‘p’ character Monetary value Written with all Capital letters Notes: The character of parameters is started with Latin ‘a’ letter.
Commodity (produced goods) block
The total domestic supply of market commodities is equal to the sum of intermediate demand, household consumption, government consumption, investment containing stock change. Equation (1) sets equality between total supply and absorption of the commodity.
Commodity market equilibrium condition (Wallas), , ,
_
i i j i i i i i si i j siyd
=
∑
io
+
ch
+
cg
+
inv
+
Einv
+
∑
Sinv
+
inv stk
(1)
The price equation is presented as a linear combination of domestic and imported prices.
Commodity market price (composite of domestic and imported commodities),
i i i i i
pyd
=
pd
×
ad
+
pim
×
aim
(2)
The composite commodity of imported and domestic commodities is produced by Leontief technology15. The level of total output of commodity then depends either on the unit production level of the domestic or that of the imported. Supply of commodity composite in domestic market,
min
i,
i i i ids
im
yd
ad
aim
⎡
⎤
=
⎢
⎥
⎣
⎦
The level of imported and domestically produced commodity is determined as a fixed portion of total commodity output.
Distribution of imported and domestically produced commodity,
15 Under the Armington assumption, the imported commodity and the domestic commodity are
incompletely substitutable. However, in our model, we took that the total supply of market commodity depeond on the fixed portion of domestic and imported commodity.
i i i
im
=
aim
×
yd
(3) i i ids
=
ad
×
yd
(4) The price of imported commodity is determined by the international price of imported commodity produced and the exchange rate given exogenously. 16 Price of imported commodity,_
i ipim
=
inp im
×
exr
(5) The value of total commodity composite in domestic market is equal to the weighted sum of the values of domestic and imported commodities. Value of total commodity composite (composite of domestic and imported commodities), i i i i i iyd
×
pyd
=
pd
×
ds
+
pim
×
im
(6)The total export of domestically produced commodity is determined as a fixed portion of total commodity output (produced domestically). Export of commodity, i i i
ex
=
aex
×
y
(7) The export price of commodity is determined by the international price of export commodity produced domestically and the exogenously given exchange rate.
Price of exported commodity,
_
i i
pex
=
inp ex
×
exr
(8)
16 In this model, we don’t consider the difference between c.i.f and f.o.b prices for the simplicity of model structure.