저작자표시-비영리-동일조건변경허락 2.0 대한민국 이용자는 아래의 조건을 따르는 경우에 한하여 자유롭게 l 이 저작물을 복제, 배포, 전송, 전시, 공연 및 방송할 수 있습니다. l 이차적 저작물을 작성할 수 있습니다. 다음과 같은 조건을 따라야 합니다: l 귀하는, 이 저작물의 재이용이나 배포의 경우, 이 저작물에 적용된 이용허락조건 을 명확하게 나타내어야 합니다. l 저작권자로부터 별도의 허가를 받으면 이러한 조건들은 적용되지 않습니다. 저작권법에 따른 이용자의 권리는 위의 내용에 의하여 영향을 받지 않습니다. 이것은 이용허락규약(Legal Code)을 이해하기 쉽게 요약한 것입니다. Disclaimer 저작자표시. 귀하는 원저작자를 표시하여야 합니다. 비영리. 귀하는 이 저작물을 영리 목적으로 이용할 수 없습니다. 동일조건변경허락. 귀하가 이 저작물을 개작, 변형 또는 가공했을 경우 에는, 이 저작물과 동일한 이용허락조건하에서만 배포할 수 있습니다.
경제학 석사 학위논문
The Effect of Color on
Beverage Product Evaluation
색깔이 음료 제품 평가에 미치는 영향
2015년 2월
서울대학교 대학원
농경제사회학부 지역정보전공
The Effect of Color on
Beverage Product Evaluation
지도교수 문 정 훈 이 논문을 경제학 석사학위논문으로 제출함 2015년 2월 서울대학교 대학원 농경제사회학부 지역정보전공 조 종 표 조종표의 석사학위논문을 인준함 2015년 2월 위 원 장 (인) 부 위 원 장 (인) 위 원 (인)
Abstract
The Effect of Color on Beverage Product Evaluation
Jongpyo Cho
Program in Regional Information
Department of Agricultural Economics and Rural Development Seoul National University
A consumer’s food choices are related to many factors. Among these, the color of food is one primary way in which a product inspires an expectation of its flavor, while also helping the consumer notice the product. Edible pigment is widely used for coloring food. Yet this basic type of food additive has been the topic of debate among experts and consumers. This study examines the effect of beverage color and bottle color on consumer responses like satisfaction and willingness to buy. To achieve this study’s stated aims, this study first created a strawberry-flavored beverage and conducted drinking experiments with 300 participants, testing their reactions to the color of the beverage’s bottle and of the beverage itself. The results show that when the transparent beverage was offered in a red bottle satisfaction and willingness to buy were greater than they were when the beverage and its bottle were other colors. Additionally, moderating variables had significant effects under different conditions.
Keywords: Expectancy Disconfirmation Theory, Assimilation-Contrast Effect, Expectation, Beverage color, Food additives, Satisfaction
Content
I. Introduction ……….. 1
1. Background ……… 1
2. Research Questions ……… 3
II. Literature Review ……… 4
1. Antecedent Factors for Food-related Consumer Behavior ………… 4
2. Food and Color ………...7
III. Theoretical Framework ………... 11
1. Influence of Expectation on Consumer Behavior ……… 11
2. Expectancy Disconfirmation and Assimilation-Contrast Effect ….. 13
IV. Research Model and Hypotheses ……… 17
1. Research Model ……… 17 2. Hypotheses Development ………. 17
V. Research Methodology ……….. 21
1. Measure Development ……….. 21 2. Experiment Design ……… 26 3. Experiment Process ………... 28VI Data Analysis and Results ………31
1. Data Collection ……….. 31
2. Sample Characteristics ……….. 32
3. Assessment of Measurement Model ………. 33
4. Manipulation Check ……….. 36
5. Hypothesis Test ………. 36
VII Discussion ………43
1. Summary of Findings ……… 43
References ……… 53
Appendix A. IRB Documents ……….……..59
Appendix B. Recruitment Document ………64
Appendix C. Manipulation Material ………. 65
Appendix D. Survey ……….67
Appendix E. Experimental Tools……….. 72
List of Figures
Figure 1. Schematic model of food-related behaviors ……….. 6
Figure 2. The relationship between the three forms of flavor information and their effects on stages of consumer choice ………... 12
Figure 3. Research model of the study ………... 17
Figure 4. Three conditions of the study ……….. 27
Figure 5. Experiment process ………. 29
Figure 6. Average satisfaction of three groups……… 37
Figure 7. Average willingness to buy of three groups ……… 39
List of Tables
Table 1. Literatures on food and color………... 8Table 2. Definition of effect of disparity between expectations and actual product performance ………. 15
Table 3. Operationalization of variables ………. 25
Table 4. Number of responses………. 31
Table 5. Demographic characteristics ………... 32
Table 6. Reliability and Convergent validity check ………... 34
Table 7. Correlations of the latent variables and square root of the AVE... 35
Table 8. Descriptive statistics of dependent variables ……… 35
Table 9. Manipulation check for beverage characteristics ………. 36
Table 10. Difference in Satisfaction of different groups………. 38
Table 11. Difference in Willingness to buy of different groups …………. 40
Table 12. Multiple regression in terms of satisfaction ………... 42
Table 13. Multiple regression in terms of willingness to buy ……… 42
I. Introduction
1. Background
Various factors influence consumer food choice (Wansink, 2004). Food-related consumer behaviors are affected not only by sensations like taste, smell, and texture but also by a combination of psychosocial influences, bodily states, and expectations (Cardello, 1994; Stroebele & De Castro, 2004). These factors have been investigated in many ways, and the visual factor in particular has one of the greatest influences on consumer food choice (Spence et al., 2010). Since the visual factor is important, producers go to great lengths to make food visually appealing. In fact, food color is one of the ways products approach consumers and consumers recognize products (Clydesdale, 1993; Walsh et al., 1990; Stillman, 1993). In short, food color inspires expectations and helps consumers identify products (Cardello, 1994; Garber et al., 2000).
Natural and artificial edible pigments are widely used to color foods. These kinds of pigments are classified as food additives (Kim, 2013). Some experts and food scientists believe that legally allowed food additives are harmless to human body, but the media and some consumers insist that safe food additives are rare. Health concerns are ever more pronounced, and food-safety issues are becoming very high-profile. Food additives, artificial coloring, and preservatives cause concern for consumers (Jin & Kim, 2009; Baek & Lee, 2006), albeit regulations for food additives exist in many countries, and a joint effort has been undertaken to institute consistent food
standards (Depew, 1963; Codex Alimentarius Commission, 2013). In fact, foods and beverages containing disallowed food additives are impossible to make and sell through normal channels.
Meanwhile, most academic efforts related to food additives have focused on investigating which food additives are harmful to people, how food additives affect the human body, and whether food regulations and policies are valid. The Codex Alimentarius Commission (CAC) and EU Parliament continuously try to impose consistent food-additive regulations (Kim, 2013; EU Regulation, 2008). Consequently, research into consumer responses and behaviors toward food additives is insufficient. The preferences of the general consumer are hard to discern in detail about food additives, and thus, external factors like color and flavor are utilized to identify them (Jin & Kim, 2009). Suffice it to say, more research into the effects of color and food additives on consumer perceptions and responses is necessary.
The main goal of this study is to investigate the influence of edible pigment on consumer behavior. As such, this study attempts to examine (1) expectation’s effects, in terms of color incongruity, on product evaluation, (2) the influence of product characteristics, and (3) how health perceptions and attitudes toward food additives are influencing consumer responses.
Specifically, this study examines how drinking beverages of various colors and tastes effects perceptions of food additives. By investigating the
influence of edible pigment and the incongruity between color and flavor on consumer responses like satisfaction and willingness to buy, this study hopes to explain consumers’ attitudes toward food additives and to develop strategies for improving consumer satisfaction. In order to achieve this goal, the present study created a beverage, varied the color of its contents and bottle, and conducted drinking experiments in which sample consumers evaluated the beverage.
2. Research Questions
As mentioned above, this study aims to identify consumer responses to edible pigments and colors. This study assumes an incongruity between concepts of color and flavor and expectations about a beverage; as such, it hypothesizes that incongruent color can be a tool for determining the effects of edible pigments on consumer responses. To achieve this goal, the present study poses the following research question:
RQ1: What features elicit positive and negative expectations and responses to the beverage from average consumers?
After determining the general consumer response to the beverage, this study then attempts to determine which other factors moderate the effects of color and edible pigmentation. Product characteristics and health-related factors, such as attitudes toward food additives and perceived health
status, are also investigated. To achieve this goal, the present study poses the following additional research questions:
RQ2: Based on the type of beverage, which factors influence the willingness and level of satisfaction consumers feel when deciding whether to buy a beverage?
II. Literature Review
1. Antecedent Factors for Food-related Consumer Behavior
Factors like personal preference, sound, temperature, aroma, color, and time complexly affect food choice (Stroebele & De Castro, 2004). Diverse studies have examined the influence environmental factors have on consumer behavior. Wansink (2004) focuses on consumption volume and investigates psychological mechanisms that influence consumer behavior. Environmental factors like atmosphere, social context, distractions, food salience, and package or container size can complexly act together to make consumers eat more or less. In terms of packaging-related factors, package design can help regulate food intake and, thus, increase or decrease consumption levels (Argo & White, 2012). Indeed, even background music can influence food-related consumer behavior; Caldwell & Hibbert (2002) and Milliman (1986) have investigated the influence of background music on consumer preferences and consumption behavior: Music tempo and preference influence actual and perceived time spent dining and the amount of money spent dining.
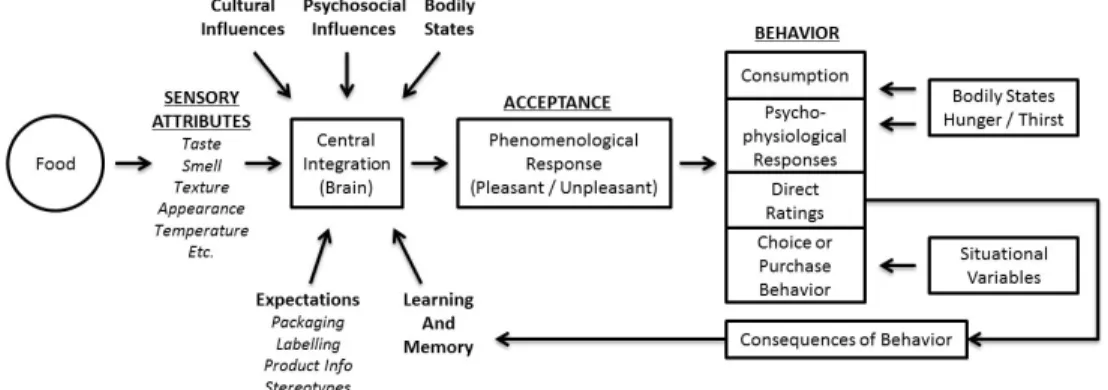
Cardello (1994) suggests a schematic model of food-related behaviors, explaining the process from receiving food to making food-related decision. Food can be viewed as a sensory stimulus like taste, smell, texture, appearance, and temperature. After accounting for various influences, such as culture, psychosocial status, bodily state, expectation, and mental experience with sensory attributes, consumers make emotional
responses and accept or reject a product. Actual consumer behaviors like consumption, choice, and making a purchase subsequently occur. After making a food-related decision, the consumer faces consequences for that decision, and these are linked to memories and learning about a given food, consequently affecting central integration re that food. Figure 1, from Cardello (1994), depicts a schematic model of food-related behaviors:
Figure 1. Schematic model of food-related behaviors (Cardello, 1994)
Stroebele & De Castro (2004) have examined the general environmental factors contributing to food-related consumer behavior, including social variables, surroundings, lighting, and temperature, as well as immediate environmental factors that also contribute to such behavior, including the color and smell of a food; most important of all these factors, however, is food color, which affects food identification and evaluation (Stroebele & De Castro, 2004). For example, when orange juice was offered to consumers in various colors, adulterated (green) orange juice reduced consumer acceptance compared with unadulterated orange juice, therefore reducing consumer choice (Tepper, 1993). Furthermore, color affects taste
sensations: Pangborn (1984) found that the amount of sweetness consumers experienced when drinking orange juice was influenced by the juice’s color; the sampled consumers said the same juice was sweeter when its color was brighter. Stillman (1993) conducted an experiment using different-colored raspberry and orange juice to examine consumer flavor identification. Participants evaluated fruit-flavored beverages in different colors, such as red, orange, and green. Results showed that color had a significant impact on participants’ perceptions and identifications of the beverages’ flavors. When the amounts of coloring and flavoring were increased, the accuracy of identification accordingly increased. In this way, color influences consumer food identification and creates expectations. Moreover, color plays a key role in food choice by influencing taste thresholds, perceived sweetness, food preferences, sensations of pleasantness, and acceptability (Clydesdale, 1993).
2. Food and Color
Color is considered an important factor in food-related research. Thus far, the main focus in food-color research has been on consumer acceptance and identification of food taste and flavor, yet during the food-acceptance and -identification processes, consumer behavior is also influenced by psychological factors. In this regard, color plays a role not only in giving the consumer clues with which to guess flavor and taste but also in eliciting expectations and cuing food choice.
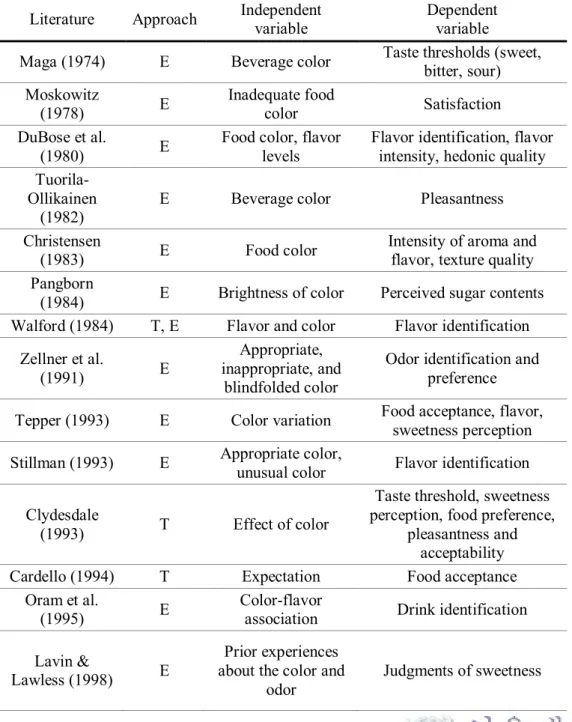
For this reason, the present study has reviewed previous research that examines the relationship between food and its color. Table 1 lists the studies reviewed in this paper. The listed papers are arranged by study approach and the variables each study examined.
Table 1. Literatures on food and color
Literature Approach Independent variable Dependent variable Maga (1974) E Beverage color Taste thresholds (sweet, bitter, sour)
Moskowitz (1978) E Inadequate food color Satisfaction DuBose et al. (1980) E
Food color, flavor levels
Flavor identification, flavor intensity, hedonic quality
Tuorila-Ollikainen (1982)
E Beverage color Pleasantness
Christensen
(1983) E Food color Intensity of aroma and flavor, texture quality Pangborn
(1984) E Brightness of color Perceived sugar contents Walford (1984) T, E Flavor and color Flavor identification
Zellner et al.
(1991) E
Appropriate, inappropriate, and
blindfolded color
Odor identification and preference Tepper (1993) E Color variation Food acceptance, flavor,
sweetness perception Stillman (1993) E Appropriate color,
unusual color Flavor identification Clydesdale
(1993) T Effect of color
Taste threshold, sweetness perception, food preference,
pleasantness and acceptability
Cardello (1994) T Expectation Food acceptance
Oram et al.
(1995) E
Color-flavor
association Drink identification Lavin &
Lawless (1998) E
Prior experiences about the color and
odor
Garber et al.
(2000) E Beverage color Flavor identification Bayarri et al.
(2001) E Beverage color Sweetness and fruit flavor intensity Zellner &
Durlach (2002) E Color variation Perceived refreshment Stroebele & De Castro (2004) T Influence of ambience such as color, sound, temperature, smell and time
Food intake, choice
Stevenson & Oaten (2008) E Appropriate and inappropriate beverage color Odor discrimination Levitan et al. (2008) E Color-flavor
association Discrimination of the flavor Spence et al.
(2010) T Food color Taste and flavor perception E : Experimental approach
T : Theoretical approach
Most previous studies on food utilize experimental approaches to examining the effects of color on food perception. Inadequate food color, they have found, influences flavor identification and the perceived contents of a food or beverage (Maga, 1974; DuBose et al., 1980; Pangborn, 1984; Tepper, 1993; Stillman, 1993; Oram et al., 1995; Lavin & Lawless, 1998). Zellner et al. (1991) show that color congruity influences smell identification, and thus, it is connected to food preference. Food and beverage colors affect sensory determinations, such as sweetness, bitterness, and sourness (Maga, 1974; Bayarri et al., 2001).
Other studies, meanwhile, have been based on psychological, cognitive, and behavioral theory, and these have investigated the
psychological role color plays in influencing consumer behaviors like food choice and making a purchase. Additionally, Moskowitz (1978) and Tuorila-Ollikainen (1982) investigated the effect of food and beverage color on consumer behaviors like feeling satisfied and pleased. Inadequate food color reduces the consumer’s satisfaction with a product, and adequate beverage color causes pleasant feelings.
Yet other studies attempt to organize and integrate the theoretical aspects of color’s effects on food (Walford, 1984; Clydesdale, 1993; Cardello, 1994; Stroebele & De Castro, 2004; Spence et al., 2010). These studies focus on theoretical models and the process by which consumers’ food-related behaviors operate. Cardello (1994) introduces a schematic model for food-related behavior that fully integrates the decision process, from food experience to food choice. Clydesdale (1993) reviews various studies on food color and organizes them according to the effects of color on food perception each examines. Still other studies explain the expectations created by color and their effects on consumer behavior.
In summary, most studies on food color focus on experimental approaches to examining the effects color has on a number of factors, and there is not much literature on role color plays in determining consumer food choices. Flavor and smell identification and flavor intensity and differentiation are somewhat removed from consumers’ conscious attitudes. This study, therefore, focuses on how color affects consumer evaluations of beverages.
III. Theoretical Framework
1. The Influence of Expectation on Consumer Behavior
Expectation is sometimes more important that the product itself (Cardello, 1994), and many studies investigate the effects of expectation on purchasing behavior. For example, using MIT-branded beer, Lee et al. (2006) found that a product’s brand had an effect on eliciting expectations; when the study’s participants were told the beer was made by a famous research institute they showed a greater preference for the MIT-branded beer than for generic beer. Participants had specific expectations of what their consumption experiences with the MIT beer would be, and these affected their actual experiences. Meanwhile, Ares & Dezila (2010) found that packaging plays a role in attracting consumers and in the creation of hedonic expectations. Such expectations influence product perception and willingness to buy. Indeed, participants formed specific sensual expectations based on the shape and color of test product’s packaging.
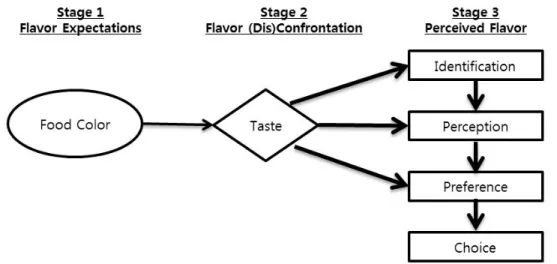
According to Garber et al. (2000), expectation helps the consumer identify food and connects food choice to food taste. Before consumers form preferences or make decisions, expectation forces them to evaluate food in advance. As shown earlier in Figure 1, various factors classified as expectations can be linked to causing emotional responses and are, consequently, linked to consumer behavior. Figure 2 illustrates the process, from forming expectations based on food color to the consumer’s purchase response.
Figure 2. The relationship between the three forms of flavor information and their effects on stages of consumer choice (adapted from Garber et al., 2000)
Color is defined as a vivid, affect-loaded visual factor (Cheskin, 1957), and color conveys important symbolic and associative information about a product’s category and specific brand (Hine, 1995). Various studies investigate the effect color has on expectation and consumer response. Consumers’ expectations of and attitudes toward foods and beverages depend partly on these products’ colors (Clydesdale, 1993). Zellner & Durlach (2002) found that beverages with clear, strong colors, such as red and orange, cause the consumer to expect those beverages will be refreshing. Prior experiences with color and flavor accumulate to contribute to expectation-driven taste (Lavin & Lawless, 1998). Even children evaluate red jelly as a strawberry flavor.
In this way, the expectations formed based on color strongly influence food identification and perceptions. For example, in one
experiment Walford (1980) found that participants perceived white ice cream as vanilla and brown ice cream as chocolate, despite their flavors’ being the opposite. Moreover, people perceived red jelly as strawberry-flavored and yellow jelly as lemon-strawberry-flavored. These kinds of phenomena are attributed to previous experiences, which engender specific expectations (Lavin & Lawless, 1998).
2. Expectancy Disconfirmation and the Assimilation-Contrast
Effect
When consumers feel there is an incongruity between color and flavor they tend to fall prey to illusion. According to the Moskowitz (1978), when an inadequately colored buffet was offered to study participants they were dissatisfied because of the food’s unsuitable color. Thus, in a food-related context, novel and inappropriate colors make it hard for accept consumers to accept pleasant tastes due color incongruity (Heckler & Childers, 1992; Garber et al., 2000).
The concept of Expectancy Disconfirmation is widely applied in many academic fields. In both consumer-marketing and information-systems research, expectations of what a product or service will be and disconfirmation of those expectations produce dissatisfaction in prospective consumers and user behavior (Oliver, 1980; Mckinney et al., 2002). Yi (1993) found that product ambiguity played a moderating role in causing Expectancy Disconfirmation. Unambiguous products, Yi found, allow
consumers to easily evaluate said products and, thus, lead to consumer satisfaction.
Oliver (1980) was the first to propose Expectancy Disconfirmation in his paper “A Cognitive Model of the Antecedents and Consequences of Satisfaction Decisions.” The difference between perceived performance and evaluation is connected to confirmation or disconfirmation of a product, and consequently, it leads to the satisfaction or dissatisfaction of consumers. This study therefore hypothesizes that consumers’ believing there is an incongruity between color and flavor will make them feel dissatisfied with a beverage.
There are three explanations for the dissatisfaction caused by the difference between an expected performance and the consumer’s actual evaluation of a product: the so-called Assimilation-Contrast Effect (Table 2; Anderson, 1973). The Assimilation Effect occurs when there is a small discrepancy and the level of satisfaction is determined in the same way as expected. When there is a large discrepancy between the perceived performance of a product and the consumer’s real evaluation of it, on the other hand, the Contrast Effect occurs, and thus, consumers evaluate the product much more or less favorably than expected. Finally, the Assimilation-Contrast Effect indicates that these two effects are not a mutually exclusive and both can be taken in terms of product perception and evaluation. Moreover, the Assimilation-Contrast Effect can vary, depending on the level of discrepancy (Anderson, 1973; Lee et al., 2006). In short, the
discrepancy between expectations and an objective evaluation of a product’s performance will be minimized or assimilated based on the consumer’s perceptions (Anderson, 1973). This study adopts the Assimilation-Contrast Effect to explain the role color plays as a cue for decisions on the level of expected flavor in a beverage.
Table 2. Definition of effects of disparity between expectations and actual product performance (Anderson, 1973)
Effect Definition
Assimilation
Any discrepancy between expectations and product performance will be minimized or assimilated by the consumer’s adjusting his perception of the product to be more consistent with his
expectations
Contrast
Customer will magnify the difference between the product received and the product expected; i.e., if the objective performance of the product fails to meet his expectations, the customer will evaluate the product less favorably than if he had no prior expectations for it
Assimilation-Contrast
There are zones or latitudes of acceptance and rejection in consumer perceptions. If the disparity between expectations and product performance is sufficiently small to fall into the
consumer’s latitude of acceptance, he will tend to assimilate the difference by rating the product more in line with expectations than its objective performance justifies. However, if the discrepancy between expectations and actual product performance is so large that it falls into the zone of rejection, then a contrast effect comes into play and the consumer magnifies the perceived disparity between the product and his expectation for it
In this regard, the Assimilation-Contrast Effect can influence the level of satisfaction and dissatisfaction based on prior expectations. When consumers feel there is only a small discrepancy between their expectations and evaluations, the Assimilation Effect occurs, and they perceive the
product in accordance with their original expectations. However, when consumers feel a big discrepancy exists, the Contrast Effect occurs, and they evaluate the product much less favorably than they expected to.
IV. Research Model and Hypotheses
1. Research Model
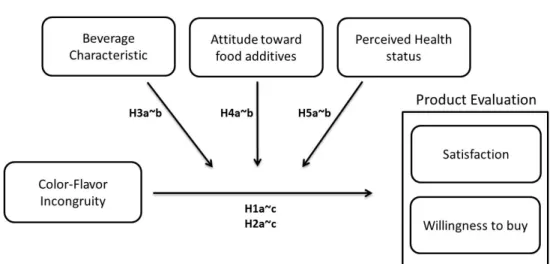
According to the existing literature and conceptual framework, the present study proposes the following research model and hypotheses (Figure 3):
Figure 3.Research model of the study
2. Hypotheses Development
2.1 The effect of color on consumer behavior
Based on the findings of previous studies, the present study proposes the following research model and hypotheses: first, based on the Oliver’s (1980) Expectation Disconfirmation Theory and Garber et al.’s (2000) conceptual framework, this study hypothesizes that when a beverage’s color and flavor are incongruent the consumer’s evaluation of said beverage (i.e.,
the consumer’s satisfaction and willingness to buy) decrease according to the level of disappointed expectancy. Furthermore, this study contends that giving consumers a cue to help them make proper expectations diminishes disappointment and increases favorable evaluations, as per the Assimilation-Contrast Effect (Anderson, 1973). In this study, a red beverage in a red bottle serves as the epitome of an adequate flavor-expectation balance. The following list summarizes the present study’s hypotheses:
H1a. Satisfaction with a colored beverage in a transparent bottle will not differ from satisfaction with a transparent beverage in a colored bottle.
H1b. Satisfaction with a colored beverage in a transparent bottle will be greater than satisfaction with a transparent beverage in a transparent bottle.
H1c. Satisfaction with a transparent beverage in a colored bottle will be greater than satisfaction with a transparent beverage in a transparent bottle.
H2a. The willingness to buy a colored beverage in a transparent bottle will not differ from the willingness to buy a transparent beverage in a colored bottle.
H2b. The willingness to buy a colored beverage in a transparent bottle will be greater than the willingness to buy a transparent beverage in a transparent bottle.
H2c. The willingness to buy a transparent beverage in a colored bottle will be greater than the willingness to buy a transparent beverage in a transparent bottle.
2.2 The moderating effects of beverage characteristic, attitudes toward food additives, and perceived health status
When there is a main effect due to bottle and beverage colors, utilitarian characteristic of the beverage are hypothesized to play a moderating role in making people feel healthier under certain conditions, and attitudes toward food additives and the consumer’s perceived health status should also have moderating effects. Therefore, this study hypothesizes as follows:
H3a. In the case of a transparent beverage in a transparent bottle,
utilitarian characteristics will positively influence
satisfaction when compared with other conditions.
H3b. In the case of a transparent beverage in a transparent bottle, utilitarian characteristic will positively influence willingness to buy when compared with other conditions.
H4a. In the case of a transparent beverage in a colored bottle, as negative attitudes toward food additives increase satisfaction will increase when compared with other conditions.
H4b. In the case of a transparent beverage in a colored bottle, as negative attitudes toward food additives increase willingness to buy will increase when compared with other conditions. H5a. In the case of a colored beverage in transparent bottle, as the
consumer’s perceived health status increases satisfaction will increase when compared with other conditions.
H5b. In the case of a colored beverage in a transparent bottle, as the consumer’s perceived health status increases willingness to buy will increase when compared with other conditions.
V. Research Methodology
1. Measurement Development
All constructs and indicators used in this study are adopted from previous research. Variable operationalization is shown in Table 3.
Hedonic and utilitarian characteristics of a beverage
Most research on hedonic and utilitarian characteristics concentrates on the consumer’s consumption goal. Value is evaluated based on sensual pleasure and the need for pleasure and enjoyment during consumption as a hedonic consumption goal (Leclerc et al., 1994). The utilitarian consumption goal emphasizes a product’s function or the completion of a cognitive, instrumental, goal-directed and functional task (Strahilevitz & Myers, 1998).
When it comes to making a purchase, then, the consumer’s consumption goal can be influenced by a product’s characteristics, regardless of whether the product is hedonic or utilitarian. Especially in regards to products that require little involvement, such as beverages and cookies, one can infer that consumers are affected by a product’s own attributes, independent of specific consumption goals. Research into hedonic and utilitarian product characteristics has been conducted using instruments to measure the extent to which participants perceive these attributes (Leclerc et al., 1994; Voss et al., 2003). Leclerc et al. utilized a hedonic-to-utilitarian scale to measure a product’s hedonism and
utilitarianism. Similarly, Voss et al. (2003) developed a hedonic-to-utilitarian scale to validate and generalize the measure of hedonic and utilitarian constructs. This study adopts the hedonic-to-utilitarian scale from Leclerc et al. The scale’s measure is applied as a consumer attitude dimension and focuses on product categories and different brands. As a result, latent hedonic and utilitarian variables turn out to be two distinct attitude dimensions.
Consumer attitude: Satisfaction and willingness to buy
There are numerous examples of previous research into means of measuring consumer satisfaction. Satisfaction is an emotional evaluation of a product or service (Hunt, 1977). To measure satisfaction, both single- and multi-item measures are used and both methods have their pros and cons (Lee, 2004).
Westbrook (1980) used the Delighted-Terrible (D-T) scale to measure satisfaction with a single measurement method. Taylor & Baker (1994), in contrast, employed three direct indicators to measure consumer satisfaction, and this multi-scale approach enhanced the reliability of their attitude measurements. Later, Juhl et al. (2002) measured customer satisfaction using three indicators: overall satisfaction, expectation, and comparison with ideal product. Finally, Dodds et al. (1991) used five indicators to measure willingness to buy.
This study employs Juhl et al.’s (2002) multiple-item measure and Dodds et al.’s (1991) willingness-to-buy measures, adapting three of Dodds et al.’s (1991) indicators to suit beverage-purchasing situations. The two price-related items from Dodds et al.’s (1991) original measure are deleted for this study, and consumer satisfaction from Juhl et al.’s (2002) study is conceptualized as an overall evaluation of the test beverage.
Attitudes towards food additives
Based on research into consumer lifestyles, this study focuses on the consumer’s food-related lifestyle. Brunso & Grunert (1995) introduced the food-related lifestyle (FRL) measurement, as FRL can affect the consumer’s food-related decision making. Since this measurement’s introduction, several studies have been conducted in Eastern and Western countries to generalize and validate it (Grunert et al., 1998; Grunert et al., 2001; Fang & Lee, 2009; Grunert et al., 2011; Kim, 2012).
Grunert et al. (2011) introduced a concise FRL instrument and applied it to studying Chinese consumers’ food-buying habits. The original FRL measurement had five major components covering every aspect of the food related-lifestyle concept: way of shopping, quality aspects, cooking methods, consumption situation, and purchase motives. The present study adapts the attitude towards food additives measure from Grunert et al.’s (2011) FRL instrument to measure latent variables.
Perceived health status
Two methods are widely used in health research to measure an individual’s health status: self-rating, expert measurement (Kaplan & Camacho, 1983). Kaplan & Camacho (1983) used a single-item, self-rated method to check the subjective health statuses of their study’s subjects. Speake et al. (1989) later developed a multi-item, subjective health-status perception measure consisting of current health status, health status compared with the past, and health status compared with those of the same age group. This study adopts Kaplan & Camacho’s (1983) perceived health-status measurement.
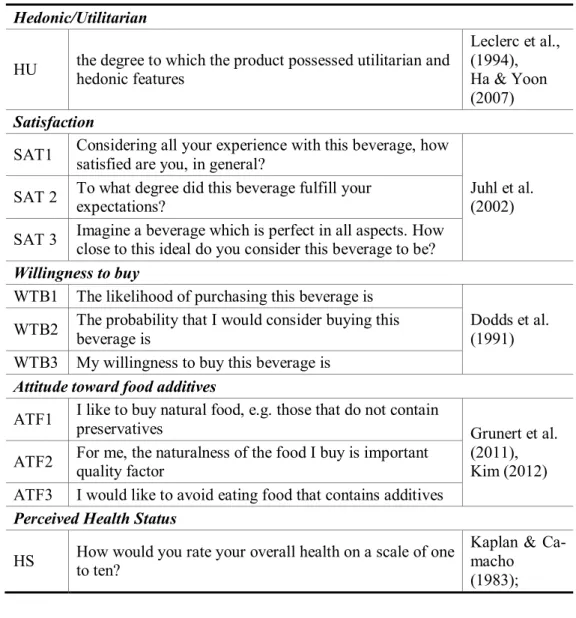
Table 3. Operationalization of variables
Hedonic/Utilitarian
HU the degree to which the product possessed utilitarian and hedonic features
Leclerc et al., (1994), Ha & Yoon (2007)
Satisfaction
SAT1 Considering all your experience with this beverage, how satisfied are you, in general?
Juhl et al. (2002) SAT 2 To what degree did this beverage fulfill your expectations?
SAT 3 Imagine a beverage which is perfect in all aspects. How close to this ideal do you consider this beverage to be?
Willingness to buy
WTB1 The likelihood of purchasing this beverage is
Dodds et al. (1991) WTB2 The probability that I would consider buying this
beverage is
WTB3 My willingness to buy this beverage is
Attitude toward food additives
ATF1 I like to buy natural food, e.g. those that do not contain
preservatives Grunert et al.
(2011), Kim (2012) ATF2 For me, the naturalness of the food I buy is important quality factor
ATF3 I would like to avoid eating food that contains additives
Perceived Health Status
HS How would you rate your overall health on a scale of one to ten?
Kaplan & Ca-macho (1983);
2. Experiment Design
This study was designed to take place between subjects (Between-subject design). In conducting the tasting experiment, the experiment-design method for sensory evaluation of Lawless & Heymann (2010) was used. The preference experiment for food and beverage products and the appropriate environment for sensory evaluation are detailed in Lawless & Heymann (2010).
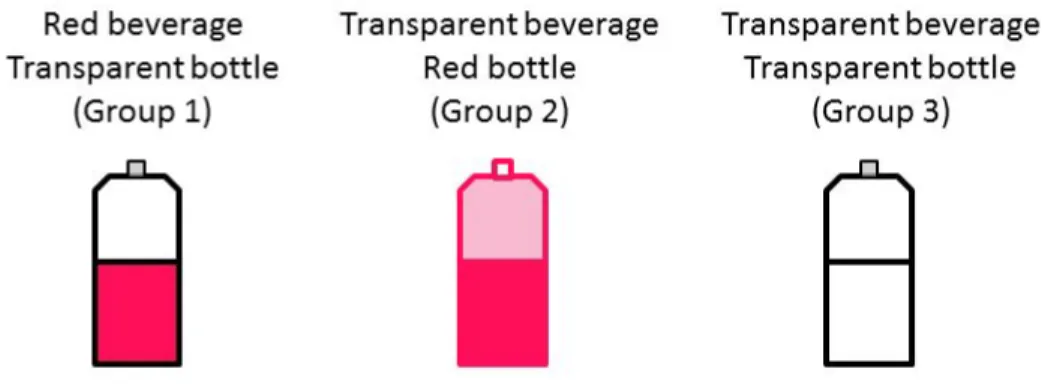
To test this study’s hypotheses, six product-characteristic conditions, plus beverage and bottle color, were used. Product characteristics fall into two categories, hedonic and utilitarian. Beverage samples were divided into three conditions, based on the various combinations of bottle and beverage color (Figure 4). The first combination (Group 1) was a red, strawberry-flavored beverage in a clear bottle. The second combination (Group 2) was a transparent, strawberry-flavored beverage in a red bottle. The third combination (Group 3) was a transparent, strawberry-flavored beverage in a transparent bottle.
Red coloration and strawberry flavoring were used in this study to stimulate associations between the color red and the flavor of strawberries. Red was also used in this study because it is the color most widely used in color taste-interaction research (Lavin & Lawless, 1998). According to the same research, the majority of consumers associate the color red with the flavor of strawberries.
Figure 4. Three conditions of the study
The three tested beverage conditions differed in terms of bottle and beverage color, but all three combinations tasted the same, as strawberry-flavoring was fixed as an experimental control in this study. As previously mentioned, too, red is strongly associated with the flavor of strawberries; therefore, the color red was also fixed as a control, thereby enhancing the expectation of strawberry flavoring. The first beverage condition, a red, strawberry-flavored beverage in a transparent bottle, was designed not to be unusual for the study’s participants but is, instead, similar to a real product currently available in stores. The second condition, a transparent beverage, was designed to seem strange to participants, as it was different from all currently available products, but this study posits that the bottle’s red color would make participants expect the beverage to taste like strawberries. The third condition was designed to prevent participants from developing flavor expectations, as it gave no clue as to its contents; participants would, this study hypothesizes, feel a sense of abnormality after tasting this third beverage.
Beverage samples used in this study were made from water, lemonade and legally permissible food additives, including edible flavoring, fructose, and pigments (when applicable). The formula for this study’s test beverage is as follows: 100 ml of water, 100 ml of lemonade, 6 gm of crystalline fructose, 0.5 gm of edible strawberry flavoring, and 0.2 gm of edible, red food coloring (when applicable). Based on these percentages, each participant was offered approximately 180 ml (about 6 oz.) of beverage in a 250 ml bottle (about 8.4 oz.).
To ensure safety a food-additive specialist and food manufacturer advised this study’s authors on making the test beverage. Additionally, because this study is concerned with behavioral research involving humans, the Institutional Review Board (IRB) of Seoul National University (SNU) reviewed this study’s proposed methods prior to testing (IRB No. 1411/001-023).
3. Experiment Process
To recruit participants, help-wanted advertisements for consumer-market research subjects were posted on an online bulletin board. That the present study is concerned with consumer-market research for new beverage products was emphasized to conceal the study’s primary purpose. Subsequently, 300 participants were spontaneously recruited via said bulletin board’s online recruitment system. A randomized block design was
used to test six different conditions, and each of the 300 recruited participants was assigned to a timeslot of her choosing. The six conditions were equally and randomly assigned in keeping with the study’s randomized, between-subject design.
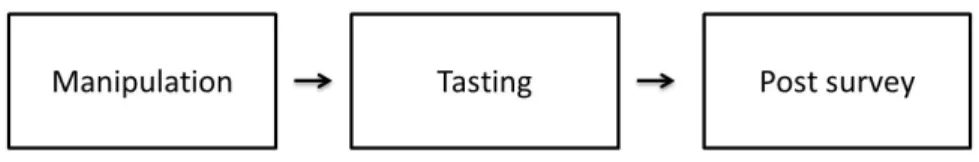
Figure 5. Experiment process
Figure 5 represents the experiment process. Participants were told to imagine they are part of a consumer-market research test for new beverage prior to its launch. First, to manipulate participants’ expectations about the test, they were instructed to read a description of the new beverage’s characteristics. When they finished reading this description, they were offered a beverage sample and instructed to taste it. They were manipulated with six characteristics: two product characteristics (hedonic and utilitarian), times three bottle- and beverage-color combinations (transparent and red, red and transparent, and transparent and transparent, respectively).
After tasting each beverage, participants answered a series of questions about the product’s characteristics, including whether they viewed it as hedonic or utilitarian, what their attitudes toward the beverage were (i.e., if they were satisfied and if they were willing to buy it), and how they
viewed health-related variables (i.e., their attitudes toward food additives and their perceived health statuses).
Finally, demographic information was collected, and to filter out participants who guessed the study’s real purpose, a question about the study’s purpose was asked. After the experiment, all participants were rewarded with a $3 meal coupon for their participation.
VI. Data Analysis and Results
1. Data Collection
This study adopted an experimental approach to collecting data and verifying its hypotheses. Experiments were conducted in an on-campus meeting room equipped for testing the study’s beverage and conducting its survey. Participants were recruited via an online recruitment system, and most were undergraduate and graduate students. All participants were given adequate information about the experiment, in accordance with the terms of the IRB.
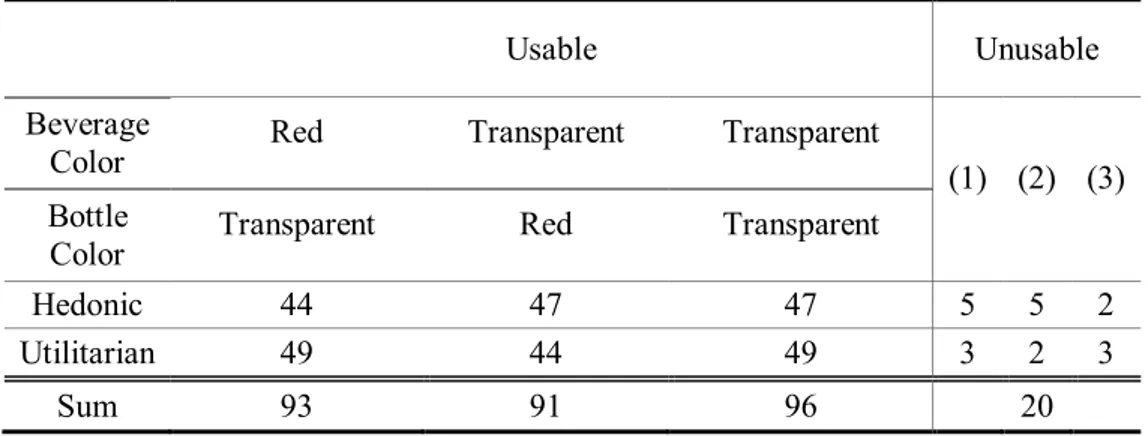
A total of 300 responses were collected, and 280 of these (excepting 20 unusable responses) were analyzed. Unusable responses were classified based on three criteria: (1) eight participants showed a strong repulsion to the beverage sample, (2) seven samples had a manipulation problem, (3) five respondents were insincere participants. The between-subject experi-mental block design and the number of responses are shown in Table 4.
Table 4. Number of responses
Usable Unusable
Beverage
Color Red Transparent Transparent (1) (2) (3)
Bottle
Color Transparent Red Transparent
Hedonic 44 47 47 5 5 2
Utilitarian 49 44 49 3 2 3
2. Sample Characteristics
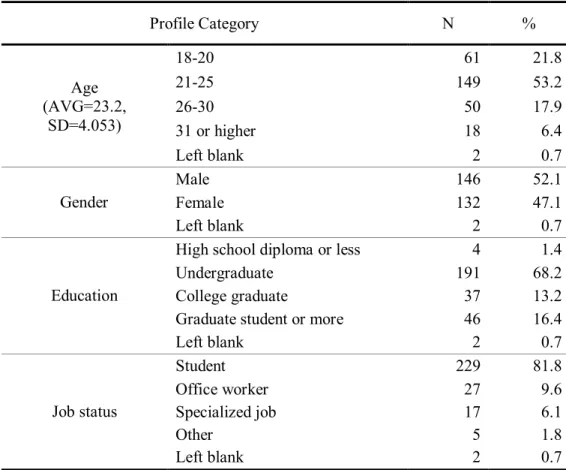
Demographic characteristics are shown in Table 5. The majority of subjects were between 21 and 25 years old (53.2%), and male and female participants accounted for 52.1% and 47.1% of the sample population, respectively. In terms of job status, a majority of participants were students (82.8%).
Table 5. Demographic characteristics (N=280)
Profile Category N % Age (AVG=23.2, SD=4.053) 18-20 61 21.8 21-25 149 53.2 26-30 50 17.9 31 or higher 18 6.4 Left blank 2 0.7 Gender Male 146 52.1 Female 132 47.1 Left blank 2 0.7 Education
High school diploma or less 4 1.4
Undergraduate 191 68.2
College graduate 37 13.2
Graduate student or more 46 16.4
Left blank 2 0.7 Job status Student 229 81.8 Office worker 27 9.6 Specialized job 17 6.1 Other 5 1.8 Left blank 2 0.7
3. Assessment of Measurement Model
Data analysis in the present study was performed using PLS method for the assessment of measurement model and t-test, ANOVA for testing the hypotheses (using PLS-graph and SPSS 20).
For the assessment of measurement, the current study performed reliability test and the construct validity test. For performing reliability test, the study utilized composite reliability and Cronbach’s Alpha to assess internal consistency of the latent variables. To identify construct validity, both convergent validity and discriminant validity were investigated. Factor loadings and Average Variance Extracted (AVE) were investigated to test the convergent validity, and the square root of AVE was used to verify the discriminant validity.
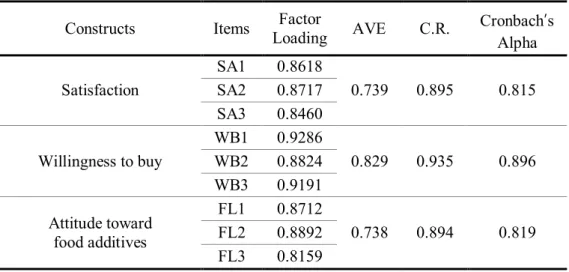
3.1 Reliability Test and Convergent Validity Test
Composite Reliability (CR) test and Cronbach’s Alpha was conducted to verify the internal consistency of each latent variable. According to Werts et al. (1974), values greater than 0.70 in CR imply that a construct retains both its internal consistency and convergent validity. As shown in Table 6, all the constructs passed threshold of reliability test.
The factor loadings and AVEs were investigated to verify convergent validity. The acceptable points of validity are factor loadings greater than 0.70 and an AVE greater than 0.50 (Fornell and Larcker, 1981; Gefen et al., 2005). All the factor loadings of individual items were greater than 0.70
which is the threshold and all the AVEs of latent variables were greater than 0.50 as well.
Table 6. Reliability and Convergent validity check
Constructs Items Loading Factor AVE C.R. Cronbach’s Alpha Satisfaction SA1 0.8618 0.739 0.895 0.815 SA2 0.8717 SA3 0.8460 Willingness to buy WB1 0.9286 0.829 0.935 0.896 WB2 0.8824 WB3 0.9191 Attitude toward food additives FL1 0.8712 0.738 0.894 0.819 FL2 0.8892 FL3 0.8159
3.2 Discriminant Validity Test
The square root of AVE table was utilized to examine the discriminant validity. According to Fornell and Larcker (1981), the square root of AVE should be greater than the correlations among the constructs. Thus, the amount of variance shared between the constructs implies the discriminant validity (Gefen and Straub, 2005). Following Table 7 shows the ratio of the square root of the AVE of each latent variable over the correlations of this variable with respect to all the other variables. All the values of square root of AVE which are on the diagonal part of the table are greater than any other constructs below. Therefore, each latent variable is more highly correlated with its indicators than with any other constructs.
Table 7. Correlations of the latent variables and the square root of the AVE
Latent Variables (1) (2) (3) (4)
(1) Satisfaction (0.860)
(2) Willingness to buy 0.787 (0.910)
(3) Attitude toward food additives 0.142 0.199 (0.859)
(4) Perceived health status 0.057 0.014 0.058 (1.000)
Table 8. Descriptive statistics of dependent variables
Construct N Min. Max. Average S.D.
Manipulation (H/U) 279 1 7 3.839 1.333 Attitude toward food additives ATF1 280 1 5 3.682 0.937 ATF 2 280 1 5 3.525 1.009 ATF 3 280 1 5 3.443 1.076
Perceived Health Status PHS 280 3 10 6.925 1.546 Satisfaction SAT1 280 1 5 3.511 0.743 SAT2 280 1 5 3.164 1.010 SAT3 280 1 5 3.004 0.814 Willingness to buy WTB1 280 1 5 3.007 0.920 WTB2 280 1 5 3.400 0.930 WTB3 280 1 5 3.004 0.960
4. Manipulation Check
Before analyzing the effects of independent variables on consumer responses, the manipulation of product characteristics was checked (Table 9).
Table 9. Manipulation check for beverage characteristics
Beverage Characteristics N Average S.D. Statistics
Hedonic 138 4.8696 8.07341 t=1.992,
df=278, p<0.05
Utilitarian 142 3.5000 1.37738
Note: two-tailed test
As mentioned above, product-characteristic manipulation was divided into two groups, according to whether the product characteristic was hedonic or utilitarian. Using a seven-point Likert scale, this study found the average hedonic- and utilitarian-manipulation values were 4.8696 and 3.5000, respectively. There was a significant difference between the two groups (t = 1.992, df = 278, p < 0.05), meaning that participants perceived hedonic and utilitarian characteristics differently.
5. Hypothesis Test
5.1 Main effect of color on beverage evaluation
To examine the color’s main effect on consumer response to the test beverage, this study performed a variance analysis (VA).
Satisfaction (H1a ~ c)
Figure 6 illustrates the descriptive statistics for satisfaction with this study’s three beverage groups. As mentioned before, Group 1 indicates that participants were offered a red beverage in a transparent bottle, Group 2 means participants were given a transparent beverage in a red bottle, and Group 3 implies a transparent beverage in a transparent bottle. Average satisfaction for each group was 3.1792 (Group 1), 3.3846 (Group 2), and 3.1215 (Group 3). Statistical differences are analyzed below.
* Note: Group 1 (Red beverage in transparent bottle) Group 2 (Transparent beverage in red bottle)
Group 3 (Transparent beverage in transparent bottle)
As illustrated in Table 10, the results of the one-way, between-groups VA show that satisfaction with the three beverages was significantly different among the three groups (F(2,277) = 3.248, p < 0.05) . To analyze this
effect in detail, the present study conducted a post-hoc analysis (LSD), the results of which show that there were significant differences in satisfaction between the groups, indicating a 5% difference between the second (transparent beverage in a red bottle) and third (transparent beverage in a transparent bottle) conditions.
Table 10. Difference in Satisfaction of different groups
Group N Average S.D. F p Post-hoc: LSD
1 2 3 1 93 -.067 .927 3.248 .040 -.281590 .070245 2 91 .214 1.052 .281590 .351834* 3 96 -.137 1.000 -.070245 -.351834* * p < 0.05
* Note: Group 1 (Red beverage in transparent bottle) Group 2 (Transparent beverage in red bottle)
Willingness to buy (H2a ~ c)
Figure 7 shows descriptive willingness-to-buy statistics for the three beverage groups. Average willingness to buy for each group was 3.1434 (Group 1), 3.2747 (Group 2), and 3.0000 (Group 3). Statistical differences are analyzed below.
* Note: Group 1 (Red beverage in transparent bottle) Group 2 (Transparent beverage in red bottle)
Group 3 (Transparent beverage in transparent bottle)
Figure 7. Average willingness to buy of three groups
The results of the one-way, between-groups VA are illustrated in Table 11. There was a significant difference in willingness to buy among the three groups (F(2,277) = 2.430, p < 0.10), and the results of a post-hoc
analysis also show that there was a significant difference in willingness to buy between groups, indicating a 5% difference between the second
(transparent beverage in a red bottle) and third (transparent beverage in a transparent bottle) conditions.
Table 11. Difference in Willingness to buy of different groups
Group N Average S.D. F p Post-hoc: LSD
1 2 3 1 93 .007 .969 2.430 .090 -.154787 .166514 2 91 .162 1.031 .154787 .321301* 3 96 -.160 1.002 -.166514 -.321301* * p < 0.05
* Note: Group 1 (Red beverage in transparent bottle) Group 2 (Transparent beverage in red bottle)
Group 3 (Transparent beverage in transparent bottle)
5.2 Moderating effects of other factors on satisfaction and willingness to buy
As mentioned earlier, various factors affect food-related consumer behavior (Stroebele & De Castro, 2004; Cardello, 1994). After determining color’s main effect, this study examined the moderating effects of other factors on dependent variables. This study divided participants into two groups according to product characteristics (i.e., whether the beverage was hedonic or utilitarian), and to investigate the moderating effects of beverage characteristics, attitudes toward food additives, and participants’ perceived health statuses, this study performed a multiple-regression analysis. The results of this analysis are illustrated in Tables 12 and 13. Six multiple
regressions were conducted, according to the study’s manipulation conditions.
Product characteristics (H3a ~ b)
This study hypothesizes that, in case of the transparent beverage in a transparent bottle (third condition), utilitarian characteristics will positively influence the dependent variables compared with the other conditions. Results show there was a significant effect on satisfaction (B = 0.284, p < 0.05) alone.
Attitude towards food additives (H4a ~ b)
This study hypothesizes that, in case of the transparent beverage in a red bottle (second condition), as negative attitudes toward food additives increase dependent variables will increase compared with other conditions. Results show there were significant effects on both satisfaction (B = 0.284, p < 0.05) and willingness to buy (B = 0.385, p < 0.01).
Perceived health status (H5a ~ b)
This study hypothesizes that, in case of the red beverage in a transparent bottle (first condition), as participants perceived health statuses increase dependent variables will increase compared with other conditions. Results show there was a significant effect on satisfaction (B = 0.250, p < 0.05) alone.
Table 12. Multiple regression in terms of satisfaction
Beverage color Red Transparent Transparent
Bottle color Transparent Red Transparent
B p-value B p-value B p-value
CV Age .113 .311 -.305* .004 -.037 .725 Gender -.126 .254 -.215* .036 -.174* .098 IV Hedonic/Utilitarian .230* .033 .224* .023 .284* .009 Attitude toward food additives .134 .247 .352* .001 .116 .254 Perceived health status .250* .020 -.012 .907 -.034 .731 F F(5,86) = 2.529* F(5,85) = 4.779* F(5,89) = 2.850* p-value .035 .001 .020 R2 .077 .174 .090 * p < 0.05
Table 13. Multiple regression in terms of willingness to buy
Beverage color Red Transparent Transparent
Bottle color Transparent Red Transparent
B p-value B p-value B p-value
CV Age .035 .761 -.269* .010 -.230* .033 Gender -.121 .285 -.245* .017 -.171 .106 IV Hedonic/Utilitarian .097 .374 .231* .018 .116 .279 Attitude toward food additives .226 .058 .385** .000 .191 .066 Perceived health status .154 .159 -.065 .509 -.115 .257 F F(5,86) = 1.584 F(5,85) = 5.077** F(5,89) = 2.483* p-value .173 .000 .037 R2 .031 .185 .073 * p< 0.05, ** p < 0.01
VII. Discussion
1. Summary of Findings
The main goal of this study is to examine the effects of color and edible pigment on consumer behavior. To achieve this goal, this study examined (1) consumer attitudes toward edible pigment, (2) the effect of expectation in terms of color incongruity on satisfaction with a product, and (3) how health-related factors affect consumer responses like satisfaction and willingness to buy. To verify this study’s hypotheses its authors conducted a tasting experiment with a between-subject design, and 300 responses were collected. The data were analyzed using a one-way ANOVA, independent-sample t-test and multiple regressions. Table 14 illustrates a summary of the hypothesis test.
Table 14. The result of hypothesis test
Hypothesis Support
H1a
Satisfaction with a colored beverage in a transparent bottle will not differ from satisfaction with a transparent beverage in a colored bottle.
Supported
H1b
Satisfaction with a colored beverage in a transparent bottle will be greater than satisfaction with a transparent beverage in a transparent bottle.
Not Supported
H1c
Satisfaction with a transparent beverage in a colored bottle will be greater than satisfaction with a transparent beverage in a transparent bottle.
Supported
H2a
The willingness to buy a colored beverage in a transparent bottle will not differ from the willingness to buy a transparent beverage in a colored bottle.
Supported
H2b
The willingness to buy a colored beverage in a transparent bottle will be greater than the willingness to buy a transparent beverage in a transparent bottle.
H2c The willingness to buy a transparent beverage in a colored bottle will be greater than the willingness to buy a transparent beverage in a transparent bottle.
Supported
H3a
In the case of a transparent beverage in a transparent bottle, utilitarian characteristics will positively influence satisfaction when compared with other conditions.
Supported
H3b In the case of a transparent beverage in a transparent bottle, utilitarian characteristic will positively influence willingness to buy when compared with other conditions.
Not Supported
H4a
In the case of a transparent beverage in a colored bottle, as negative attitudes toward food additives increase satisfaction will increase when compared with other conditions.
Supported
H4b
In the case of a transparent beverage in a colored bottle, as negative attitudes toward food additives increase willingness to buy will increase when compared with other conditions.
Supported
H5a
In the case of a colored beverage in transparent bottle, as the consumer’s perceived health status increases satisfaction will increase when compared with other conditions.
Supported
H5b
In the case of a colored beverage in a transparent bottle, as the consumer’s perceived health status increases willingness to buy will increase when compared with other conditions.
Not Supported
H1a-c and H2a-c are connected to the effects of color and expectation on consumers’ evaluations of the tested beverages. As shown in Table 14, most of this study’s initial hypotheses were supported. The only hypothesis not supported was “Satisfaction with and willingness to pay for the red beverage in a transparent bottle will be higher than satisfaction with and willingness to pay for the transparent beverage in a transparent bottle” (H1b, H2b). This study also hypothesizes that when there is an appropriate cue, such as red coloration, to engender expectation, consumers will easily infer a beverage’s flavor. Thus, the study predicts that evaluation for the red beverage in a transparent bottle will be better than that for the transparent
beverage in a transparent bottle. However, while results show that there was a tendency to confirm this hypothesis, a statistically significant difference was not confirmed.
Furthermore, this study’s result shows that color and edible pigment had an effect on participants’ evaluations of the test beverages. This phenomenon can be explained as being a result of color-flavor incongruity and Expectation Disconfirmation. That is, when there was a noticeable incongruity between color and flavor, satisfaction and willingness to buy decreased because flavor expectations for a given beverage did not match the participants’ experiences. This phenomenon can be also explained as being a result of the Assimilation-Contrast effect. Participants evaluated the transparent beverage under the influence of the Contrast Effect. However, when a red bottle was used to elicit adequate expectation, satisfaction and willingness to buy increased. By forming expectations of a beverage’s flavor, participants evaluated the beverage under the influence of the Assimilation Effect. Bottle color, moreover, mitigated the effect of beverage color-flavor incongruity; therefore, participants formed the proper expectations in such cases. Although participants felt a certain degree of incongruity because of the beverage’s transparent color, they could form expectations of the product’s flavor due to the color of its bottle.
H3a and H3b are connected to beverage-characteristics effects. In the case of the transparent beverage in a transparent bottle, beverage characteristics, be they hedonic or utilitarian, had an effect on participant
behavior. Beverage characteristics had a significant influence on satisfaction alone. When the product characteristics were utilitarian, satisfaction was higher than satisfaction for hedonic characteristics. In terms of willingness to buy, utilitarian characteristics had no significant effect.
H4a-b and H5a-b are connected to the effect of attitudes toward food additives and individuals’ perceived health statuses. Both affected the responses of this study’s participants. As shown in Table 14, most hypotheses for this line of inquiry were supported. The only rejected hypothesis was “In the case of the red beverage in a transparent bottle, as the individual’s perceived health status improves willingness to buy will increase compared with other conditions” (H5b). In the case of the transparent beverage in a red bottle, attitudes toward food additives had a positive effect on satisfaction and willingness to buy (H4a-b). When participants recognized the transparent beverage, attitudes toward food additives consequently made participants feel healthier and raised their satisfaction and willingness to buy. What’s more, as their perceived health statuses increased, participants’ satisfaction with the red beverage in a red bottle (H5a) increased. It can be inferred, then, that edible pigment has no effect on people who are confident about their health.
2. Contributions and Limitations
2.1 Theoretical implications
This study used cues to prompt participants into forming expectations about beverage flavors in order to conduct theoretical research into applying Expectancy Disconfirmation theory to the field of food production. Additionally, it examined the Assimilation-Contrast effect as a means of a product’s recovering from reduced satisfaction and willingness to buy caused by Expectancy Disconfirmation. Prior research into Expectancy Disconfirmation focused on the products or services themselves and attempted to determine the consequences of disconfirmation such as dissatisfaction, and these studies suggested strategies for make expectancy-confirmative products and situations. This study provides a different perspective on antecedents that views disconfirmation in terms of food acceptance and evaluation. In this study, color was used to elicit adequate expectations of the flavor of a beverage. Moreover, giving a beverage adequate color, this study shows, had a significant effect on increasing participants’ satisfaction and willingness to buy by instilling flavor expectations in the study’s subjects. Therefore, this study suggests one way a product might recover positive consumer responses when there is dissatisfaction because of Expectancy Disconfirmation.
Additionally, this study attempted to clarify the effects of beverage characteristics. Recently, there has been trend toward health consciousness, and a growing number of health-functional foods and beverages are
increasingly capturing market share. This study attempted to examine the effects of beverages’ utilitarian characteristics and how these effects can be differentiated when compared with beverages’ hedonic characteristics. This study found that attitudes toward food additives can have an effect on consumers’ product evaluations. In this study, too, when adequate flavor expectations were inspired by a red bottle, attitudes toward food additives had a significant influence on participants’ product evaluations. Therefore, health-related factors were shown to effect consumer choice behavior significantly.
Finally, the findings of this study are not limited to the field of food-related consumer behavior, and can be extended to a diverse number of other consumer-related marketing fields, as well as to product development. In the development stage, implementing adequate cues that instill proper expectations about a product and emphasize its positive characteristics can have an important impact on attracting consumers. Moreover, when there are factors that cause expectation incongruity for a product, incorporating other cues that confirm expectations can be one way of improving consumer satisfaction.
2.2 Practical implications
This study helps practitioners understand the effects of color so that they can apply this factor to their customer-service and product-development processes. The results of this study show that, when a beverage