A THESIS
FOR THE DEGREE OF MASTER OF SCIENCE
Ultrasonic Measurements of Blood and
Plasma coagulation
Sitaramanjaneya Reddy Guntur
Department of Marine Instrumentation Engineering
GRADUATE SCHOOL
CHEJU NATIONAL UNIVERSITY
Ultrasonic Measurements of Blood and
Plasma coagulation
Sitaramanjaneya Reddy Guntur
(Supervised by Professor Dong Guk Paeng)
A thesis submitted in partial fulfillment of the requirement for the degree of Master of Science
2005.12.
This thesis has been examined and approved
Thesis director, Jin ho Bae, prof. of Marine Instrumentation Engineering Min Joo Choi, Prof. of Biomedical Engineering
Dong Guk Paeng, Prof. of Marine Instrumentation Engineering 2005.12.___
Date
Department of Marine Instrumentation Engineering
GRADUATE SCHOOL
TABLE OF CONTENTS
국문초록 ...iii ABSTRACT ... v LIST OF TABLES...vii LIST OF FIGURES...viii CHAPTER I INTRODUCTION ... 1 1.1 General ...1 1.2 Previous Studies ...41.2.1 Whole blood during coagulation ...5
1.2.2 Plasma during coagulation with aPTT...6
1.2.3 Plasma during coagulation with aPTT and heparin...7
1.3 Specific Aims of this Research...8
1.4 Overview ...9
CHAPTER II THEORY FOR MEASUREMENT OF SOUND SPEED AND ATTENUATION COEFFICIENT ... 10
2.1 Introduction ...10
2.2 Ultrasonic velocity...10
2.3 Ultrasonic attenuation...13
2.4 Reflection and Transmission of Plane Waves Normally Incident on a Layer between two Media ...14
CHAPTER III MATERIALS AND METHOD... 18
3.1 Introduction ...18
3.2 Properties of Blood...18
3.2.1 General ...18
3.2.2 Blood and plasma samples ...19
3.2.3 Chemicals and other materials...20
3.3 Measurement procedure ...22
CHAPTER IV MEASUREMENT OF ACOUSTIC PROPERTIES OF WHOLE BLOOD DURING COAGULATION... 25
4.1 Introduction ...25
4.2 Blood preparation ...25
4.3 Method for whole blood coagulation measurement ...26
4.5 Discussion...37
4.6 Conclusion...38
CHAPTER V MEASUREMENT OF ACOUSTIC PROPERTIES OF PLASMA DURING COAGULATION... 39
5.1 Introduction ...39
5.2 Plasma preparation ...39
5.3 Method for plasma coagulation measurement...40
5.4 Results ...42
5.5 Discussion...50
5.6 Conclusion...52
CHAPTER VI MEASUREMENT OF ACOUSTIC PROPERTIES OF PLASMA DURING COAGULATION WITH HEPARIN...53
6.1 Introduction ...53
6.2 Method for plasma coagulation with heparin measurement...54
6.3 Results ...56
6.4 Discussion...61
6.5 Conclusion...62
CHAPTER VII CONCLUSIONS AND FUTURE WORK ... 63
7.1 Conclusion...63
7.2 Future work ...64
BIBLIOGRAPHY...65
APPENDIX MEASUREMENT OF ACOUSTIC PROPERTIES OF PLASMA DURING COAGULATION WITH BROWN AND RED ALGE ... 70
A.1 Introduction ...70
A.2 Materials and Method...71
A.3 Results and Discussion ...72
A.4 Conclusion ...77
국문초록
지혈 시스템은 인체 내에서 두 가지 상반된 기능을 한다. 필요할 때 마다 출혈을 멈추게 하기도 하고, 순환시스템 내에서 혈병의 방해 없이 혈액의 흐름을 유지시키는 기능을 한다. 이 시스템은 연속적인 효소 반응의 복잡한 응고 과정으로서 성능을 미세하게 조절하는 상호 기능을 하는 과정이다. 혈액응고인자 한 두개의 이상 농도는 과응고, 혈전증, 지혈장애로 인한 부적절한 섬유소 형성을 초래한다. 따라서 이 논문의 주된 목적은 초음파를 이용하여 혈액의 전 응고과정에 대해서 측정하는 것이다. 이번 실험의 목적은 전혈과 혈장 응고의 전과정과 헤파린(Heparin) 같은 항응고제 역할을 분석하는 초음파 기술을 개발하고, 지혈 시스템의 생리학적 과정을 음향학적 특성으로 연구하는 것이다. 이 목적을 달성하기 위해서 수온 37℃의 수조에서 중심주파수 5MHz 인 트랜스듀서(Transducer)로 초음파의 펄스-반향 방법을 이용해 혈액과 혈장 샘플의 음속과 감쇠계수를 측정하였다. 실험은 10 명의 사람 피를 사용 하였으며, 적혈구용적율은 평균 41%이다. aPTT(Activated Partial Thromboplastin Time)와 항응고제를 포함한 혈장의 응고 또한 Lab View 프로그램을 이용해서 실시간으로 측정하였다. 실험결과는 전혈 응고 시 음속이 1584m/s 에서 1595m/s 까지 증가했고, 감쇠계수는 2.2dB/cm 에서 4.3dB/cm 까지 증가했다. 혈장 응고 시에는 음속이 1535 m/s 에서 1541m/s 로 증가했으며, 감쇠계수는 1.25dB/cm 에서 3.2dB/cm 로 증가했다. 전혈과 혈장의 음속과 감쇠계수의 시간에 대한 기울기는 혈액 응고의 3 단계인, 초기 효소 단계, 확장 단계, 그리고 종결 단계인 생리학적 단계와 유사하다. 헤파린과 같은항응고제를 투여한 혈장의 응고 시에는 음향 특성의 변화 양상이 달라지는 것이 밝혀졌다. 결론적으로, 전혈과 혈장의 응고에 대한 초음파 측정과 항응고제를 투여한 혈장의 응고과정을 함께 연구하면 혈액의 응고과정을 이해하는데 도움을 줄 것이다. 이러한 과정들은 항응고제를 개발하고 효과를 평가하는 다양한 기술에 적용될 수도 있다.
ABSTRACT
The haemostatic system has a dual paradoxical function in the body. It should stop bleeding whenever needed, but also keep the blood flowing in the circulatory system without any obstructing blood clots. The system is complex with series of enzymatic reactions, known as the coagulation cascade and intertwined processes that interact to produce a fine-tuned regulation of the performance. Abnormal concentration of one or more factors of blood coagulation results in an inadequate formation of fibrin by excessive coagulation ability, thrombophilia, and haemostatic disorders. Therefore, the main focus is to measure the whole process of coagulation using ultrasound.
The aims of this work are to develop an ultrasonic method for analyzing the whole process of blood and plasma coagulation and anti-coagulant activity of heparin, and to investigate the physiological phases of haemostatic system in terms of acoustic properties. To achieve this goal an ultrasonic pulse-echo method has been used for measurement of sound speed and attenuation coefficient in blood and plasma samples with a center frequency of 5 MHz at temperature of 37°C. The experiments were carried out using ten samples of human blood as an average hematocrit of 41 %. Plasma coagulation with aPTT (Activated Partial Thromboplastin Time) and with an anticoagulant has also been evaluated for haemostatic studies using Lab view program in real time.
Experimental results demonstrate that the average of sound speed and attenuation coefficient of whole blood were increased from 1584 to 1595 m/s, 2.2 to 4.3 dB/cm respectively, while the ones in plasma were increased from 1535 to 1541 m/s, 1.25 to 3.2 dB/cm during coagulation. The slope of
sound speed and attenuation of blood and plasma was changed at different physiological phases of enzymatic, propagation, and termination phases. Plasma coagulation with an anti-coagulant such as heparin was found to change the acoustic properties less with different patterns. In conclusion the combination of ultrasonic measurements of blood and plasma coagulation with/without an anticoagulant might help for a better understanding of coagulation processes, which may be applied in various techniques for the evaluation of the effects and development of anticoagulants and the drugs.
LIST OF96666999 TABLES
Table 1 Average sound speed and attenuation from eight samples during blood and plasma coagulation and comparison with the previous groups ...30
LIST OF FIGURES
1.1 Coagulation cascade pathway (Guyton 2000)...2
1.2 Physiological phases of blood coagulation process...3
2.1 Time shift mechanism between wrap layers and reflected signal with and without sample...11
2.2 Amplitude difference of reflected signal from perfect reflector with and without sample...16
2.3 Through transmission technique...16
3.1 Sample container with an acoustic window ...21
3.2 Ultrasonic measurement system ...23
4.1 Block diagram of whole blood coagulation process...27
4.2 Sound speed variations of eight individuals during blood coagulation ...31
4.3 Average sound speed variation of eight individual during blood coagulation ...32
4.4 Sound speed variation of nine and ten individual during blood coagulation ...33
4.5 Attenuation coefficient variation of eight individuals during blood coagulation ...34
4.6 Average attenuation coefficient variation of eight individuals during blood coagulation...35
4.7 Attenuation variation of nine and ten individual during blood coagulation ...36
5.1 Block diagram of plasma coagulation process ...41
5.2 Sound speed variation of eight individuals during plasma coagulation ...44
5.3 Average sound speed variation of eight individuals during plasma coagulation ...45 5.4 Sound speed variation of nine and ten individual during plasma
coagulation ...46 5.5 Attenuation coefficient variation of eight individuals during plasma
coagulation ...47 5.6 Average attenuation coefficient variation of eight individuals
during plasma coagulation...48 5.7 Attenuation variation of nine and ten individual during plasma
coagulation ...49 6.1 Block diagram of plasma coagulation with heparin process ...55 6.2 Sound speed variation of five individuals during plasma
coagulation with heparin ...57 6.3 Average sound speed variation of eight individuals during plasma
coagulation with heparin ...58 6.4 Attenuation coefficient variation of five individuals during plasma
coagulation with heparin ...59 6.5 Average attenuation coefficient variation of five individuals during
plasma coagulation with heparin ...60 8.1 Sound speed variation of five individuals in plasma with brown
algae during coagulation...73 8.2 Average sound speed variation of five individuals during plasma
coagulation with brown algae...73 8.3 Attenuation variation of five individuals during plasma coagulation
with brown algae ...74 8.4 Average attenuation variation during plasma coagulation with
8.5 Sound speed variation of five individuals during plasma coagulation with red algae...75 8.6 Average sound speed variation of five individuals during plasma
coagulation with red algae...75 8.7 Attenuation variation of five individuals during plasma coagulation
with red algae ...76 8.8 Average attenuation of five individuals during plasma coagulation
Chapter I
Introduction
1.1 General
Thrombotic conditions affect more then 600,000 people in the world (Brown 1984). This means their blood has a tendency to clot without any injury (Brown 1984). Due to their conditions, patents will have a need for monitoring either during cardiac surgical procedure or on a regular basis during anticoagulant therapy.
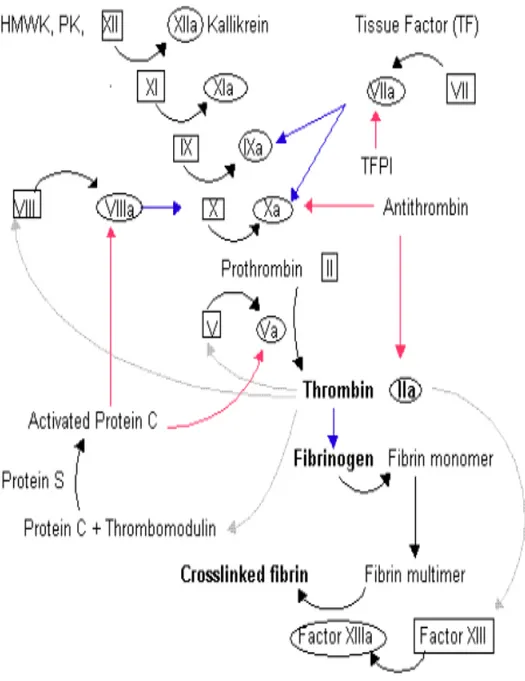
Blood coagulation is a complex physiological process that helps to maintain hemostasis within the vascular system. It should stop bleeding whenever needed, but also keep the blood flowing in the circulatory system without any obstructing blood clots. It consists of series of enzymic reactions following activation of blood clot mechanism. There is a delicate balance among blood cells, coagulation factors and external tissue factors. The activation of these series of enzymatic reactions is known as coagulation cascade (Guyton 2000) as shown in Figure 1.1. These reactions are typically catalyzed by 20 different substances, most of which are plasma glycoproteins, with each step initiating another reaction until fibrin formation (Brown 1984). Abnormal concentration of one or more factors of blood coagulation results in an inadequate formation of fibrin.
According to physiological processes, blood coagulation is characterized by three phases, enzymic phase, propagation phase, and termination phase (Mann 1992) as shown in Fig 1.2. Extrinsic factor Xase is a principle player
Enzymatic phase
Propagation phase
Termination phase
Figure 1.2 Physiological phases of blood coagulation process (Mann 1992)
of enzymic phase, in which a tiny amount of thrombin is produced and prothrombin activator catalyzes the conversation of prothrombin to thrombin. Vigorous thrombin generation occurs during propagation phase in intrinsic Xase and continues reaction with prothrombinase (Mann 2002), starting to cleave fibrinogen and activate the factor XIII. Termination phase occurs through the stoichiometric inhibitors antithrombin III (AT-III) and tissue factor pathway inhibitor (TFPI) and through the protein C system. The clotting time is considered to mark the end point of enzymatic phase and the onset of propagation and termination phases.
Coagulation process is the primary stage that comprises the development of anti-coagulant drugs in medical industries. More over, the coagulation process is often used as a reference for determining the activity of anticoagulants. Therefore, an accurate determination of coagulation process is very important for an optimal evolution of anticoagulation drugs. On the other hand, abnormalities in the platelets, coagulation factors and blood vessel result in excessive bleeding. Therefore measurement of blood coagulation process may benefit to understand both types of conditions to improve diagnostic and therapeutic process.
1.2 Previous Studies
In last decades, monitoring of blood and plasma coagulation has been carried out in order to determine the coagulation process or/and clotting time. The investigations are based on electrical (Miale 1965), optical (Davey and Malley 1972), and laser (Pieiere et al 2004) methods. These systems were unable to measure the whole process of coagulation. Therefore, an ultrasonic method was introduced for monitoring the change of whole process of blood coagulation (Shung et al. 1984; Volesis 2002).
Measurement of acoustic properties of whole blood and plasma may allow us to detect the characteristics of the blood clotting deficiencies related to various diseases, to analyze anticoagulant activity of anticoagulant, to improve diagnosis of some diseases and to suggest the appropriate treatment. 1.2.1 Whole blood during coagulation
The first digital ultrasonic interferometer was introduced for testing small amount of whole blood sample during coagulation (Grybauskas et al. 1978). They investigated velocity and absorption of whole blood during coagulation. Further, ultrasonic quantitative parameters, including sound speed and attenuation were measured, and they have been demonstrated to be useful in the sensitive detection of the process of coagulation (Shung et al. 1984; Voleisis et al. 2002; Wang et al. 2002). In addition, high frequency ultrasound to measure the quantitative back scattering parameters and acoustic velocity as a function of hematocrit percentage of whole blood during coagulation were measured (Ossant et al. 2004). These previous researchers measured the whole blood coagulation at various temperatures using citrated blood with an addition of calcium chloride for coagulation. They did not investigate whole blood coagulation in real body temperature, as natural processes of coagulation. Previous measurements of sound speed and attenuation on whole blood coagulation have shown that coagulation process may be affected at different temperatures conditions, with different hematocrit percentage, using citrated whole blood coagulation with thrombin or calcium chloride (shung et al.1984; Ossant et al. 2004; Huang et al. 2005).To consider all the previous researches, it is crucial to develop another feasible approach to measure the whole blood coagulation at
different hematocrit percentages with a natural process of coagulation at real body temperature.
1.2.2 Plasma during coagulation with aPTT
The determination of plasma coagulation time is an essential part of monitoring therapeutic anticoagulants. Standard methodologies for the measurement of plasma clotting are available to evaluate elapsed time from the beginning of an induced coagulation process up to the formation of a stable fibrin polymer. Currently, accepted methodologies are based on optical and mechanical. Optical detection can be preformed either with naked eyes or as a reduction in transmittance when light passes through the sample (Davey and Malley 1972). Mechanical transduction is typically carried out with a vibrating or rotating metal ball. Cessation of ball moving was considered as the endpoint of coagulation. An ultrasonic method has been studied from last few years to measure the plasma clotting time. Alves and Machado used acoustic streaming method using backscatter signals from spherical glass particles (in 1991) and using ultrasonic shear wave method (in 1994) to detect the plasma clotting time.
Deviation from normal time range of plasma clotting of previous researches indicating that some factors is not adequately performing its function in the process, and further tests will be required for its identification. Each test initiates the coagulation process at a different stage and the measured time provides clue about the malfunction factor. An ultrasonic method to measure whole coagulation process has been employed for the monitoring of plasma coagulation. During plasma coagulation, the coagulum changes due to the formation of a fibrin clot. In turn, this changed coagulum shifts the characteristic resonance amplitude of the ultrasonic
transducer enabling real-time continuous monitoring of this biological event. By monitoring the signal output as a function of time, a distinct blood clotting profile can be seen.
1.2.3 Plasma during coagulation with aPTT and heparin
The activated partial thromboplastin time (aPTT) and the activated clotting time (ACT) are the most extensively applied measurements of the heparin effect. Coagulation analyzer (such as the Hemochron system) is the principle player of measurement of aPTT and ACT. Various new and improved coagulation analyzers (devises) were available on market in recent years (Cheng et al. 1998;Hepel et al. 2003). Hand held prototype of small capillary coagulation analyzer have been recently developed. They are based on the drawing of blood or plasma into small capillary, and coagulation is detected using either a laser (biotrack, ciba-corning) or pressure sensing system (Nyco Med). However these systems are quite complex and require a laser or pressure sensing equipment. The other method was a piezoelectric quartz crystal (PQC) sensor for determination of blood and plasma coagulation with heparin (Chang et al. 2000; Cheng et al. 1998). None of the previous studies investigated the properties of heparin during coagulation with plasma using ultrasound. In order to investigate the whole process of plasma coagulation with heparin as a function of time, ultrasonic pulse echo method was used in this study. This study investigated the whole process of plasma coagulation with heparin and effects of specific factors and/or process during coagulation in terms of sound speed and attenuation.
1.3 Specific Aims of this Research
This research primarily is to measure ultrasonic velocity and attenuation coefficient measurement of whole blood and plasma during coagulation. Specifically, the studies can be divided into three aims. The first aim is to measure the acoustic properties of whole blood during coagulation at real body temperature with natural process when exposed to the air. The acoustic properties of whole blood during coagulation at body temperature of 37°C are needed due to the increasing interest to identify the three different phases of coagulation as indicated in physiology. Human blood coagulation at real body temperature, at a certain hematocrit and natural process without any chemicals may behigher sensitivity than at the room temperature with addition of calcium chloride.
The second aim is to thoroughly investigate the whole process of plasma coagulation with aPTT. Until now no investigations are carried out to measure the whole process of plasma coagulation. A feasible method for measurement of acoustic properties of plasma during coagulation with respect to time was developed. Structural variation of whole process of coagulation was investigated since the standard clinical method may not be applicable to know each stage of coagulation.
The third aim is to extend the study to the plasma coagulation with commercial available heparin, to study the effects of specific factors and/or process of heparin as an anticoagulant using ultrasound. The ultrasonic properties of plasma during coagulation with heparin may identify coagulation/clotting time from the ultrasound signals.
1.4 Overview
There are six chapters in addition to the chapter of introduction.
Chapter 2 provides the theoretical background for measurement of ultrasonic velocity and attenuation coefficient from both blood and plasma during coagulation. Attenuation coefficient measurement model includes three layer transmission techniques to interpret the attenuation in time domain.
Material and Methods for measurement of acoustic properties of whole blood and plasma during coagulation was presented in Chapter 3. Properties of both blood and plasma were introduced briefly. Measurement of acoustic properties of blood and plasma coagulation using a pulse echo method was discussed in detail.
Chapter 4 describes the measurement of acoustic properties of whole blood during coagulation and analysis of three distinguishable phase of blood coagulation in terms of sound speed.
Chapter 5 shows the results on measurement of sound speed and attenuation coefficient of plasma during coagulation with aPTT. Analysis of whole process of coagulation was discussed.
Chapter 6 covers the measurement of sound speed and attenuation coefficient of plasma coagulation with heparin. Specific factors and process of plasma coagulation with heparin in terms of sound speed and attenuation were investigated.
Chapter 7 summarized the findings in this research and also provides some recommendations for future work.
At last, appendix includes the preliminary experiments with other anticoagulants (brown and red algae) from seaweed were presented.
Chapter II
Theory for measurement of sound speed and
attenuation coefficient
2.1 Introduction
The theories about sound speed and attenuation coefficient were described in this chapter for a better understanding the experiments on blood and plasma coagulation with/without heparin. It includes the theory about the change of sound speed and attenuation coefficient within the blood/plasma sample during coagulation. Sound speed and attenuation coefficient are important ultrasonic parameters to derive blood and plasma coagulation constants and characterization of whole process of coagulation.
2.2 Ultrasonic velocity
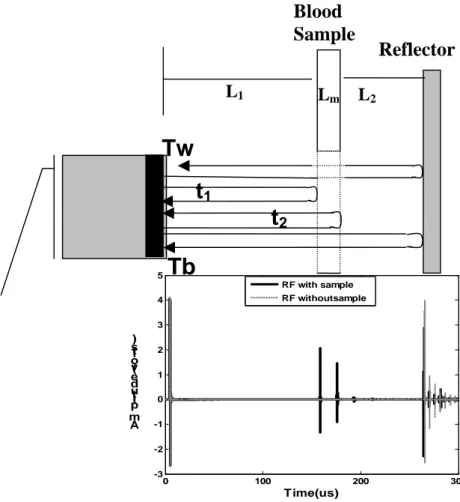
The technique used to measure ultrasonic velocity of blood /plasma during coagulation was classical differential pulse-echo method. A change in sound pulse transit time when a sample is incepted with in the path was measured by using known speed of sound to infer the sound speed of the sample. Consider a source of an ultrasonic pulse S, and a received ultrasonic pulse R as shown in Fig.2.1. Suppose a right rectangular sample container of homogeneous blood/plasma sample is inserted in the path of beam, such that its flat faces are perpendicular to the direction of propagation of the pulse. The dotted box in Fig. 2.1 is defined as thickness of the container (Lm).
Triggering is done via the pulse generated at the source so that the received pulse displayed on an oscilloscope looks like that as shown in Fig.2.1.
0 100 200 300 -3 -2 -1 0 1 2 3 4 5 Time(us) A m ptli u de ( v olt s) RF with sample RF withoutsample Blood Sample Reflector L1 Lm L2
Tw
t
1t
2Tb
Figure 2.1 Time shift mechanism between wrap layers and reflected signal with and without sample
The time shift (t2-t1) in the position of the RF pulse from sample the
front and rare face and the time shift (Tw-Tm) from the steel reflector with and without the sample in the path (Kuo 1990) as shown in Fig .2.1.
Lm = L- L1- L2 = L - (t1/2) Cw - [(Tm- t2)/2] Cw (2.1)
Tw/2= L/ Cw=1/ Cw (L1+ Lm+ L2) (2.2)
Tm/2=1/ Cw (L1+ L2) + Lm/ Cm (2.3)
From Equation (2.2) and (2.3)
Tm- Tw/2= Lm (1/ Cm-1/ Cw) (2.4)
Substituting Equation (2.1) into (2.4), we have
Tm- Tw/2= (Tw/2*Cw - t1/2*Cw –(Tm- t2)/2* Cw) * (1/ Cm-1/ Cw) (2.5)
Therefore
C= Cw [((Tw-Tm)/ (t2- t1)) +1] (2.6)
, where Cw is the sound speed of water, Tw and Tm are the time of flight
from the transducer to the reflector without the sample and with sample, respectively. t1 and t2 are the time from the front and the rear face of the
2.3 Ultrasonic attenuation
The amplitude of a plane ultrasonic wave decreases as the propagating distance increases. The amplitude of the ultrasonic wave which has propagated the distance of x is represented as
( ) 0 x
A X = A e−α (2.7)
, Where α is the attenuation coefficient of the propagation media. X is distance traversed. A0 is the attenuation of the wave and A is the amplitude
after a distance x has been traversed. Like the sound speed, the attenuation coefficient is dependent upon the physical properties of the medium. However, unlike the sound speed, the attenuation coefficient varies greatly with frequency. It can be write as α = αa + αs. Where αa is the absorption
coefficient and corresponds to the conversion of wave energy into internal energy (heat) of the medium. αs corresponds to the scattering of the primary
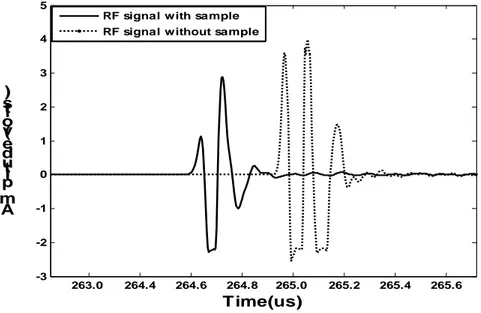
beam energy into all the different directions. The dimension of α is length -1, and it can be expressed in nepers/cm. In medical acoustics it is more common to express the attenuation coefficient in dB/cm. To measure the attenuation coefficient as a function of total transmition coefficient of blood and plasma, the amplitude of the reflected echoes with and without sample were compared (Madsen et al.1999), as shown in Fig. 2.2.
10 0
(20 / ) log [d A /( /A Ttotal)]
α = (2.8)
, where Ao and A are the peak to peak signal amplitude without and with the
2.4 Reflection and Transmission of Plane Waves Normally Incident on a Layer between two Media
When a plane wave is normally incident on the plane interface, the wave incident on the front and rear surface of a sample container is reflected, and the reflected wave returned into the transducer, and some of it propagate and reflect from a perfect reflector The wave from the reflector meets the boundaries and reflects and transmits repeatedly.
R r22 r11 r r − = +
(2.10) 1+R=T, we have 2 2 2 2 / / 1 2 1 2 1 r r r T r r r r = + = +1 (2.11)
The intensity transmission and reflection coefficients, TI and RI,
respectively, are in the followings (Kinsler et al. 1980, pp. 124-131, p. 462),
(2.12) 2 / | | RI = Ir Ii = R (2.13) 2 / ( /1 2) | | TI = It Ii = r r T 2 2 / 1 2 1 2 1 / 1 2 1 2 1 r r r r R I r r r r − − = = + + (2.14)
4 2 1 4 /2 1 2
( 2 1) ( /2 1 1)
r r r r
TI = r +r = r r + 2 (2.15)
Where r1 is the characteristic acoustic impedance of the medium in
which the incident and reflected wave are traveling, and r2 is that of the
medium in which the transmitted wave is traveling. In ultrasonic testing, Eqs. (2.12) and (2.13) are generally used to obtain intensity reflection and transmission coefficients between a transducer and a test material. Since the case of the material being tested in this laboratory, a thin (100 µm) layer of OHP (Overheard Projector) film was used in this experiment for an acoustic window and this thin layer should be considered to compute the intensity reflection and transmission coefficients as shown in Figure 2.3.
263.0 264.4 264.6 264.8 265.0 265.2 265.4 265.6 -3 -2 -1 0 1 2 3 4 5 Time(us) A m pli t u de ( v olt s)
RF signal with sample RF signal without sample
Figure 2.2 Amplitude difference of reflected signal from perfect reflector with and without sample
Blood Sample Reflector
A
0A
A0’ A’ Waterr
1 Waterr
1r
3r
2When a layer of finite thickness is formed between two media, an ultrasonic wave normally incident on the interface from medium 1 generates the reflected waves and transmitted waves into the layer. The transmitted wave into the layer is reflected again at the rear interface and the transmitted into medium 3. In this case, the reflection coefficient R is expressed as follows (1 1 2/ )cos 2 ( 2 3 1 2/ / )sin 2 (1 1 3/ )cos 2 ( /2 3 1 2/ )sin 2 r r k L j r r r r k L R r r k L j r r r r k L − + − = + + + (2.16)
The intensity transmission coefficient, TI is represented as follows:
(2.17) 2 1 | | I T = − R 4 2 2 2 2 2 ( /3 1 1 3/ )cos 2 (2 1 3 1 3 2/ / )sin 2 TI = + r r r r+ k L r+ r r r r r+ k L (2.18) Here
2 2 2 2 2 2 f f k C r π ρ π = =
(2.19) 4 2 2 2 2 2 ( /3 1 1 3/ )cos (2 2 2/ ) [2 /(13) (13 2)/ ]sin (2 2 2/ ) Ttotal = +r r r r+ π ρf L r +r r r +r r r π ρf L r (2.20)
, where Ttotal is the total amplitude transmission coefficient through both
bounded wrap layers. r1, r2, and r3 are the acoustic impedance of water, the
OHP film and the blood, respectively. ƒ is frequency, ρ2 is the OHP film
Chapter III
Materials and Method
3.1 Introduction
The physical properties of blood and plasma will be briefly described in this chapter. There are various approaches for the measurement of sound speed and attenuation coefficients of whole blood and plasma during coagulation. The standard pulse echo method has been used for a long time to measure the quantitative backscattering, includes sound speed and attenuation coefficient of whole blood during coagulation as a function of time or frequency (Shung et al. 1984; Voleisis et al. 2002; Wang et al. 2002). Measurement of whole blood coagulation at real body temperature, at a certain hematocrit and natural process without any chemicals, whole process of plasma coagulation with /without heparin in terms of sound speed and attenuation coefficient has been proposed. The pulse echo method was discussed in this chapter.
3.2 Properties of Blood 3.2.1 General
Blood is the fluid of life, transports oxygen from the lungs to body tissue and carbon dioxide from body tissue to the lungs. Blood is the fluid of growth, transporting nourishment from digestion and hormones from glands throughout the body. Blood is the fluid of health, transports disease fighting substances to the tissue and waste to the kidneys. It is mainly composed of about ~ 45 % of red blood cells (erythrocytes) and ~ 55% of viscous fluid
called plasma with small amount of white blood cells (leukocytes) and platelets (thrombocytes). Plasma is basically a saline solution of three major proteins including fibrinogen, globulin and albumin. The volume of red blood cells in the whole blood is defined as hematocrit and it is expressed in percentage.
Plasma contains clotting factorssuch as factor VIII, which is used in the treatment of hemophilia, albumin used for the treatment of surgical shock or severe burns, and Immunoglobulins, for protection of the body against infectious diseases and the treatment of immunodeficency. However, it must be noted that blood plasma consists of more than 90 % water. Albumin (the major component), Immunoglobulins, fibrinogens and other components used in the coagulation process. Other components are also important but the fractions are small, like lipids less then 1 gram per 100 milliliters.
3.2.2 Blood and plasma samples
Experiments were conducted using 7 ml of whole blood and 2 ml of plasma sample of ten individual healthy volunteers, without any history of bleeding or thrombosis. The blood was drawn from healthy volunteers in 20 ml syringe and a 7ml of the blood was immediately transferred to the container for measuring the acoustic properties of whole blood. The other 9 ml was placed into 1 ml of 3.8% sodium citrate solution for preparation of plasma. Before preparing plasma sample hematocrit was measured using a centrifuge (HA-200, Hanil Science Industrial). In the laboratory, plasma from blood was prepared by centrifugation of blood for 15 min at about 3500 RCF (relative centrifugal force) using a (Hanshin Medical Co. Ltd., Model-AT-650) centrifuge and than plasma was stored in -70°C until assayed.
3.2.3 Chemicals and other materials
Activated partial thromboplastin reagent aPTT (ellagic+ bovine phospholipids) and calcium chloride (CaCl2) of 0.02M were obtained from
an international reagent corporation (Japan).Heparin was obtained from a commercial pharmacy. The blood sample container was designed using acryl material of dimensions 10 cm long x 2 cm wide x 2 cm thick and in that 2 cm wide and 4 cm drill was made inthe front and back side of sample container and sealed with OHP film of 100 micron thick for acoustic window as shown in Fig 3.1
2cm 6cm 4cm 2cm Acoustic window area
3.3 Measurement procedure
Measurements were made with the experimental configuration depicted in Fig 3.2. The experiments were performed in a degassed water tank at temperature of 37.0±0.2°C. A temperature controller with a liquid circulator was used for keeping temperature constant, and temperature was continuously monitored by an immersed thermometer.
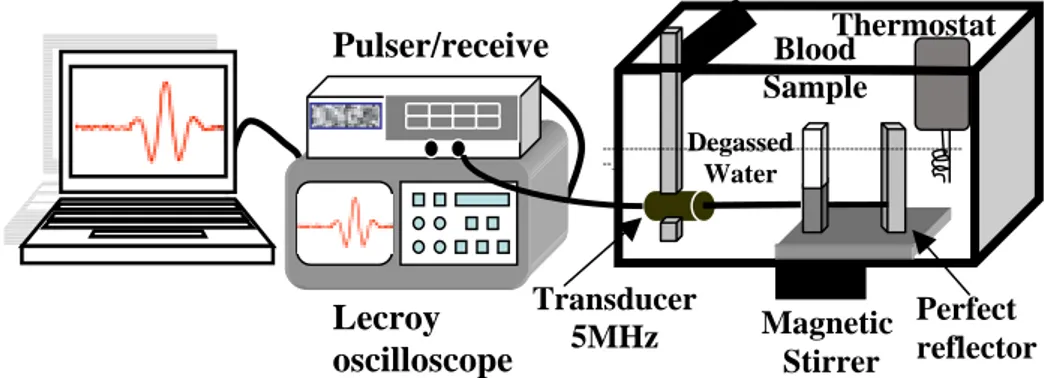
First, the acoustic impedance and sound speed of OHP film were computed using a three-layer transmission technique (Kingsler and Frey), film density and thickness were obtained from manufacturer. The attenuation coefficient of water was assumed to be negligible (Madsen et al. 1999). The sound speed and attenuation coefficient of the blood and plasma samples were determined by a pulse echo method using a Pulser/receiver (Panametrics 5800 PR, CA, USA). Blood sample was placed in the focal zone of a 5 MHz transducer (Panametrics V326) with a diameter of 9.5 mm and the sample was positioned perpendicular to the direction of propagation of ultrasound. Ultrasonic pulses were periodically transmitted at a pulse repetition frequency of 500 Hz. The distance between the transducer and the front surface of the sample was approximately 13 cm was maintained to minimize diffraction error. A magnetic stirrer at the bottom of the tank prevented the blood settling. The reflected acoustic signals from the front and back surface of the sample container and a steel reflector were digitized at a sampling rate of 250 Megasamples/s and recorded in a LeCroy (LC547AL USA) digital oscilloscope. The sound speed and attenuation of blood and plasma samples were determined by comparing the reflected signals from the reflector with and without the sample in place.
The Blood Sample rmostat Pulser/receive ---_ Degassed Water Transducer 5MHz Perfect reflector Lecroy oscilloscope Magnetic Stirrer
After coagulation, mass and volume of the coagulated blood or plasma sample were measured to find the density and acoustic impedance of blood or plasma. The experimental data were collected every 4 seconds over 65 minutes in blood coagulation and over 45 minutes in plasma coagulation. Collected data were analyzed using MATLAB® . Moving average was taken on every 15 data points of the stored data to smoothen the profiles of blood and plasma.
Chapter IV
Measurement of acoustic properties of whole blood
during coagulation
4.1 Introduction
Previous measurements of sound speed and attenuation on whole blood coagulation have shown that coagulation process may be affected by temperature, hematocrit, and thrombin or calcium chloride (Shung et al. 1984; Ossant et al. 2004; Huang et al. 2005). This observation can be interpreted that the sound speed and attenuation coefficient of human blood coagulation at real body temperature could be monitored in real time at a certain hematocrit and natural process without any chemicals.
The investigation of acoustic properties from whole blood during coagulation as a function of time at body temperature of 37°C is of interest because coagulation process depends on temperature. Since natural blood coagulation occurs without any chemicals, no chemicals are added. For these reasons, the physiological changes of blood coagulation in terms of sound speed and attenuation were investigated from whole blood after exposed to the air without adding any chemicals. The sound speed and attenuation coefficient of whole blood coagulation was measured at a frequency of 5 MHz unfocused transducer at 37°C.
Experiments were conducted using 7 ml of whole blood of ten individual healthy volunteers, without any history of bleeding or thrombosis. The blood was drawn from a forearm vein of a healthy volunteer using a syringe needle. Blood from a syringe was immediately transferred to the sample container for measuring the acoustic properties of whole blood. For each sample, all experiment set up was arranged before drawing the blood.
4.3 Method for whole blood coagulation measurement
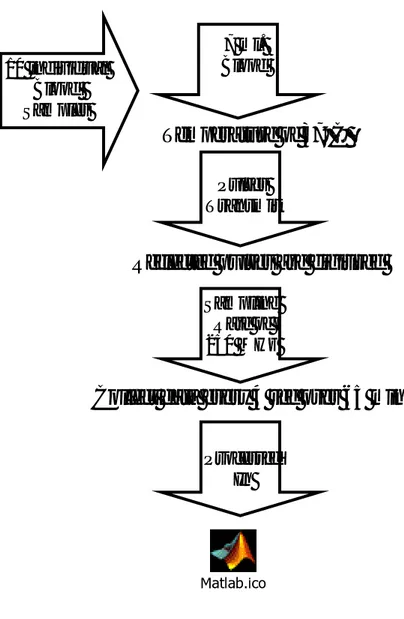
Experimental set up was shown in Fig 3.2. The test sample container was placed perpendicular to the direction of propagation of ultrasound. The temperature of water bath was adjusted to 37°C. The distance between the face of the transducer and the sample was adjusted. The correct level was initially determined using amplitude of the first echo from the front face of sample container and perfect reflector was maximized on the oscilloscope. Time was allowed for the temperature to be stabilized. The blood was drawn on site by an experienced nurse through a 10 ml syringe from a healthy volunteer at the test place. It was immediately transferred to the sample container within few seconds.Broadband pulses were transmitted at a pulse repetition frequency of 500 Hz. The reflected signals from the blood sample and a steel reflector were digitized at a sampling rate of 250 MHz. Data were collected in every 4 seconds over 65 minutes. The data were analyzed using Matlab software. The whole process was shown in block diagram as shown in Fig.4.1.
Matlab.ico 7 ml. Blood 10 individual Blood Samples
Temperature of 37°C
Pulses TransmitReflected pulses are digitized
Sampling Rate of 250 MHz
Collect data every 4 sec over 65 min
Processed In
4.4 Results
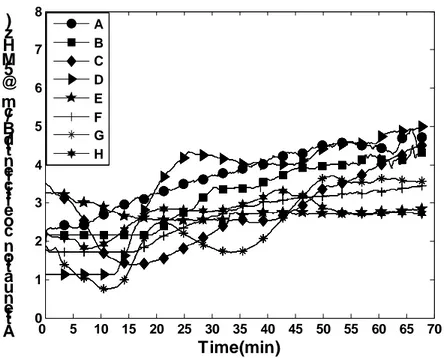
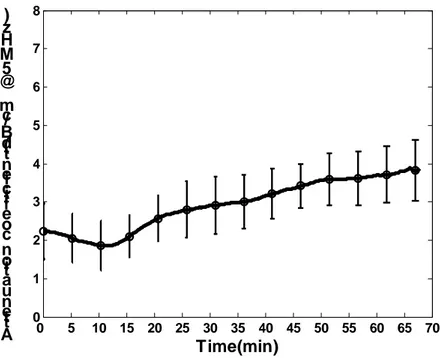
The temporal variations of sound speed and attenuation coefficient during blood coagulation at 37°C are presented in Figs. 4.2,4.4,4.5 & 4.7.The ten curves (A, B, C, D, E, F, G, H, I, J) with different markers in the figures represent sound speed and attenuation coefficient variations of ten individuals blood samples during coagulation. Out of ten blood samples, eight samples showed the same trend of curves and the other two curves show different pattern. These two samples are not consistent with the other results. These variations may be not from the measurement errors but from the differences of blood itself, since the attenuation coefficients are similar to the ones from the other blood samples. It requires further investigation. Sound speed and attenuation variations from two samples were shown separately in Figs. 4.4 & 4.7 respectively. In this research, only eight blood samples were considered for further explanation. The average sound speed of eight blood samples over an hour during coagulation was increased from 1585 m/s to 1596 m/s as shown in Fig 4.3. Lines and error bars with open circles in the Fig. 4.3 represent the average and the standard deviation of eight sample measurements, respectively. These results were in good agreement with the previous ones (Shung et al. 1984; Voleisis et al. 2002). Table 1 showed the average sound speed and attenuation coefficient of whole blood during coagulation and the results of the other groups were given for comparison.
The curves represent the peculiar stages of blood coagulation of volunteers in Fig. 4.2. At the beginning stage of coagulation process up to 5
minutes, sound speed of whole blood sharply increased. The slope became less steep after 5 minutes, and further changed at around 27 minutes. After that time, sound speed from seven blood samples was not changed much. The other one showed the different pattern from the other seven samples, though the sound speed variations are similar.
Attenuation coefficient of eight individual blood samples during coagulation was shown in Fig. 4.5 and their patterns are different from the ones of sound speed. Average attenuation coefficient of eight blood samples was increased from 2.5 dB/cm to 4.3 dB/cm at 5 MHz as shown in Fig 4.4. Lines and error bars with open circles in the figures represent the average and the standard deviation of eight sample measurements, respectively. At the beginning stage of coagulation process, the attenuation of eight blood samples was decreased or remained the same up to about 12 minutes, while the sound speed was increased. At that time it showed minimum attenuation of 2 dB/cm (Fig 4.6). After 12 min, it increased almost linearly with time over 65 minutes.
Previous researchers
K.K.Shung et al. A.Volesis et al. Parameters
Acoustic properties
Whole blood
at 370C Whole blood at 230C Whole blood at 370C
Sound speed (m/s) 1585-1596 1556-1590 1585-1600
Attenuation
coefficient (dB/cm) 2.5-4.3 1.7 - 4.0
_____
Table 1 Average sound speed and attenuation from eight samples during blood and plasma coagulation and comparison with the previous groups
0 5 10 15 20 25 30 35 40 45 50 55 60 65 70 1580 1584 1588 1592 1596 1600 Time(min) S o u n d s pe e d ( m/s ) A B C D E F G H
Figure 4.2 Sound speed variations of eight individuals during blood coagulation
0 5 10 15 20 25 30 35 40 45 50 55 60 65 70 1580 1584 1588 1592 1596 1600 Time(min) S o u n d s pe e d( m/s )
Figure 4.3 Average sound speed variation of eight individuals during blood coagulation
0 5 10 15 20 25 30 35 40 45 50 55 60 65 70 1580 1585 1590 1595 1600 1605 Time(min) S o u n d s pe e d ( m/s ) I J
Figure 4.4 Sound speed variation of nine and ten individual during blood coagulation
0 5 10 15 20 25 30 35 40 45 50 55 60 65 70 0 1 2 3 4 5 6 7 8 Time(min) Att e n u ati o n c o eff ic ie nt ( d B/c m @5 MH z) A B C D E F G H
Figure 4.5 Attenuation coefficient variation of eight individuals during blood coagulation
0 5 10 15 20 25 30 35 40 45 50 55 60 65 70 0 1 2 3 4 5 6 7 8 Time(min) Att e n u ati o n c o eff ic ie nt ( d B/c m @5 MH z)
Figure 4.6 Average attenuation coefficient variation of eight individuals during blood coagulation
0 5 10 15 20 25 30 35 40 45 50 55 60 65 70 0 1 2 3 4 5 6 7 8 Time(min) Att e n u ati o n c o eff ic ie nt ( d B/c m @5 MH z) I J
Figure 4.7 Attenuation variation of nine and ten individual during blood coagulation
4.5 Discussion
Whole blood coagulation processes were investigated in terms of acoustic properties. Sound speed and attenuation coefficient were increased during blood and plasma coagulation processes, but they changed with the different patterns. Sound speed variation changed in three phases. At first, sound speed increased sharply until about 5 minutes, followed by a gradual increase until 27 minutes and then slow change toward a steady state situation. The variation of sound speed seemed to correspond to the three physiological phases of coagulation, the enzymatic phase, the propagation phase, and the termination phase. However attenuation variation did not show the three phases. Attenuation was stable or decreased until 12 minutes and then increased linearly with time.
In the first phase, sound speed of eight blood samples started at different values but increased rapidly up to 2 m/s within 5 minutes (Fig. 4.2).At this phase, soft and gel type coagulum was formed as prothrombin converted into thrombin in both intrinsic and extrinsic coagulation pathways. After that the sound speed increased progressively, while attenuation was stable or decreased until 12 minutes. The changes of attenuation coefficient are from the changes in acoustic impedance of the clotted blood, mainly because of an increase in the reflection and the scattered energy losses (Shung et al. 1984). At this phase the coagulated blood was in elastic medium and the energy loss in elastic medium is less. The slope of sound speed and attenuation is dependent on the strength of the coagulum, which may signifies the beginning of proper coagulation because of the bulk of thrombin formation and the reaction with fibrinogen (Mann 2002). In the second phase, the sound speed showed a gradual increase until 27 minutes and sound speed of eight samples was nearly equal to the same value
(~1593 m/s) at about 27 minute which was indicated in small error bar in Fig.4.3. Attenuation was increased linearly from 2~4.5 dB/cm during this stage because the viscosity of blood increased (Wang et al. 2000; Wang and Tsui 2004). The increase of attenuation and sound speed of eight blood samples may indicate the possibility of solid fibrin polymer formation from fibrinogen (Shung et al. 1984).
The third phase of whole blood coagulation seemed to start after formation of solid fibrin, i.e. after 27 minute of coagulation. Average sound speed was increased 3 m/s smoothly until 65 minutes in whole blood. Seven curves showed almost the similar patterns of variations except one showing higher sound speed, while attenuation kept increasing until 65 minutes. This phase may be because of activation of protein C with cofactor protein S and propagation of reactions with thrombomodulin within the blood sample (Mann 1992; Comp 1982).
4.6 Conclusion
The effects of blood coagulation on the acoustic properties from ten volunteers were investigated. It was found that sound speed and attenuation of blood increased during coagulation. The variation of sound speed during whole blood coagulation showed the three distinguishable changes of slope with respect to time, and these three different variations may be comparable to the physiological phases (enzymatic, propagation and termination phases) of blood and plasma coagulation. The processes of whole blood coagulation at nearly body temperature were complicated and sound speed and attenuation fluctuations are relatively high.
Chapter V
Measurement of acoustic properties of plasma during
coagulation
5.1 Introduction
In this chapter, the whole process of plasma coagulation was measured in terms of sound speed and attenuation coefficient as a function of time. Ultrasonic backscatter signals from spherical glass particles (Alves and Machado 1991) and ultrasonic shear wave method (Alves and Machado 1994) have been employed to obtain the plasma clotting time. Ultrasonic measurements of the whole process of plasma coagulation with aPTT were not yet reported. The structural changes of whole process of plasma coagulation with aPTT as function of time were measured as temporal changes of sound speed and attenuation this research.
5.2 Plasma preparation
Experiment was performed using 2 ml of plasma of ten individual healthy volunteers, without any history of bleeding or thrombosis. 6 ml of blood was drawn from a forearm vein of a healthy volunteer using a syringe needle. After discarding the first milliliter, 90% volume of blood was collected in a polystyrene tubes containing 10% volume of 3.8% trisodium citrate. The blood was centrifuged for 15 min at about 3500 RCF (relative centrifugal force) using a centrifuge (Hanshin Medical Co. Ltd., Model-AT-650) and then plasma was separated andstored in -70°C until assayed.
5.3 Method for plasma coagulation measurement
Experiment was performed with plasma samples of ten individuals. The experimental set up was shown in Fig. 3.2 and the same as used in the measurement of the blood coagulation, as explained in chapter 4. For all plasma sample measurements, 2 ml of plasma was placed into a sample container using a pipette and incubated at 37±0.2°C for not longer than 5 minutes to avoid loss of factors V and VII. Then 2 ml of aPTT was added and thoroughly mixed by using a magnetic stirrer. After incubation for 5 minutes to reach thermal equilibrium, 2 ml of pre-incubated calcium chloride (0.02M) solutions was added for initiation of coagulation. Ultrasonic broadband pulses were transmitted at a pulse repetition frequency of 500 Hz. The reflected signals from the plasma sample and a steel reflector were digitized at a sampling rate of 250 MHz. Data were collected in every 4 seconds over 45 minutes. Post-processing was done in Matlab software. The block diagram of whole process of plasma coagulation was as shown in Fig. 5.1.
Matlab.ico 2 ml. Plasma 10 individual Plasma Samples
+
Incubate 3min. at 37°C
Incubate 4~5min. at 37°C
2 ml. aPTT+
Pre-Incubated at 37°C
2 ml. CaCl2 Pulses TransmitReflected pulses are digitized
Sampling Rate of 250 MHz
Collect data every 4 sec over 45 min
Processed In
5.4 Results
Sound speed and attenuation variations of ten individuals during plasma coagulation at 370C are presented in Figs 5.2, 5.3, 5.5 & 5.7. The curves (A, B, C, D, E, F, G, H, I, J) with different markers in the figures represent the structural changes of ten plasma samples during coagulation. In case of plasma, eight samples out of ten plasma samples, showed the same trend of curves and the other two curves showed the different pattern. These two samples variations are not consistent with the other result. . These variations may be not from the measurement errors but from the differences of plasma itself, since one sample sound speed and the other sample attenuation coefficient are similar to the ones from the other plasma samples. It requires furtherinvestigation. Sound speed and attenuation variations of two samples were shown separately in figures 5.4 & 5.7 respectively. In this research, only eight plasma samples were considered for further explanation. The average sound speed of eight plasma samples over 45 min of coagulation was increased from 1535 m/s to 1542 m/s which was shown in Fig 5.3. Lines and error bars in the figures represent the average and the standard deviation of eight samples, respectively. The plasma coagulation process is significantly faster compared to the blood coagulation. At initial phase the sound speed was increased rapidly over about 5 minutes. Between 5 to 27 minutes, it increased slowly and after that it remained the same. Sound variations among different plasma samples are smaller excluding one sample (A) of higher sound speed.
The variation of ten individuals attenuation coefficient of plasma during coagulation is shown in Figs. 5.5 & 5.7. Figure 5.6 shows the average and the standard deviation values of the relative attenuation coefficient of plasma during coagulation as a function of time. Average attenuation
coefficient of eight plasma samples was increased form 1.2 dB/cm to 3.1 dB/cm. Attenuation coefficient was linearly increased over 45 minutes except at an early stage of a few minutes. The variation among the different samples was small, it was indicating clearly by small error bars (Fig. 5.6). It was increased linearly even after the sound speed was not changed.
0 5 10 15 20 25 30 35 40 45 50 1530 1534 1538 1542 1546 1550 Time(min) S o u n d s pe e d ( m/s ) A B C D E F G H
Figure 5.2 Sound speed variation of eight individuals during plasma coagulation
0 5 10 15 20 25 30 35 40 45 50 1530 1534 1538 1542 1546 1550 Time(min) S o u n d s pe e d( m/s )
Figure 5.3 Average sound speed variation of eight individuals during plasma coagulation
0 5 10 15 20 25 30 35 40 45 50 1530 1534 1538 1542 1546 1550 Time(min) S o u n d s pe e d ( m/s ) I J
Figure 5.4 Sound speed variation of nine and ten individual during plasma coagulation
0 5 10 15 20 25 30 35 40 45 50 0 1 2 3 4 5 6 7 8 Time(min) Att e n u ati o n c o eff ic ie nt ( d B/c m @5 MH z) A B C D E F G H
Figure 5.5 Attenuation coefficient variation of eight individuals during plasma coagulation
0 5 10 15 20 25 30 35 40 45 50 0 1 2 3 4 5 6 7 8 Time(min) Att e n u ati o n c o eff ic ie nt ( d B/c m @5 MH z)
Figure 5.6 Average attenuation coefficient variation of eight individuals during plasma coagulation
0 5 10 15 20 25 30 35 40 45 50 0 1 2 3 4 5 6 7 8 Time(min) Att e n u ati o n c o eff ic ie nt ( d B/c m @5 MH z) I J
Figure 5.7 Attenuation variation of nine and ten individual during plasma coagulation
5.5 Discussion
Sound speed of plasma also showed three phases of coagulation. Plasma coagulation process was fast compared to whole blood and not much varied among the samples. In the first phase, sound speed and attenuation of eight individuals are different from each other and sound speed was increased rapidly up to around 4 m/s within 5 minutes in Fig. 5.2. However, attenuation was decreased or stable,probably because sound speed depends on bulk modulus and density. For plasma coagulation, initial enzymatic reactions during intrinsic and extrinsic pathways made the coagulum soft and stable.In second phase, the sound speed increased slowly for 7 subjects (except curve “A” in Fig. 5.2). Sound speed reached the same value (~1540m/s) at about 27 minute but attenuation increased linearly from 1 dB/cm to 3.1 dB/cm over 45 minutes. The slow increase of sound speed and linear increase of attenuation may indicate the possibility of thrombin reaction with fibrinogen and formation of fibrin.
The third phase of plasma coagulation seemed to start after formation of solid fibrin, i.e. after 27 minute of coagulation; sound speed was increased smoothly in 45 minutes in plasma. Seven curves showed almost the similar patterns of variations except one showing higher sound speed, while attenuation kept increasing linearly even after sound speed reaches to the same value. This phase may be because of activation of protein C with cofactor protein S and propagation of reactions with thrombomodulin within the blood sample (Mann 1992; Comp 1982).
Comparing Fig.4.2 with Fig.5.2, the responses of sound speed of blood and plasma were different during formation of clot. Blood coagulation is more complex and slower than plasma coagulation. From Figs. 5.2 and 5.5, sound speed of plasma changedfaster only at the initial stage of the clotting
process, while attenuation was increased linearly with time even after sound speed was not changed. Simultaneous monitoring of sound speed and attenuation may give a better understanding of the process of coagulation. Sound speed and attenuation curves of J & I shown in Figs. 5.4 & 5.7, respectively revealed that variations are different from the other curves because the rate of conversion of fibrinogen to the insoluble product fibrin or activation of blood coagulation factors may be different from the others. Attenuation coefficient of plasma was increased almost linearly as shown in Fig. 5.6. For plasma coagulation, an amount of aPTT and calcium chloride at the body temperature have impacts on determination of the rate of coagulation. Coagulation process is also dependant on the temperature and the coagulation factors of blood, so all experiments have been performed in the body temperature. For plasma coagulation, clinical laboratories usually calibrate the procedures and equipments for coagulation test, and aPTT is usually in the range of 24-32 sec. Deviation from the aPTT time indicates that some coagulation factors malfunctioned in the process. It needs to be resolved in the future and may give more information about blood clotting process. More works are needed in order to understand the mechanisms of the change of sound speed and attenuation during the coagulation of plasma. Measurements in a wide frequency range and as a function of temperature with more samples may give additional information on coagulation process of blood and plasma.
5.6 Conclusion
The effects of plasma coagulation on the acoustic properties from ten volunteers were investigated. It was found that sound speed and attenuation of plasma increased during coagulation. Unlike the aPTT time alone, the monitoring of sound speed and attenuation during whole process of plasma coagulation using ultrasound may give additional information. The variation of sound speed during plasma coagulation also showed the three distinguishable changes of slope with respect to time, and these three different variations may be comparable to the physiological phases of plasma coagulation. Attenuation of plasma increased linearly even after the sound speed was not changed. It may be because of some factors are malfunctioned with in the sample.
Chapter VI
Measurement of acoustic properties of plasma
during coagulation with Heparin
6.1 Introduction
Plasma coagulation with an anti-coagulant was studied in this chapter. Commercially available brand of heparin was selected to study the effects of specific factors and process of coagulation. It has been found that heparin is an effective antithrombotic agent that reduces morbidity and mortality among the patients with deep vein thrombosis, pulmonary embolism and also prevents treatment of cardiovascular disorders. Patients are commonly administered by heparin to minimize the risks associated with surgical procedures. The activated partial thromboplastin time (aPTT) and the activated clotting time (ACT) are the most extensively applied measurements of the heparin effect. Accurate evaluation of the effect of heparin is crucial because of the heparin responses vary greatly among the individuals. A monitoring system of whole process of coagulation must be established.
A coagulation analyzer was frequently used to quantify the perfusion of heparin as a function of aPTT or ACT time format in clinical tests (Cheng et al.1998,Hepel et al.1999). It provides results within minutes so that rapid adjustment of heparin therapy can be made. However, these instruments are unable to monitor the whole process of heparin therapy in diagnostics. Therefore, ultrasonic method was used to measure sound speed and attenuation coefficient variations in plasma during coagulation with heparin.
The physical properties of plasma coagulation with heparin have been studied in terms of sound speed and attenuation as a function of time, the effects of plasma coagulation without and with heparin have also been investigated. The measurements verified that the sound speed and attenuation variations are significantly affected by heparin during coagulation process.
6.2 Method for plasma coagulation with heparin measurement
Experiment was performed with plasma samples of five individuals. The experimental set up was shown in Fig. 3.2 and the same as used in the measurement of the blood coagulation, as explained in chapter 4. For all plasma coagulation with heparin measurements, 0.9 ml of plasma was placed in to the sample container using 1 ml capacity pipette and incubated at 37±0.2°C for not longer than 5 minutes to avoid loss of factors V and VII. Then 0.1 ml of 100 µg/ml concentrated heparin was added using 20~200 µl capacity pipette. After 1 minute 1 ml of aPTT was added and this mixture was thoroughly mixed by using a magnetic stirrer and incubated for 5 minutes to reach thermal equilibrium. After that 1 ml of pre-incubated calcium chloride (0.02M) solutions was added for initiation of coagulation. Ultrasonic broadband pulses are transmitted at a pulse repetition frequency of 500 Hz. The reflected signals from plasma sample and steel reflector were digitized at a sampling rate of 100 MHz using NI high speed digital oscilloscope (PCI-5122, National instrument, Austin, TX, USA). Data were collected every 4 seconds over 30 min. collected data were analyzed using LABVIEW software to obtain plasma profiles in real time. The block diagram of whole process was as shown in Fig 6.1.
1 ml.
Plasma Incubate 3min. at 37°C 5 individual
Plasma Samples
+
0.1 ml.
Heparin After 1 minute
+
Incubate 4~5min. at 37°C 1 ml. aPTT+
1 ml. CaCl2 Pre-Incubated at 37°C Pulses TransmitReflected pulses are digitized
Sampling Rate of 100 MHz
Collect data every 4 sec over 30 min
Processed
In
6.3 Results
Sound speed and attenuation coefficient variations of five individuals during plasma coagulation at 37°C are presented in Figs 6.2 & 6.4. The curves (A, B, C, D, and E) with different markers in the figures represent the structural changes of five plasma samples with heparin during coagulation. The average sound speed of five plasma samples was increased 1 m/s at initial stage of 5 minutes after that it reached to steady state. The peak value of sound speed was showed after 3 minutes of coagulation (Fig. 6.3), after that it slightly decreased and reached to steady state at about 5 min. From 5 minutes to over 10 minutes the sound speed was not changed as shown in Fig. 6.2. Lines and error bars with open circles in Fig. 6.3 represent the average and the standard deviation of five measurements, respectively. Sound speed variations among different plasma samples are smaller.
Attenuation coefficient of plasma coagulation with heparin slightly increased for first few seconds after that it was observed to be stable (fig 6.4). Fig 6.5 shows the mean and the standard deviation value of relative attenuation coefficient parameters of five plasma samples measurements, respectively. Attenuation coefficient of plasma coagulation with heparin did not show any significant variation.
0 1 2 3 4 5 6 7 8 9 10 1532 1533 1534 1535 1536 1537 1538 Time(min) S o u n d s pe e d ( m/s ) A B C D E
Figure 6.2 Sound speed variation of five individuals during plasma coagulation with heparin