Measurement Using Cloned Competitors
Hyun-Kyoung Kim1,6, Hai-Li Hwang1, Seong-Yeol Park1, Kwang Man Lee2, Won Cheol Park2, Han-Seong Kim3, Tae-Hyun Um4, Young Jun Hong5, Jin Kyung Lee5, Sun-Young Joo6¤, Ju-Young Seoh6,
Yeong-Wook Song7, Soo-Youl Kim1, Yong-Nyun Kim1*, Kyeong-Man Hong1*
1 Research Institute, National Cancer Center, Ilsandong-gu, Goyang, Korea, 2 Department of General Surgery, Wonkwang University School of Medicine, Iksan, Korea, 3 Department of Pathology, Inje University Ilsan Paik Hospital, Ilsanseo-gu, Goyang, Korea, 4 Department of Laboratory Medicine, Inje University Ilsan Paik Hospital, Ilsanseo-gu, Goyang, Korea,5 Department of Laboratory Medicine, Korea Cancer Center Hospital, Nowon-gu, Seoul, Korea, 6 Department of Microbiology, Ewha Womans University School of Medicine, Ewha Medical Research Center, Seoul, Korea,7 Department of Internal Medicine, Seoul National University Hospital, Seoul National University College of Medicine, Seoul, Korea
Abstract
Variations and alterations of copy numbers (CNVs and CNAs) carry disease susceptibility and drug responsiveness implications. Although there are many molecular methods to measure copy numbers, sensitivity, reproducibility, cost, and time issues remain. In the present study, we were able to solve those problems utilizing our modified real competitive PCR method with cloned competitors (mrcPCR). First, the mrcPCR for ERBB2 copy number was established, and the results were comparable to current standard methods but with a shorter assay time and a lower cost. Second, the mrcPCR assays for 24 drug-target genes were established, and the results in a panel of NCI-60 cells were comparable to those from real-time PCR and microarray. Third, the mrcPCR results for FCGR3A and the FCGR3B CNVs were comparable to those by the paralog ratio test (PRT), but without PRT’s limitations. These results suggest that mrcPCR is comparable to the currently available standard or the most sensitive methods. In addition, mrcPCR would be invaluable for measurement of CNVs in genes with variants of similar structures, because combination of the other methods is not necessary, along with its other advantages such as short assay time, small sample amount requirement, and applicability to all sequences and genes.
Citation: Kim H-K, Hwang H-L, Park S-Y, Lee KM, Park WC, et al. (2013) Simple and Versatile Molecular Method of Copy-Number Measurement Using Cloned Competitors. PLoS ONE 8(7): e69414. doi:10.1371/journal.pone.0069414
Editor: Richard C. Willson, University of Houston, United States of America Received March 25, 2013; Accepted June 10, 2013; Published July 30, 2013
Copyright: ß 2013 Kim et al. This is an open-access article distributed under the terms of the Creative Commons Attribution License, which permits unrestricted use, distribution, and reproduction in any medium, provided the original author and source are credited.
Funding: This work was supported by a research grant to KMH from the National Cancer Center (1110130). The funders had no role in study design, data collection and analysis, decision to publish, or preparation of the manuscript.
Competing Interests: The authors have declared that no competing interests exist. * E-mail: kmhong@ncc.re.kr (KMH); ynk@ncc.re.kr (YNK)
¤ Current address: Wake Forest Institute for Regenerative Medicine, Wake Forest University Health Sciences, Medical Center Boulevard, Winston-Salem, North Carolina, United States of America
Introduction
Copy-number variations (CNVs) are a quite common polymor-phism [1], and have been partially implicated in inter-individual differences in susceptibility to many human diseases. CNVs in FCGR3B, CCL3L1, and C4 for systemic lupus erythematosus (SLE) [2,3,4,5], DEFB4 for Crohn disease [6], alpha-defensin for Psoriasis [7], CCL3L1 for susceptibility to HIV-1 infection [8], the RHD gene for the Rh-negative blood group [9], and the alpha-globin gene for alpha-thalassemia [10], have been reported. Copy-number alterations (CNAs) are major structural changes in cancer [11], and as such, are predictive markers for cancer patients. ERBB2 amplification for anti-ERBB2 inhibitor treatment in breast [12] and gastric adenocarcinomas [13], EGFR amplifi-cation for anti-EGFR inhibitors [14,15], MET amplifiamplifi-cation for MET tyrosine kinase inhibitors [16,17], and FGFR2 amplification for FGFR2 phosphorylation inhibitors [18] have been reported as predictive markers. Integrative analyses of CNAs with gene expression and other molecular changes such as DNA methyla-tion, and microRNA profile, have recently identified new
subgroups in breast cancer, which could contribute the manage-ment of cancer patients [19,20].
Array-based methodologies have been used for high-throughput screening of large numbers of CNVs and CNAs. Validation and clinical application of those candidate CNVs and CNAs, however, each require simpler and more accurate methodologies, but have problems in cost, sensitivity, simplicity, and reproducibility. Simple multiplex fluorescent PCR methods have, with acceptable accuracies, been used for validation or clinical application [21,22], but have been prone to experimental variability. Recently, the Paralog Ratio Test (PRT) has been utilized for accurate measurement of CNVs using repeated DNA elements as internal references, and was successfully adapted to measure CNVs of FCGR3A and FCGR3B [23]. However, the PRT has limitation in that it is dependent on available dispersed repeat sequences that are similar to the target genes [24]. In addition, for the measurement of FCGR3A and FCGR3B, an independent Restriction Enzyme Digest Variant Ratios (REDVR) methodology should be combined [23].
Competitive PCR has been employed for precise nucleic acid quantification, and its modified version of competitive PCR
employing a modified exogenous sequence has also been applied to the measurement of DNA copies [25]. However, its requirement for meticulously accurate measurements of input genomic DNA amounts greatly hampers its clinical application [25,26]. Another modified method of the competitive PCR employing multiple modified exogenous reference sequences was applied to measure mRNA quantification, as previously pub-lished as real competitive PCR [27]. Real competitive PCR has shown unsurpassed accuracy and reproducibility for quantifica-tion of mRNA amounts showing 2-1,000,000 copy differences [27]. However, its application for detection of subtle variation of gene copy numbers has not been easy, and as yet, there have been no reports on its reproducibility or reliability for gene copy determination. In the present study, we modified the real competitive PCR methodology and applied the respective versions to the measurement of gene copy status. We first established our modified real competitive PCR (mrcPCR) method for measurement of ERBB2 copy status, and the results in primary breast cancer tissues were compared with those for the standard immunohistochemistry (IHC) and fluorescence in situ hybridization (FISH) methodologies. Second, we established mrcPCR assays for 24 drug-target genes, used it to determine the copy status in a panel of NCI-60 cells, and compared the results with those for real-time quantitative PCR and a microarray, respectively. Third, an mrcPCR assay was established for simultaneous measurement of CNVs of FCGR3A and FCGR3B, and the results were compared with those for the combined PRT/REDVR methodology.
Materials and Methods Cell lines and tumor specimens
NCI-60 cell lines were acquired from the National Cancer Institute (MTA No. 2702–09). MDA-MB-453 and JIMT1 cells were purchased from the Korean Cell Line Bank (Seoul, Korea). The institutional review boards of the National Cancer Center and Wonkwang University approved access to and usage of forty-six fresh frozen breast cancer tissues, fifty two control blood genomic DNAs. Institutional review boards waived the need for informed consents in patients whose samples were taken before 2005 according to the Enforcement Decree of Bioethics and Safety Act in Korea.
DNA isolation
DNAs from the cancer cell lines, fresh frozen breast cancer tissues, and blood cells were isolated using the DNeasy Blood and Tissue Kit (Qiagen, Valencia, CA) and TE buffer (10 mM Tris, 1.0 mM EDTA, pH 8.0) for DNA solubilization. DNA for breast cancer tissues was extracted from 10 to 20 tissue sections (10 mm thick). The cancer cell percentages in the tissues were evaluated using a hematoxylin and eosin (H&E)-stained section. Reference DNA samples from the Research Cell Bank of the Fred Hutchinson Cancer Research Center (IHWG consanguineous panel) were purified again with the DNeasy Blood and Tissue Kit, because the reference DNA samples were contaminated with RNA. The purified DNA stock was maintained in 280uC freezer, and the diluted DNA from the stock using distilled water (Gibco, Carlsbad, CA) was stored at a concentration of 10 ng/ml at 220uC.
To isolate DNA from formalin-fixed paraffin-embedded (FFPE) samples, 2–3 paraffin-embedded tissue sections (20 mm thick) were de-paraffinized, and the tissue was incubated in 1 M sodium thiocyanate overnight at 37uC, followed by Proteinase K
treatment at 55uC for about 44 h. Then, genomic DNA was isolated using the DNeasy Blood and Tissue Kit.
Cloning of competitor DNA sequences used in modified real competitive PCR (mrcPCR)
The competitor sequences were amplified with the primer pairs listed in Tables S2–S4 (Genotech, Daejon, Korea), and the amplified products were cloned into the pGEM-T easy vector (Promega, Madison, WI). The Site-Directed Mutagenesis kit (Stratagene, La Jolla, CA) was used to introduce artificial base changes into the competitor sequences, and the modified bases are listed in Tables S2–S4. The SNP database (http://genome.ucsc. edu/) was consulted to avoid SNP sites in the primer sequences for the PCR or extension reaction. The cloned competitors were digested with restriction enzyme SalI (Fermentas, Glen Burnie, MD), and the mixture of cloned competitors was diluted with distilled water (Gibco) and aliquoted. The competitor plasmids will be available in Addgene (www.addgene.org).
Establishment of mrcPCR for determination of gene copy number of ERBB2 or 24 drug-target genes
To determine the ERBB2 copy status, two ERBB2 sequences (5-ERBB2 and 3-(5-ERBB2) and two reference sequences (ALDOC and G6PC3) were utilized as ERBB2 and reference gene competitors, respectively. To determine the copy numbers for the 24 genes, six multiplex PCR and six extension reactions were performed using five competitors comprising four different drug-target gene sequences and the IGF1 sequence as a reference. Aliquots of competitor mixtures, primer mixtures, and extension primer mixtures were used to obtain consistent results.
For an mrcPCR assay, the genomic DNA (10 ng) was mixed with competitor mixture containing 10–50 fg of each competitor, and primers (5 pmole), to a final 10 ml volume (primers and modified sequences in Tables S2 and S3). The mixture was then denatured at 98uC for 5 min prior to the PCR. After the extra-denaturation procedure, PCR buffer II (Roche, Mannheim, Germany), dNTP mixture (Roche, final 0.25 mM), MgCl2
(Roche, final 2.5 mM), and Taq polymerase (Intron Biotechnol-ogy, SungNam, Korea; final 1.5 Unit) in a 10 ml volume was added to the denatured mixture, after which the PCR cycle was performed as follows: denaturation at 94uC for 5 min, followed by 32 cycles of 10 s at 95uC, 30 s at 58uC, and 30 s at 72uC. After the amplification reaction, the amplified products were purified using the AxyPrep PCR Clean-up kit (Axygen, Union City, CA) to remove leftover primers with a final volume of 30 ml. The PCR products were then confirmed in 5% NuSieve agarose (Lonza, Rockland, ME). Subsequently, a single-base extension was performed with the SNaPshot multiplex kit (Applied Biosystems, Foster City, CA) using 2 pmole of extension primers (Tables S2 and S3) and 1 ml of the purified PCR products. The single-base-extension reactions involved 15 cycles of 10 s at 96uC, 5 s at 50uC, and 30 s at 60uC. Alkaline phosphatase (Roche) was then treated for 15 min at 37uC, the product of which was applied to electrophoresis in an automatic sequencer (ABI 3100, Applied Biosystems) with the POP6 polymer (Applied Biosystems).
The mrcPCR method requires only about three hours: 1 hour for extra-denaturation and PCR, 15 min for PCR product purification, 15 min for SNaPshot reaction, 15 min for alkaline phosphatase treatment, 5 min for denaturation, and 30 min for automatic-sequencer analysis. For easier understanding of mrcPCR method, the detailed procedure was described in Methods S1.
Establishment of mrcPCR for determination of gene copy numbers of FCGR3A and FCGR3B
For competitive amplification, the FCGR3 sequence where the nucleotides of FCGR3A (C) and FCGR3B (T) differ was chosen (C733T, Arginine.Stop), and the base was changed to A for the FCGR3 competitor. For the IGF1 competitor, two bases at different sequences of wild-type IGF1 were changed. In the amplification step, the sequences of FCGR3 competitor, genomic FCGR3A, and genomic FCGR3B were amplified competitively, as were the sequences of the IGF1 competitor and genomic IGF1. The competitive PCR was performed under the same conditions, including the extra-denaturation procedure, as for ERBB2 or the 24 drug-target genes, using the primers listed in Table S4.
The relative amounts of those amplified sequences could be calculated from the relative signals of the extended bases by single-base-extension reaction, which was performed exactly as for ERBB2 mrcPCR, using the extension primers listed in Table S4.
Analysis of peak ratios in mrcPCR results
The single-base-extended products were analyzed using a GeneScan software ver.3.7 (Applied Biosystems), and four peak pairs were shown in the mrcPCR results for ERBB2. Each peak pair consisted of one signal from the genomic DNA and the other from the competitor. The four peak pairs for ERBB2 copy status are shown: 1) genomic (A) and competitor (a) peaks of the 3-ERBB2 sequence; 2) genomic (B) and competitor (b) peaks of the 5-ERBB2 sequence; 3) genomic (C) and competitor (c) peaks of G6PC3; 4) genomic (D) and competitor (d) peaks of ALDOC. The signal ratios (SRs: A/a, B/b, C/c, and D/d) for each pair of genomic competitor peak heights were calculated, after which the relative ratios (RRs: Ad/aD, Bd/bD, Cd/cD, Dd/dD = 1) of the SRs were obtained using ALDOC as a reference. Then, the RR values were divided by the mean RR values (aveRR) from 10 control genomic DNA samples in order to obtain the normalized RR (nRR) values representing the copy status of a specific gene. The mean nRR values of 5-ERBB2 and 3-ERBB2 relative to ALDOC were used for further analysis when there was no apparent change in the nRR of G6PC3. When the ERBB2 copy numbers in tumor tissues were calculated, the tumor fraction determined from the H&E slides was again considered in order to obtain the corrected nRR values, according to the following formula: corrected nRR = [nRR – (1– tumor fraction)]/(tumor fraction), where the tumor fraction is the number of tumor cell nuclei divided by the number of total cell nuclei in a H&E slide.
In the copy-number determination for the 24 target genes, five peak pairs were shown, and the peak heights were used to calculate the SRs for each sequence, and were then used to calculate the RRs using IGF1 SR as a reference, as in the ERBB2 mrcPCR assay analysis. Then, the RR values were divided by the mean RR values (aveRR) from10 control genomic DNA samples for each gene in order to obtain the normalized RR (nRR) values representing the copy status of a specific gene.
The analysis of the mrcPCR results for FCGR3A and FCGR3B was performed similarly to that for ERBB2 or the 24 drug-target genes; the procedure differed somewhat in that two different base ratios were used for FCGR3 or IGF1 SRs. The signal peaks of the C (from genomic IGF1) and A (from competitor IGF1) base-extended EP1 products were used to calculate the SRa for IGF1, and the signal peaks of the T (from genomic IGF1) and A (from competitor IGF1) base-extended EP2 products were used to calculate the SRb for IGF1. The signal peaks of the C (from genomic FCGR3A) and A (from FCGR3 competitor) base-extended EP3 products were used to calculate the SRa for
FCGR3A, and the signal peaks of the T (from genomic FCGR3B) and A (from the FCGR3 competitor) base-extended EP3 products were used to calculate the SRb for FCGR3B. The SRa for IGF1 was then used to calculate the RRa value for FCGR3A, and the SRb for IGF1 was used to calculate the RRb value for FCGR3B. Since control samples are not available, the most common alleles of FCGR3A or FCGR3B were assumed to have two copies, as reported previously [23]. Accordingly, the median RR values for FCGR3A and FCGR3B, excepting the samples for which they were high or low outliers, were employed for the normalization, and the resultantly normalized RR (nRR) values were used for further analysis.
To compare the results by mrcPCR with those by PRT/ REDVR, the sum of the nRR values of FCGR3A and FCGR3B (nRRa+b), and the ratio of the nRR values of FCGR3B to FCGR3A (nRRb/a) were used.
Absolute quantification of FCGR3A and FCGR3B copies by mrcPCR using cloned plasmids
When the reference-gene-copy number is known, the absolute copy number of the target gene could be deduced from the standard curve of the RR values from the mixtures of the cloned target and reference plasmids. The FCGR3A, FCGR3B, and IGF1 sequences were amplified with PCR primers (Table S4), and the plasmids were digested with SalI, as the competitor treatment. After determining the concentration of the purified plasmids using the Quant-iT PicoGreen dsDNA Reagents (Invitrogen, Eugene, OR), each plasmid was diluted into 50 ng/ml. The diluted FCGR3A or FCGR3B plasmid was admixed in various ratios with the IGF1 plasmid to a final volume of 10 ml. Then, each mixture was diluted 106-fold to a final IGF1 plasmid concentration of 10 fg/ml. The diluted mixture was employed in the mrcPCR in place of genomic DNA sample under the same conditions. To calculate the RR values, the same formulas were used, because the same base-extended EP3 products as for the genomic DNA samples appeared in the electrophoregram. Based on the RR values for each plasmid mixture, the standard curve was plotted as shown in Figs. S2A and S2B for FCGR3A and FCGR3B, respectively. Microarray Analysis
A HumanCytoSNP-12 microarray (Illumina, San Diego, USA), as performed by SNP Genetics (Seoul, Korea), was used to determine the copy numbers in the COLO205 and OVAR-4 cells. In the analysis, 200 ng of DNA was used as the input for a single array. DNA amplification, tagging and hybridization were performed according to the manufacturer’s protocol, and the array slides were scanned on an iScan Reader (Illumina).
For the comparison with the mrcPCR results, the average copy-number values for six SNP sites located within or near the specific genes in the microarray results were used, because the signal variation from the microarray data was relatively high for each individual SNP site.
Determination of ERBB2 status by immunohistochemistry and/or fluorescence in situ hybridization
Immunohistochemical (IHC) results from hospital record were used. When no hospital record of IHC result was available, IHC staining was performed after preparation of FFPE tissues from fresh frozen cancer tissues. Borderline cases (2+ in IHC) were analyzed by FISH (fluorescence in situ hybridization). Scoring for IHC and FISH was performed according to ASCO guidelines [28].
Quantitative real-time PCR for copy-number determination
Quantitative real-time PCR (LightCycler 480, Roche, Indiana-polis, IN) using the SYBRGreen Reagent Kit (Roche) with the primers listed in Table S5 were performed to determine the PTK2, MYC, and FGFR1 copy numbers using IGF1 as a reference gene and 10 ng as the input sample amount, as follows: denaturation at 94uC for 5 min, followed by 40 cycles at 94uC for 10 s, 55uC for 10 s, and 72uC for 30 s. The copy number was calculated according to the fold changes relative to the normal control (2_DDCt), as previously described [29].
Measurement of FCGR3A and FCGR3B copy numbers by PRT and REDVR
The PRT and REDVR assays were performed as previously reported [23], excepting minor modifications. In order to obtain more stable amplification products for both assays, modified longer primers were used (Table S6). The REDVR PCR products were purified using the AxyPrep PCR Clean-up kit (Axygen, Union City, CA), digested with TaqI, and then analyzed on the ABI sequencer. The PRT PCR products were diluted 100-fold, and analyzed on an ABI sequencer as previously reported.
In order to incorporate an extra-denaturation procedure into the PRT and REDVR assays, sample DNA and primers in a 10 ml volume were denatured at 98uC for 5 min. After the denaturation, the other components were mixed to a final volume of 20 ml, and amplification was performed as previously reported [23].
The FCGR3A and FCGR3B copies were calculated from the PRT ratio and REDVR b/a, the PRT ratio being the ratio of the peak area of FCGR3 to that of the reference sequence on chromosome 18, and the REDVR b/a, the ratio of the peak areas of 185-bp FCGR3B to 136-bp FCGR3A. The FCGR3A copy was calculated by the formula (PRT ratio)/(1+ REDVR b/a), and the FCGR3B copy by (REDVR b/a)*(PRT ratio)/(1+ REDVR b/a). Whereas the FCGR3A copies calculated from the combination of PRT/REDVR methods were directly used, the FCGR3B copies were normalized using median FCGR3B copy value in the tested samples excepting high or low outliers.
Statistical Analysis
The statistical significance of the difference between the Log R ratio by microarray and the nRR of the 24 drug-target genes by mrcPCR was tested by Pearson correlation after logarithmic transformation of the nRR values to normalize the distributions. The significance of the difference between the quantitative real-time PCR and mrcPCR results was tested by Pearson correlation after logarithmic transformation. nRRa+b and the PRT ratio were compared by Pearson correlation test after logarithmic transfor-mation of the values from both methods. REDVR b/a and nRRb/a were compared by Pearson correlation test after logarithmic transformation of the values from both methods. Finally, the correlation for two types of assays or for two measurements of a single assay was tested by Pearson correlation after logarithmic transformation of the values.
Results and Discussion
In the present study, we modified the real competitive method [27], and tested whether the modified real competitive PCR (mrcPCR) could be applied to gene copy determination. The principles of real competitive PCR and mrcPCR are similar in that they both entail the use of competitor sequences with an artificially introduced base. However, the mrcPCR embodies modifications for measurement of subtle copy-number difference: Cloned
competitors instead of synthetic oligonucleotides, and an auto-matic sequencer instead of MALDI-TOF MS spectrometry, are employed. Thus in mrcPCR, longer competitor sequences can be employed for more reproducible competitive amplification, and the use of a more widely available automatic sequencer promises to enhance the accessibility of this method. Other modifications, including the inclusion of an extra-denaturation procedure and the removal of remnant PCR primers prior to single-base-extension reaction, were introduced for accurate gene copy assessment. The mrcPCR and its differences with real competitive PCR are schematically presented in Figure 1.
Measurement of ERBB2 amplification by mrcPCR in breast cancer tissues
Because of the availability of the standard IHC and/or FISH methods for ERBB2 copy status determination [28], the mrcPCR assay for this gene was established. In the assay, two sequences of ERBB2 (marked 5-ERBB2 and 3- ERBB2) were employed along with two reference genes, namely G6PC3 and ALDOC, in 17q (Fig. 2A). Cloned competitors for the two ERBB2 sequences, and two reference genes were digested with restriction enzyme, owing to the fact that employment of the undigested competitor plasmids for mrcPCR yielded inter-assay variations, probably due to the plasmid structural variations between the relaxed and closed circular forms. In order to reduce the effects of plasmid structural variation, an extra-denaturation procedure prior to the compet-itive PCR was used as well.
In the mrcPCR assay, the signal ratios (SRs) of the competitor and corresponding wild-type sequences varied with the varying input ratios of the sample DNA and competitor amounts: when the input amount of the sample was small, the relative amplified amount of the wild-type sequence was smaller, and the resulting SR for ERBB2, correspondingly, was lower. In order to obtain more stable SRs, the sample DNA concentration was pre-adjusted to 10 ng/ml prior to initiating the mrcPCR assay. In normal-blood DNA samples, the standard deviation (SD) errors in the nRR values (normalized with mean RR values) were 0.076–0.099, as shown in Fig. 2B. Although the mrcPCR assay has its advantage in yielding multiple gene copy information, the SD error value of the mrcPCR was barely better than that from real-time quantitative PCR, which is about 0.21 [30]. However, when the extra-denaturation procedure was introduced for DNA samples along with the competitors, the SD error was markedly reduced, to as small as 0.021–0.040, as shown in Fig. 2B (SD for nRR of 5-ERBB2/ALDOC = 0.040; SD for nRR of 3-5-ERBB2/ALDOC = 0.021; SD for nRR of G6PC3/ALDOC = 0.039). These results suggest that the mrcPCR can determine ERBB2 gene copy status more reliably with the extra-denaturation procedure. We performed the extra-denaturation procedure on a mixture of competitors, genomic DNA, and primers just before the PCR for all of the mrcPCR assays. With the extra-denaturation procedure, five independent experiments using DNAs from normal whole blood or MDA-MB-453 showed consistent results (Fig. 2C).
ERBB2 amplification, as expected, was detected in MDA-MD-453 and JIMT-1 cells, but not in T-47D (Fig. 2D). However, the relative copy numbers of the reference genes (G6PC3 or ALDOC) were not 1.0 in either cell line, probably due to co-amplification in one of the reference gene loci along with the amplification of ERBB2. For example, the MDA-MB-453 cells had a higher copy number for ALDOC than for G6PC3, and the JIMT-1 cells had a higher copy number for G6PC3 than for ALDOC, suggesting that the use of one reference gene close to ERBB2 could under-estimate the ERBB2 copy number. So, in the present study, the reference gene with the lower nRR value, either ALDOC or G6PC3, was used
to evaluate the ERBB2 status, when there is apparent difference in nRR values of reference genes.
In previously reported competitive methods, exact amounts of input competitors and sample DNAs were essential [25,26], and so clinical application was difficult. However, in our present mrcPCR assay, the use of various amounts of genomic DNA (2.5–40 ng) or competitor mixture (6.25–25.0 fg) yielded consistent results (Fig. 2E), indicating that meticulous measurement of the DNA concentration or the addition of exactly the same ratio of sample DNA to competitors is not necessary. Furthermore, the input ratios between competitor and genomic DNA could be monitored by SRs, thus ensuring detection of possible experimental errors.
Cancer tissues usually contain normal cell components, which limits the sensitivity of molecular methods; mrcPCR shares this limitation. However, in an assay using different mixture percent-ages between the reference blood gDNA and JIMT-1 gDNA, the mrcPCR could reliably detect ERBB2 copy gain in samples containing more than 33% ERBB2-amplified gDNA of JIMT-1 (Fig. 2F). Moreover, the relationship between the nRR values by mrcPCR and the relative amounts of JIMT-1 gDNA was linear (Fig. 2F). These results suggest that the mrcPCR can be effectively
used for cancer tissues containing admixed normal cell compo-nents, and that cancer-cell-percentage-based linear correction can be possible.
In a comparison of the mrcPCR results with those by the standard IHC and/or FISH methods, the results were consistent across 46 breast cancer tissues, excepting two cases with low tumor percentages of about 30% (marked in red, Fig. 2G). However, all of the results were consistent when the nRR values were corrected relative to the tumor percentage (Fig. 2G).
As most available clinical samples are formalin-fixed paraffin-embedded (FFPE), not fresh-frozen cancer tissues, the applicability of mrcPCR to FFPE tissues was tested for six sample pairs of both frozen and FFPE tissues. The correlation between the results was significant (P,0.001 and R = 0.980, by Pearson correlation test after logarithmic transformation, Fig. 2H), suggesting the clinical applicability of mrcPCR to FFPE tissues. However, these FFPE samples were freshly prepared from fresh-frozen tissues, and were less than two weeks old at the time of DNA preparation; and in fact, the results for subsequently-tested several-years-old FFPE tissues proved less reliable. Nonetheless, mrcPCR can be Figure 1. Schematic diagram of mrcPCR showing its differences with real competitive PCR. On the left side, the scheme of mrcPCR is shown. On the right side, the differences are summarized. In the result analysis, the relative ratio (RR) of the signal ratios (SRs) of A/A’ and B/B’ [RR = (A/A’)/(B/B’)] was used, representing the relative copy status of target gene A compared with reference gene B. A or B is the genomic peak height from the A or B gene. A’ or B’ is the competitor peak height from the A’ or B’ competitor. In the example, the test sample has two times more of A gene than reference sample, and so the final RR value for the A gene is 2.0, when B and B’ are the same. In most cases, B and B’ are different, so control samples are needed to normalize the ratio of B to B’ and get normalized RR (nRR).
considered to be applicable in routine practice, given that freshly prepared FFPE tissues normally are available.
Thus, we showed that the mrcPCR assay can determine ERBB2 copy status with sufficiently high sensitivity and reproducibility in cancer cells and tissues.
Figure 2. Measurement ofERBB2gene copy number by mrcPCR. (A) Representative results for measurement of ERBB2 copy number by mrcPCR using two ERBB2 sequences (5-ERBB2 and 3-ERBB2) and two reference sequences (ALDOC and G6PC3). Eight peaks originated from either genomic DNA (blue) or the competitor (red). (B) mrcPCR assay variation depending on extra-denaturation procedure. Standard deviation (SD) values for the nRRs are shown. (C) Reproducibility of mrcPCR by five independent assays. (D) ERBB2 copy number by mrcPCR in control and cancer cell samples. The y-axis shows the mean nRR values of 5-ERBB2 and 3-ERBB2. (E) mrcPCR results using various amounts of input genomic DNA (blue, 2.5, 5, 10, 20, or 40 ng) and competitors (red, 6.25, 12.5, or 25 fg based on ALDOC competitor). The y-axis shows the mean nRR values of 5-ERBB2 and ERBB2. (F) Detection of ERBB2 amplification in serially-diluted DNA of JIMT-1 or T47D cells. The y-axis shows the mean nRR values of 5-ERBB2 and 3-ERBB2. The assay was performed in duplicate. (G) Comparison of mrcPCR results with those from standard methods of immunohistochemistry (IHC) and fluorescence in situ hybridization (FISH). Y axis: corrected nRR for ERBB2 copy based on cancer cell percentage as described in Materials and Methods. The red spots are the samples that contained only about 30% tumor cells. (H) Comparison of mrcPCR results between fresh-frozen (black) and formalin-fixed paraffin-embedded (FFPE, gray) cancer tissues (P,0.001, R = 0.980, by Pearson correlation test after logarithmic transformation). The assay was performed in triplicate.
Measurement of 24 drug-target gene copies in panel of NCI-60 cells by mrcPCR
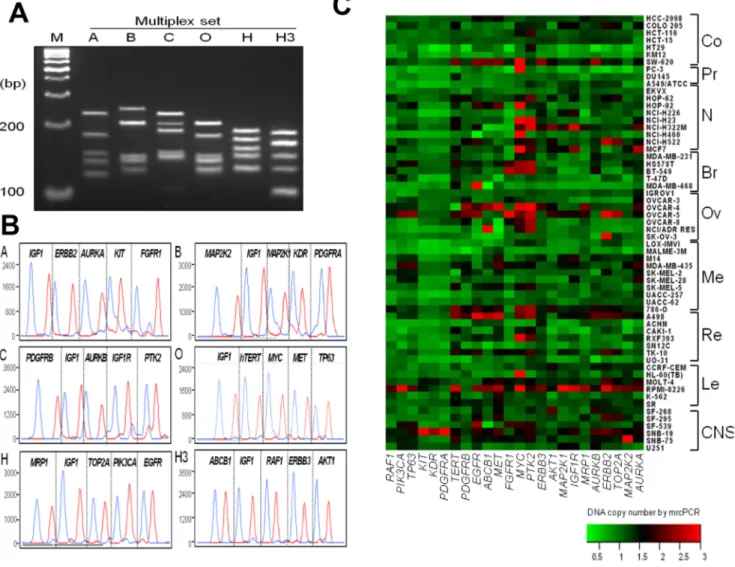
In clinical application of CNAs as prognostic and/or predictive markers for cancer patients, the copy status of dozens of genes may be used simultaneously, as there are many targeted inhibitors available even for a single cancer type. To accommodate such needs, mrcPCR method was developed for 24 drug-target genes (Table S1) selected based on the availability of specific targeted inhibitors [31]. The method consisted of six multiplex PCRs and six single-base-extension reactions. The representative assay results for a control blood DNA sample are shown in Figures 3A and 3B, and the copy numbers for the NCI-60 cell lines as determined by mrcPCR are mapped in Figure 3C.
To confirm the reliability of the copy status determination for the 24 genes, these mrcPCR results were compared with those by microarray or real-time quantitative PCR. In an analysis utilizing COLO205 and OVAR-4 cells, the correlation was significant (P,0.001 for both cells; R = 0.903 for COLO205 and R = 0.873 for OVCAR-4, by Pearson correlation test after natural
logarith-mic transformation of nRR values; Figs. 4A and 4B). In comparison with a real-time quantitative PCR on two genes, PTK2 and MYC, the copy numbers of which were changed most frequently in the NCI-60 cells, the results were highly consistent (P,0.001 for both genes; R = 0.851 for PTK2 and R = 0.952 for MYC, by Pearson correlation test after logarithmic transformation of nRR values; Figs. 4C and 4D). To demonstrate reliable detection of copy loss, the comparison of FGFR1 results between mrcPCR and real-time PCR was tested as well (Fig. S1). These data indicate the reliability of the mrcPCR results for the 24 genes. Although the mrcPCR could determine the copy status effectively in most of the NCI-60 cells, the copy numbers in the RPMI-8226 leukemia cells were relatively high for most of the 24 genes tested (median nRR of 24 genes = ,2.2). The reason might be the copy loss of reference gene IGF1, but we did not investigate further. This possibility indicates that application of the mrcPCR method requires the simultaneous use of several reference genes. However, employing several reference genes for each assay could reduce the versatility of mrcPCR, because less than six genes
Figure 3. Measurements of copy numbers for 24 drug-target genes by mrcPCR in NCI-60 cells. (A) PCR amplification products from each of six multiplex PCR (A, B, C, O, H, and H3) separated by 5% NuSieveH agarose gel electrophoresis. (B) Representative peaks from analysis of products of six single-base-extension reactions (A, B, C, O, H, and H3) in a control whole-blood DNA sample. Five peak pairs are shown for four target genes and one reference gene in each reaction. Each pair of peaks is from either genomic DNA (blue) or the competitor (red). (C) Heatmap of copy numbers for 24 genes in NCI-60 cells. Each copy number was measured three times and the mean values were used. Co, colon; Pr, prostate; N, NSCLC; Br, breast; Ov, ovarian; Me, melanoma; Re, renal; Le, leukemia.
seems to be the optimal number in a single mrcPCR assay for accurate determination of gene copy numbers. Alternatively, therefore, we herein propose the use of a separate panel consisting of several reliable reference genes for determination of baseline copy status: genes showing in certain types of cancer relatively stable copy numbers as deduced from microarray experiments or multi-copy repetitive sequences (as utilized in human multicopy reference PCR assays from Qiagen) can be employed as mrcPCR reference genes.
Measurement of FCGR3A and FCGR3B copy numbers by mrcPCR
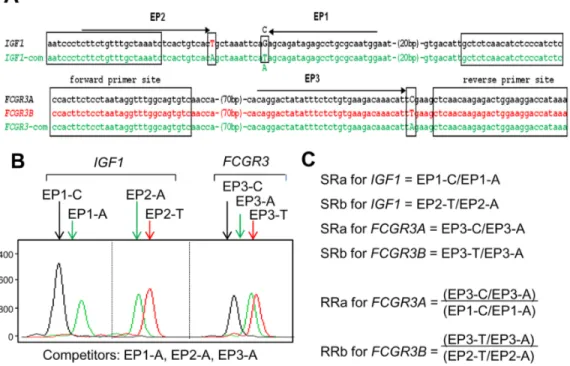
It has been reported that CNVs are associated with disease susceptibility [32], but their validation for each gene or locus has proved challenging. This has been even more difficult for genes having one or several variants with quite similar sequences. Copy status determination for FCGR3A and FCGR3B is an example. A lower copy number for FCGR3B but not FCGR3A has been reported to be associated with a higher risk of systemic lupus erythematosus (SLE) [2,3]. The PRT method recently has been reported to be useful for copy-number determination of FCGR3A and FCGR3B with the availability of the dispersed repeat sequence similar to the target gene [23]. However, in addition to PRT, another independent methodology, REDVR, is necessary for determination of the copy-number information of those gene variants. In the present study, instead of two independent methodologies, a single mrcPCR assay was employed. For this, two different bases were changed in the reference gene IGF1 competitor, as shown in Fig. 5A. The representative result was shown in Fig. 5B, and the SR and RR calculation formulae in Fig. 5C.
In comparing the mrcPCR with PRT using fifty two blood genomic DNA samples, we expected that the sum of the nRR values of FCGR3A and FCGR3B by mrcPCR (nRRa+b) would show a tight linear correlation with the PRT ratio (the peak area ratio between FCGR3 and the reference sequence on chromosome 18 by PRT). However, the correlation between the PRT ratio and the nRRa+b was not excellent (R = 0.789 after logarithmic transformation; Fig. 6A), though the nRRa+b values from two independent mrcPCR assays were highly correlated (R = 0.923). This relatively lower correlation might hamper accurate estima-tion of FCGR3A and FCGR3B copies and lead, thereby, to erroneous conclusions.
In the mrcPCR assays, the extra-denaturation procedure for the competitor, primers, and genomic DNA was routinely employed to solve the plasmid structural problem and to decrease the assay variation. It may have such effects also in the PRT assay. Even though most three-dimensional DNA structures related to histones would be resolved during DNA purification procedures, supra-molecular assembly of the DNA structure resulting from various noncovalent interactions such as hydrogen bonding, electrostatics, and p2p stacking [33] could affect the final PRT results. To test for this possibility, we added an extra-denaturation procedure to the PRT assay (denaturing PRT), as in our mrcPCR assay. Surprisingly, with this extra procedure, the correlation between the PRT ratio and nRRa+b was remarkably improved, as shown in Fig. 6B (R = 0.909 after logarithmic transformation), indicating the importance of the extra-denaturation procedure. This raises the issue of complete denaturation prior to PCR for copy-number quantification to resolve remaining genomic DNA structures which could affect the final result of gene copy. In our experience, freshly prepared DNA or freshly diluted DNA, but not that which Figure 4. Validation of mrcPCR assay with microarray or real-time PCR. Comparison of results between mrcPCR and microarray in COLO205 (A), and OVCAR-4 (B) cells. Comparison of results between mrcPCR and real-time PCR for PTK2 (C) and MYC (D). The Pearson correlation coefficients (R) and P values after logarithmic transformation are shown.
had undergone several freeze and thaw cycles, seems to be more prone to such variation with respect to the extra-denaturation procedure.
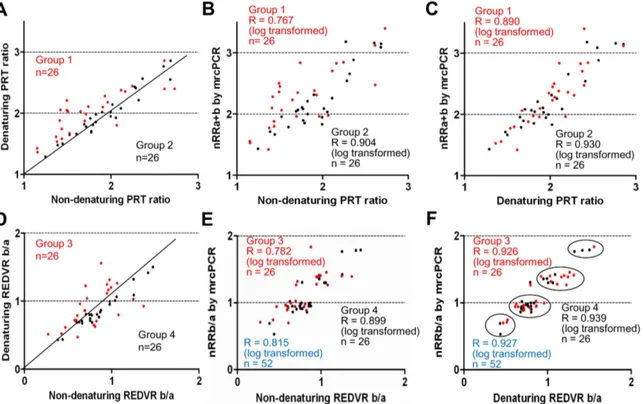
For further analysis of the correlation between the PRT and mrcPCR results according to the extra-denaturation procedure, the samples were re-grouped on the basis of the level of variation in the PRT ratios according to the extra-denaturation procedure (the non-denaturing PRT ratio, the PRT ratio by PRT assay
without extra-denaturation; the denaturing PRT ratio, the PRT ratio by PRT assay with extra-denaturation): Group 1 is the cases showing higher variation in the PRT ratios between two assays (,0.9 or .1.1; n = 26; red dots in Figs. 7A–7C), and group 2 is the cases showing lower variation (0.919–1.081; n = 26; black dots in Figs. 7A–7C). The correlation between the non-denaturing PRT ratio and nRRa+b was lower in group 1 (R = 0.767 with logarithmic transformation, red dots in Fig. 7B), than in group 2 Figure 5. mrcPCR assay for determination ofFCGR3AandFCGR3Bcopies. (A) Alignment of wild-type and competitor sequences for IGF1 and FCGR3 used in mrcPCR assay. The nucleotides corresponding to modified bases are indicated in upper-case letters. The forward and reverse PCR primer sites are marked in brackets. EP1, EP2, and EP3 represent the extension primer sites, with the direction of the extension indicated by arrows. (B) Electrophoregram of extended products in mrcPCR assay. Extended nucleotides are indicated after the extension primers. Four peaks originated from genomic IGF1 (EP1-C and EP2-T) and competitor IGF1 (EP1-A and EP2-A), and the other three peaks originated from genomic FCGR3A (EP3-C), genomic FCGR3B (EP3-T), and competitor FCGR3 (EP3-A). (C) Formula for the signal ratios (SRs) and the relative ratios (RRs) from peak heights of electrophoregram.
doi:10.1371/journal.pone.0069414.g005
Figure 6. Correlation between the PRT ratio and the nRRa+b according to extra-denaturation procedure. (A) The correlation between the PRT ratio by non-denaturing PRT (PRT without extra-denaturation) and the nRRa+b by mrcPCR (R = 0.789, n = 52). (B) The correlation between the PRT ratio by denaturing PRT (PRT with extra-denaturation) and the nRRa+b by mrcPCR (R = 0.909, n = 52). The PRT ratio is the peak area ratio of FCGR3 to the reference sequence on chromosome 18 by PRT (x-axis). The nRRa+b is the sum of the nRR values of FCGR3A and FCGR3B by mrcPCR (y-axis). doi:10.1371/journal.pone.0069414.g006
(R = 0.904 with logarithmic transformation, black dots in Fig. 7B), indicating that the non-denaturing PRT ratio in the cases showing higher variation with the denaturing PRT ratio, also showed higher variation with the mrcPCR result. However, the denaturing PRT ratio in both groups showed similar close correlations with the nRRa+b (R = 0.890 for group 1, red in Fig. 7C; R = 0.930 for group 2 with logarithmic transformation, black in Fig. 7C). These results suggest that the major difference between the non-denaturing PRT and mrcPCR originates in samples showing higher variations according to the extra-denaturation procedure.
In the paper on the development of PRT methodology for FCGR3A and FCGR3B [23], two PRT assays using two different dyes with the same primer sequences were recommended for each sample, due to the PRT ratio variations in some samples; however, the cause of such variations was not clearly explained. Our data suggest that these can be reduced by the extra-denaturation procedure. The importance of pre-PCR genomic DNA denatur-ation for molecular copy estimdenatur-ation has not been well recognized. However, our data suggest that the extra-denaturation procedure prior to PCR amplification might be necessary to reduce the assay variation for gene copy determination.
The REDVR b/a (the peak area ratios between 185bp FCGR3B and 136bp FCGR3A) were compared with the nRRb/a (the ratio of FCGR3B and FCGR3A nRR values by mrcPCR, Figs. 7D–7F). Similarly to the PRT assay, the denaturing REDVR b/a (the REDVR b/a by REDVR assay with extra-denaturation
proce-dure) showed higher correlation with the nRRb/a (R = 0.927 after logarithmic transformation, Fig. 7F) than the non-denaturing REDVR b/a (the REDVR b/a by REDVR assay without extra-denaturation; R = 0.815 after logarithmic transformation, Fig. 7E). For further analysis, the samples were re-grouped according to the level of variation in the REDVR b/a according to the extra-denaturation procedure, as shown in Fig. 7D. Group 3 is the samples showing higher variation (,0.85, or .1.15; red dots in Figs. 7D–7F), and group 4 is those showing lower variation (0.85– 1.15; black dots in Figs. 7D–7F). The correlation of the non-denaturing REDVR b/a with the nRRb/a was lower in group 3 (R = 0. 782 with logarithmic transformation; red dots in Fig. 7E), than that in group 4 (R = 0.899 with logarithmic transformation; black dots in Fig. 7E). By contrast, the denaturing REDVR b/a in both groups showed similar correlations with the nRRb/a (R = 0.926 for group 3; R = 0.939 for group 4) as shown in Fig. 7F. These results suggest that the main difference between the non-denaturing REDVR and the mrcPCR results was the samples showing higher-variation in the REDVR b/a according to the extra-denaturation procedure.
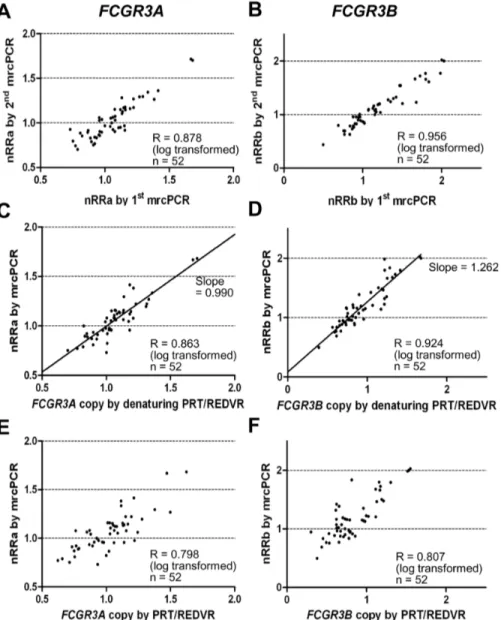
The FCGR3A and FCGR3B copies by two independent mrcPCR assays showed high correlations (R = 0.878 for FCGR3A with log transformation, Fig. 8A; R = 0.956 for FCGR3B with log transformation, Fig. 8B), suggesting the reproducibility of mrcPCR assay. In addition, the FCGR3A and FCGR3B copies by mrcPCR showed high correlations with those by the combined PRT/
Figure 7. PRT ratios and REDVR b/a according to extra-denaturation procedure. (A) Two groups showing higher (group 1, red) or lower (group 2, black) variation in the PRT ratios according to the extra-denaturation procedure for PRT assays. (B) The correlations of the non-denaturing PRT ratio with the nRRa+b in groups 1 (red) and 2 (black). (C) The correlations of the denaturing PRT ratio with the nRRb/a in groups 1 (red) and 2 (black). (D) Two groups showing higher (group 3, red) and lower (group 4, black) variation in the REDVR b/a according to the extra-denaturation procedure. (E) The correlation of the non-denaturing REDVR b/a with the nRRb/a in groups 3 (red) and 4 (black). The correlation in the total group 3 and 4 cases is shown in blue. (F) The correlation of the denaturing REDVR b/a with the nRRb/a in groups 3 (red) and 4 (black). The correlation in the total group 3 and 4 cases was shown in blue. All correlation-coefficient R values were obtained by Pearson correlation test after logarithmic transformation. PRT ratio, REDVR b/a, nRRa+b, and nRRb/a are defined in Materials and Methods. The non-denaturing PRT ratio and non-denaturing REDVR b/a are the values obtained without the extra-denaturation procedure: the denaturing PRT ratio and denaturing REDVR b/a, with the extra procedure.
REDVR methods with the extra-denaturation procedure (R = 0.863 for FCGR3A with log transformation, Fig. 8C; R = 0.924 for FCGR3B with log transformation, Fig. 8D). By contrast, when the copies by mrcPCR were compared with those by the combined PRT/REDVR methods without the extra-denaturation procedure, the correlation was much lower (R = 0.798 for FCGR3A with log transformation, Fig. 8E; R = 0.807 for FCGR3B with log transformation, Fig. 8F). These data suggest again the importance of the extra-denaturation procedure.
In comparison of the FCGR3A and FCGR3B copies by mrcPCR with those by PRT/REDVR, the FCGR3A copy numbers were similar as in Fig. 8C, and the slope of the correlation for FCGR3A was near 1.0 (slope = 0.990 with 95% confidence interval of 0.966–1.015). However, the FCGR3B copies were different between the mrcPCR and the combined PRT/REDVR methods
as in Fig. 8D, and the slope of the correlation for FCGR3B was not near 1.0 (slope = 1.262 with 95% CI of 1.220–1.305). Even with a high correlation between different methodologies, raw data may not be interchangeable before the normalization with standard samples. In the mrcPCR, FCGR3A and FCGR3B copies have already been corrected by the median values of tested samples as described in Materials and Methods. However, the copy results by PRT/REDVR were not corrected. So, the median value of FCGR3B copies by PRT/REDVR from samples was used for the correction as for the copies by mrcPCR. With the corrected FCGR3B copy values, the slope of the correlation between the mrcPCR and the combined PRT/REDVR results became 1.011 (95% CI, 0.977–1.045), suggesting that the corrected FCGR3B copies using median value could now be interchangeable with those by mrcPCR.
Figure 8. Comparison ofFCGR3AorFCGR3Bcopies by mrcPCR with those by combined PRT/REDVR methods. The correlation of FCGR3A (A) or FCGR3B (B) copies by two independent mrcPCR assays. The correlation of FCGR3A (C) or FCGR3B (D) copies by mrcPCR with those by the combination of denaturing PRT and denaturing REDVR (denaturing PRT/REDVR) methods. The correlation of FCGR3A (E) or FCGR3B (F) by non-denaturing PRT/REDVR (PRT/REDVR) with those by mrcPCR. All correlation-coefficient R values were obtained by Pearson correlation test after logarithmic transformation. nRRa is the nRR value for FCGR3A by mrcPCR; nRRb, for FCGR3B. FCGR3A and FCGR3B copies by PRT/REDVR in the figures are the copies not normalized by median values.
With the extra-denaturation procedure, the PRT ratio showed a high correlation with the nRRa+b (R = 0.904, Fig. 6B). The REDVR b/a also showed a high correlation with the nRRb/a (R = 0.927, Fig. 7E). In addition, the comparison of FCGR3A and FCGR3B copies by mrcPCR with those by calculated from the combined PRT/REDVR methods showed high correlation (R = 0.863 and 0.924 for FCGR3A and FCGR3B with log transformation, Figs. 8C–8D). Moreover, the corrected copies for FCGR3A and FCGR3B were highly consistent between mrcPCR and PRT/REDVR methodologies. These results indi-cate that mrcPCR results are highly consistent with those from PRT and/or REDVR method. The correlation between the REDVR and mrcPCR results was especially remarkable in that four distinctly separate groups were apparent (marked in circles in Fig. 7F), supporting again that the mrcPCR results are highly consistent with those by PRT/REDVR with the extra-denatur-ation procedure.
For deduction of the absolute FCGR3A and FCGR3B copies, we employed the median nRR values from our study population, because the reference genomic DNA samples with known copies were not available. When the copy number of the reference gene is known in study population samples, however, cloned plasmids of target and reference genes can be employed in mrcPCR to estimate the absolute copy numbers. As substituted for genomic DNA, the target and reference plasmids admixed in various ratios were competitively co-amplified with competitors, and the resulting RR values were plotted against the relative ratios between the input amounts of the target and reference plasmids (Figs. S2A and S2B). The RR value for the input ratio of 1.0 between the target and reference plasmids could be the nRR value for two copies of target gene when there are two copies of reference gene per cell. The deduced RR values for two copies of FCGR3A and FCGR3B were 0.49 and 0.92, quite similar to median nRR values, 0.48 and 0.87, from our study population. The absolute copy values from the plasmid mixtures were also quite similar to those deduced from our study population. These results suggest that in determinations of the absolute copy numbers of the target genes in test samples, employment of target and reference plasmids can be an effective alternative, when reference samples with known copies are unavailable.
In the present study, we showed that copy numbers measured by mrcPCR are highly consistent with the standard or the most sensitive method currently available. In addition, mrcPCR requires as little as 10 ng DNA and about three hours of assay time, so it could be competitive with other currently available molecular methods for measuring copy numbers, including multiplex-ligation-dependent probe amplification (MLPA) [34], multiplex amplification and probe hybridization (MAPH) [35], and quantitative multiplex PCR of short fluorescent fragment (QMPSF) [36]. Furthermore, mrcPCR promises to be an invaluable method for measurement of copy-number variation in genes with variants of similar structures, including FCGR3 [23], CCL3L1 [5], and C4 [37], owing to the facts that, unlike the PRT method, extra-methodology such as REDVR is not necessary [7,23], and that more versatile application to many genes without dispersed repeat sequences similar to the target gene is possible.
The mrcPCR method also has limitations. It takes an additional approximately two weeks for cloning of competitors, and requires extra-analysis procedures after PCR. Also, different competitor preparations, and different batches of PCR primers or extension primers, might yield inter-assay variations. And as these factors also can interfere with raw-data exchange among independent laboratories, we would recommend using nRR instead of RR for that purpose. For every new batch of primers or competitors, the
use of new standard RR values from control samples would be advisable so as to remove any possible assay variation. Addition-ally, the results of commercially available reference genomic DNA samples can help independent researchers to exchange raw data based on nRR values from those reference samples, and so we included the data on commercially available samples that were used for determination of C4 copies [37], as shown in Table S7, with SR, RR, and nRR values derived from the signal peaks of FCGR3A, FCGR3B and IGF1. We hope that this effort will facilitate the reproduction of our results and method in independent laboratories, to the greater end that is the development of new, simpler, more reproducible assays.
In the present study, we introduced a modified real competitive PCR (mrcPCR) method employing cloned competitors and automatic sequencer to measure copy-number variations (CNVs) and alterations (CNAs). By comparison of the mrcPCR results with currently available standard or sensitive methods, we demonstrated its consistency, reliability, and versatility with as little as 10 ng genomic DNA and less than three hours of assay time. We firmly believe that this mrcPCR method has great potential as a means of validating candidate CNVs in large case-control association studies and applying clinically relevant CNAs to the treatment of cancer patients.
Supporting Information
Figure S1 Comparison of FGFR1 copy status between mrcPCR and real-time PCR.
(DOCX)
Figure S2 Determination of absolute copy numbers of FCGR3A and FCGR3B with cloned target and reference genes.
(DOCX)
Table S1 24 drug-target genes for determination of copy number by mrcPCR.
(DOCX)
Table S2 Oligonucleotide primers for determination of ERBB2 copy-number status.
(DOCX)
Table S3 Oligonucleotide primers for determination of copy-number status of 24 different genes by mrcPCR. (DOCX)
Table S4 Oligonucleotide primers for FCGR3A and FCGR3B by mrcPCR.
(DOCX)
Table S5 Oligonucleotide primers for quantitative real-time PCR.
(DOCX)
Table S6 Oligonucleotide primers for PRT and REDVR. (DOCX)
Table S7 Results of reference DNA samples by mrcPCR (IHWG consanguineous panel).
(DOCX)
Methods S1 Detailed mrcPCR procedure. (DOCX)
Author Contributions
Conceived and designed the experiments: KMH YNK. Performed the experiments: HKK HLH SYP JYS. Analyzed the data: HKK KMH.
Contributed reagents/materials/analysis tools: KML WCP SYK HSK THU YJH JKL SYJ YWS. Wrote the paper: HKK YNK KMH. References
1. Redon R, Ishikawa S, Fitch KR, Feuk L, Perry GH, et al. (2006) Global variation in copy number in the human genome. Nature 444: 444–454. 2. Aitman TJ, Dong R, Vyse TJ, Norsworthy PJ, Johnson MD, et al. (2006) Copy
number polymorphism in Fcgr3 predisposes to glomerulonephritis in rats and humans. Nature 439: 851–855.
3. Fanciulli M, Norsworthy PJ, Petretto E, Dong R, Harper L, et al. (2007) FCGR3B copy number variation is associated with susceptibility to systemic, but not organ-specific, autoimmunity. Nat Genet 39: 721–723.
4. Yang Y, Chung EK, Wu YL, Savelli SL, Nagaraja HN, et al. (2007) Gene copy-number variation and associated polymorphisms of complement component C4 in human systemic lupus erythematosus (SLE): low copy number is a risk factor for and high copy number is a protective factor against SLE susceptibility in European Americans. Am J Hum Genet 80: 1037–1054.
5. Mamtani M, Rovin B, Brey R, Camargo JF, Kulkarni H, et al. (2008) CCL3L1 gene-containing segmental duplications and polymorphisms in CCR5 affect risk of systemic lupus erythaematosus. Ann Rheum Dis 67: 1076–1083. 6. Fellermann K, Stange DE, Schaeffeler E, Schmalzl H, Wehkamp J, et al. (2006)
A chromosome 8 gene-cluster polymorphism with low human beta-defensin 2 gene copy number predisposes to Crohn disease of the colon. Am J Hum Genet 79: 439–448.
7. Hollox EJ, Huffmeier U, Zeeuwen PL, Palla R, Lascorz J, et al. (2008) Psoriasis is associated with increased beta-defensin genomic copy number. Nat Genet 40: 23–25.
8. Gonzalez E, Kulkarni H, Bolivar H, Mangano A, Sanchez R, et al. (2005) The influence of CCL3L1 gene-containing segmental duplications on HIV-1/AIDS susceptibility. Science 307: 1434–1440.
9. Colin Y, Cherif-Zahar B, Le Van Kim C, Raynal V, Van Huffel V, et al. (1991) Genetic basis of the RhD-positive and RhD-negative blood group polymorphism as determined by Southern analysis. Blood 78: 2747–2752.
10. Higgs DR, Old JM, Pressley L, Clegg JB, Weatherall DJ (1980) A novel alpha-globin gene arrangement in man. Nature 284: 632–635.
11. Beroukhim R, Mermel CH, Porter D, Wei G, Raychaudhuri S, et al. (2010) The landscape of somatic copy-number alteration across human cancers. Nature 463: 899–905.
12. Pegram MD, Lipton A, Hayes DF, Weber BL, Baselga JM, et al. (1998) Phase II study of receptor-enhanced chemosensitivity using recombinant humanized anti-p185HER2/neu monoclonal antibody plus cisplatin in patients with HER2/ neu-overexpressing metastatic breast cancer refractory to chemotherapy treatment. J Clin Oncol 16: 2659–2671.
13. Bang YJ, Van Cutsem E, Feyereislova A, Chung HC, Shen L, et al. (2010) Trastuzumab in combination with chemotherapy versus chemotherapy alone for treatment of HER2-positive advanced gastric or gastro-oesophageal junction cancer (ToGA): a phase 3, open-label, randomised controlled trial. Lancet 376: 687–697.
14. Cunningham D, Humblet Y, Siena S, Khayat D, Bleiberg H, et al. (2004) Cetuximab monotherapy and cetuximab plus irinotecan in irinotecan-refractory metastatic colorectal cancer. N Engl J Med 351: 337–345.
15. Sartore-Bianchi A, Moroni M, Veronese S, Carnaghi C, Bajetta E, et al. (2007) Epidermal growth factor receptor gene copy number and clinical outcome of metastatic colorectal cancer treated with panitumumab. J Clin Oncol 25: 3238– 3245.
16. Smolen GA, Sordella R, Muir B, Mohapatra G, Barmettler A, et al. (2006) Amplification of MET may identify a subset of cancers with extreme sensitivity to the selective tyrosine kinase inhibitor PHA-665752. Proc Natl Acad Sci U S A 103: 2316–2321.
17. Tanizaki J, Okamoto I, Okamoto K, Takezawa K, Kuwata K, et al. (2010) MET tyrosine kinase inhibitor crizotinib (PF-02341066) shows differential antitumor effects in non-small cell lung cancer according to MET alterations. J Thorac Oncol 6: 1624–1631.
18. Nakamura K, Yashiro M, Matsuoka T, Tendo M, Shimizu T, et al. (2006) A novel molecular targeting compound as K-samII/FGF-R2 phosphorylation inhibitor, Ki23057, for Scirrhous gastric cancer. Gastroenterology 131: 1530– 1541.
19. Curtis C, Shah SP, Chin SF, Turashvili G, Rueda OM, et al. (2012)The genomic and transcriptomic architecture of 2,000 breast tumours reveals novel subgroups. Nature 486: 346–352.
20. The Cancer Genome Atlas Network (2012) Comprehensive molecular portraits of human breast tumours. Nature 490: 61–70.
21. Casilli F, Di Rocco ZC, Gad S, Tournier I, Stoppa-Lyonnet D, et al. (2002) Rapid detection of novel BRCA1 rearrangements in high-risk breast-ovarian cancer families using multiplex PCR of short fluorescent fragments. Hum Mutat 20: 218–226.
22. Charbonnier F, Raux G, Wang Q, Drouot N, Cordier F, et al. (2000) Detection of exon deletions and duplications of the mismatch repair genes in hereditary nonpolyposis colorectal cancer families using multiplex polymerase chain reaction of short fluorescent fragments. Cancer Res 60: 2760–2763. 23. Hollox EJ, Detering JC, Dehnugara T (2009) An integrated approach for
measuring copy number variation at the FCGR3 (CD16) locus. Hum Mutat 30: 477–484.
24. Armour JA, Palla R, Zeeuwen PL, den Heijer M, Schalkwijk J, et al. (2007) Accurate, high-throughput typing of copy number variation using paralogue ratios from dispersed repeats. Nucleic Acids Res 35: e19.
25. Sestini R, Orlando C, Zentilin L, Gelmini S, Pinzani P, et al. (1994) Measuring c-erbB-2 oncogene amplification in fresh and paraffin-embedded tumors by competitive polymerase chain reaction. Clin Chem 40: 630–636.
26. Okuyama N, Hatano Y, Park Y, Shimatani S, Sasamoto S, et al. (1999) Quantitation of c-erbB-2 gene amplification in breast cancer tissue by competitive PCR. Tumour Biol 20: 153–161.
27. Ding C, Cantor CR (2003) A high-throughput gene expression analysis technique using competitive PCR and matrix-assisted laser desorption ionization time-of-flight MS. Proc Natl Acad Sci U S A 100: 3059–3064.
28. Wolff AC, Hammond ME, Schwartz JN, Hagerty KL, Allred DC, et al. (2007) American Society of Clinical Oncology/College of American Pathologists guideline recommendations for human epidermal growth factor receptor 2 testing in breast cancer. J Clin Oncol 25: 118–145.
29. Pfaffl MW (2001) A new mathematical model for relative quantification in real-time RT-PCR. Nucleic Acids Res 29: e45.
30. Bieche I, Olivi M, Champeme MH, Vidaud D, Lidereau R, et al. (1998) Novel approach to quantitative polymerase chain reaction using real-time detection: application to the detection of gene amplification in breast cancer. Int J Cancer 78: 661–666.
31. Killian A, Di Fiore F, Le Pessot F, Blanchard F, Lamy A, et al. (2007) A simple method for the routine detection of somatic quantitative genetic alterations in colorectal cancer. Gastroenterology 132: 645–653.
32. Beckmann JS, Estivill X, Antonarakis SE (2007) Copy number variants and genetic traits: closer to the resolution of phenotypic to genotypic variability. Nat Rev Genet 8: 639–646.
33. Hemp ST, Long TE (2012) DNA-inspired hierarchical polymer design: electrostatics and hydrogen bonding in concert. Macromol Biosci 12: 29–39. 34. Schouten JP, McElgunn CJ, Waaijer R, Zwijnenburg D, Diepvens F, et al.
(2002) Relative quantification of 40 nucleic acid sequences by multiplex ligation-dependent probe amplification. Nucleic Acids Res 30: e57.
35. Armour JA, Sismani C, Patsalis PC, Cross G (2000) Measurement of locus copy number by hybridisation with amplifiable probes. Nucleic Acids Res 28: 605– 609.
36. Saugier-Veber P, Goldenberg A, Drouin-Garraud V, de La Rochebrochard C, Layet V, et al. (2006) Simple detection of genomic microdeletions and microduplications using QMPSF in patients with idiopathic mental retardation. Eur J Hum Genet 14: 1009–1017.
37. Wu YL, Savelli SL, Yang Y, Zhou B, Rovin BH, et al. (2007) Sensitive and specific real-time polymerase chain reaction assays to accurately determine copy number variations (CNVs) of human complement C4A, C4B, long, C4-short, and RCCX modules: elucidation of C4 CNVs in 50 consanguineous subjects with defined HLA genotypes. J Immunol 179: 3012–3025.