The black-spotted pond frog (Pelophylax nigromacu-latus) is widely distributed in East Asia (Korea, China, Ja-pan, and Russia). It is a common species that is relatively easily observed in various freshwater habitats (e.g., ponds around rivers, lakes, swamps, rice paddies, and so on) in South Korea. Owing to several characteristics such as strong philopatry to breeding sites and habitats, low mobility,
Received March 25, 2021; Revised April 6, 2021;
Accepted April 7, 2021
*Corresponding author: Yuno Do
e-mail [email protected]
https://orcid.org/0000-0001-8235-1645
1Department of Biological Science, Kongju National University, Gongju, Korea
2National Institute of Ecology, Research Center for Endangered Species, Yeongyang, Korea
Genetic Diversity and Population Genetic
Structure of Black-spotted Pond Frog
(
Pelophylax nigromaculatus) Distributed in
South Korean River Basins
Jun-Kyu Park1 , Nakyung Yoo2 , Yuno Do1 * ABSTRACT Introduction
The objective of this study was to analyze the genotype of black-spotted pond frog (Pelophylax nigromaculatus) using seven micro-satellite loci to quantify its genetic diversity and population structure throughout the spatial scale of basins of Han, Geum, Yeong-san, and Nakdong Rivers in South Korea. Genetic diversities in these four areas were compared using diversity index and inbreeding coefficient obtained from the number and frequency of alleles as well as heterozygosity. Additionally, the population structure was confirmed with population differentiation, Nei’s genetic distance, multivariate analysis, and Bayesian clustering analysis. Interestingly, a negative genetic diversity pattern was observed in the Han River basin, indicating possible recent habitat disturbances or population declines. In contrast, a positive genetic diversity pattern was found for the population in the Nakdong River basin that had remained the most stable. Results of population structure suggested that populations of black-spotted pond frogs distributed in these four river basins were genetically independent. In particular, the population of the Nakdong River basin had the greatest genetic distance, indicating that it might have originated from an independent population. These results support the use of genetics in addition to designations strictly based on geographic stream areas to define the spatial scale of populations for management and conservation practices.
Keywords: Bayesian clustering analysis, Genetic diversity, Inbreeding probability, Microsatellite, Multivariate clustering analysis, Pop-ulation differentiation
relatively easy sampling, and interbreeding in the labora-tory, the black-spotted pond frog is a suitable model for studying patterns of population genetic structure (Bee-bee, 1996; 2005; Gong et al., 2013). In previous study, black-spotted pond frog was used to understand variation patterns of genetic diversity and/or population structure of amphibians according to life history traits of species, the landscape of freshwater habitats, and the isolation on a time scale (Garcia et al., 2017; Ma et al., 2015; Wang et al., 2014). Likewise, frogs can be used to study genetic variation patterns of amphibians distributed in South Ko-rea.
In recent years, with the development of genetic anal-ysis techniques, statistical processing methods, and com-puter information processing capabilities, access to popu-lation genetics analysis has become easier (Sunnucks, 2000).
PNIE 2021;2(2):120-128 https://doi.org/10.22920/PNIE.2021.2.2.120 pISSN 2765-2203, eISSN 2765-2211
For this reason, various molecular markers such as partial sequences of mitochondrial or chloroplast DNA, random amplified polymorphic DNA (RAPD), amplified fragment length polymorphic DNA (AFLP), and microsatellite mark-ers have been used to determine the structure and genetic diversity of a population (Sunnucks, 2000). Among them, the microsatellite technique can quantify genotypes by identifying high levels of length polymorphisms in a serial repetition section of the nucleotide sequence (Zane et al., 2002). With this method, it is possible to obtain infor-mation on demographic trends through gene genealogies representing current and historical processes (Sunnucks, 2000). The identified genotype can be used to determine genetic diversity, population structure, origin of the pop-ulation, and/or migration rate (Garris et al., 2005; Hat-maker et al., 2018; Luikart & England, 1999; Waraniak et al., 2019), which can be used to quantify the range of the population and to identify environmental factors that influence compositions of genes in the population. This study was conducted to identify differences of genetic composition in the black-spotted pond frog in river basins of South Korea using the microsatellite tech-nique. In freshwater ecosystems, rivers serve as corridors to connect groups of organisms in different habitats. They also act as barriers to separate groups depending on their types, sizes, and surrounding habitats (Finn et al., 2006;
2016; Lam et al., 2018; Mullen et al., 2010). The larg-est river basins in South Korea include Han River, Geum River, Yeongsan River, and Nakdong River basins due to various mountain ranges and catchment areas of rivers. The gene flow and/or population genetic structure of the black-spotted pond frog, which is a semi-aquatic frog, can be affected by the distribution of water resources. Therefore, we analyzed differences in genetic diversity and the population genetic structure of black-spotted pond frogs in four river basins.
Materials and Methods
Field investigation
A total of 95 black-spotted pond frogs were collected from paddy fields at three sites of the Han River basin (Yeoju-si, 27 individuals), three sites of the Geum River basin (Gongju-si, 23 individuals), three sites of the Yeo-ngsan River basin (Naju-si, 20 individuals), and three sites of the Nakdong River basin (Chilgok-gun, 25 individuals) in September and October 2020 during the non-breeding season (Fig. 1). Frogs ranged from 1-year-old individuals that had not yet reached sexual maturity to individuals that were fully sexual mature. These collected individuals were euthanized by pithing and stored in 70% ethanol for later analysis.
Fig. 1. Sampling sites for black-spotted pond frogs (P. nigromaculatus) in four river basins of South Korea: (A) Han River, (B) Geum River, (C) Youngsan River, and (D) Nakdong River. Frogs were collected from three sites in each basin.
DNA extraction and genotype analysis
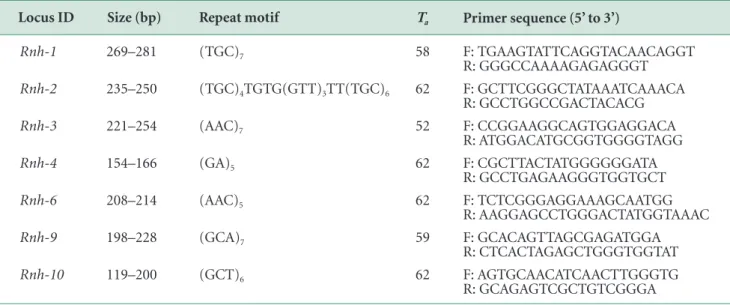
Muscle samples were collected from femurs of 95 black-spotted pond frogs and homogenized using liquid nitrogen. Genomic DNA was extracted using a DNeasy Blood & Tissue kit (Qiagen, Hilden, Germany). The con-centration and quality of genomic DNA were measured with a NanoDrop 2000 (Thermo Fisher Scientific, Wilm-ington, DE, USA). Using a total of seven primers (Rnh-1, Rnh-2, Rnh-3, Rnh-4, Rnh-6, Rnh-10, Rnh-12), the locus of each microsatellite was amplified according to previ-ously reported procedures (Gong et al., 2013) (Table 1). A Seq-Studio Genetic Analyzer (Thermo Fisher-Applied Bio-systems, Foster City, CA, USA) was used to visualize amplified
Fig. 2. Number of multi-locus genotypes by number of loci from 95 individuals of black-spotted pond frogs. Complete separation of 92 frogs was achieved with six loci.
Confirmation of genetic diversity and distance
Genetic diversity and population differentiation were quantified using GenAlEx version 6.5 (Peakall & Smouse,
genotyped. GeneMapper version 6.1 (Thermo Fisher-Ap-plied Biosystems) was employed to evaluate genotype errors and the presence of a null allele. GENEPOP version 4.7 (Rousset, 2008) was used to determine deviation from Hardy–Weinberg equilibrium (HWE) and linkage disequi-librium (LD) at the loci of seven microsatellites. There were no null alleles, significant deviations from Har-dy-Weinberg equilibrium, or evidence of LD at the seven loci tested. In addition, by identifying the number of multiple genotypes, it was confirmed that these seven loci were sufficient to distinguish population differentiation from 95 frogs (Fig. 2).
2012) and Arlequin version 3.5 (Excoffier & Lischer, 2010). Shannon’s information index (I), molecular diversi-ty (h), and inbreeding coefficient relative to the subpop-ulation (FIS) were calculated using mean number of alleles (NA), effective number of alleles (NE), observed heterozy-gosity (HO), and expected heterozygosity (HE). Three types of diversity indices (I, h, FIS) were used to compare genetic diversities of frog populations from four watershed areas. Population differentiation (FST) and p-value of FST were obtained using Arlequin version 3.5. They were used to express the genetic distance among populations of frogs collected from those four watersheds. In addition, Nei’s genetic distance was obtained using GenAlEx version 6.5 and expressed using an unweighted pair group method with an arithmetic mean (UPGMA) hierarchical tree form using Past 3 software (Hammer et al., 2001).
Analysis of population genetic structure
A discriminant analysis of principal components (DAPC) Table 1. Information of seven microsatellite loci in black-spotted pond frogs
Primer sequence (5’ to 3’) F: TGAAGTATTCAGGTACAACAGGT R: GGGCCAAAAGAGAGGGT F: GCTTCGGGCTATAAATCAAACA R: GCCTGGCCGACTACACG F: CCGGAAGGCAGTGGAGGACA R: ATGGACATGCGGTGGGGTAGG F: CGCTTACTATGGGGGGATA R: GCCTGAGAAGGGTGGTGCT F: TCTCGGGAGGAAAGCAATGG R: AAGGAGCCTGGGACTATGGTAAAC F: GCACAGTTAGCGAGATGGA R: CTCACTAGAGCTGGGTGGTAT F: AGTGCAACATCAACTTGGGTG R: GCAGAGTCGCTGTCGGGA (TGC)7 (TGC)4TGTG(GTT)3TT(TGC)6 (AAC)7 (GA)5 (AAC)5 (GCA)7 (GCT)6 269–281 235–250 221–254 154–166 208–214 198–228 119–200 Rnh-1 Rnh-2 Rnh-3 Rnh-4 Rnh-6 Rnh-9 Rnh-10 58 62 52 62 62 59 62 Repeat motif Size (bp) Locus ID Ta
was performed using the “adegenet” package (Jombart et al., 2010) in R to analyze clusters of population structure through multivariate clustering analysis. DAPC uses prin-cipal component analysis (PCA) to reduce the dimension of genetic variation. It then uses principal components generated to produce a linear combination of correlat-ed alleles in linear discriminant analysis (Jombart et al., 2010; Waraniak et al., 2019). Through this analysis, popu-lation structures in those four watershed areas were iden-tified using the discriminant function (DF). STRUCTURE version 2.3.4 (Pritchard et al., 2000) was used to conduct Bayesian clustering analysis to infer whether or not each individual received a portion of the allele from a poten-tial population K. STRUCTURE analysis was performed with 100,000 burn-ins and 100,000 simulations. The Δ K method (Evanno et al., 2005) of STRUCTURE Harvester (Earl & Vonholdt, 2012) was used to determine the most suitable K value. Results from each of three independent STRUCTURE analyses revealed the most suitable cluster range of populations for separating frog populations col-lected from the four watersheds.
Result
Comparison of genetic diversity
For the seven microsatellite loci of 95 frogs, overall NA, NE, HO, and HE were 3.893 (3.571-4.286, Han-Nakdong), 2.187 (1.965-2.489, Han-Yeongsan), 0.323 (0.259-0.398, Han-Nakdong), and 0.389 (0.336-0.422, Han-Geum), respectively (Table 2). The population of Han River had a lower genetic diversity (I = 0.768, h = 0.397) than the overall population (I = 0.768, h = 0.397), although it had a similar inbreeding coefficient (FIS = 0.191) to the overall population (FIS = 0.179). The population of Geum River had
similar genetic diversity (I = 0.785, h = 0.405) and in-breeding coefficient (FIS = 0.181) to the overall popula-tion. The population of Yeongsan River had higher genetic diversity (I = 0.819, h = 0.412) and inbreeding coefficient (FIS = 0.369) than the overall population, while the popu-lation of Nakdong had higher genetic diversity (I = 0.800, h = 0.430) and lower inbreeding coefficient (FIS = -0.024) than the overall population.
Identification of genetic distance
Paired FST ranged from 0.031 (Han-Yeongsan) to 0.181 (Han-Nakdong) for populations of four watersheds (Fig. 3). All p-values in paired FST from the population of four wa-tershed areas were significant (p < 0.05). The population of Han River was genetically similar to the population from the Geum River (FST = 0.041) and Yeongsan River (FST = 0.031). Likewise, the population of Geum River was ge-netically similar to the population from Yeongsan River (FST = 0.048). On the other hand, paired FST values of the pop-ulation in Nakdong River with the other three poppop-ulations were high (Han River, 0.181; Geum River, 0.087; and Yeongsan, 0.143). Therefore, the population of Nakdong River is likely to be genetically distinct from populations of other rivers.
Analysis of the population genetic structure
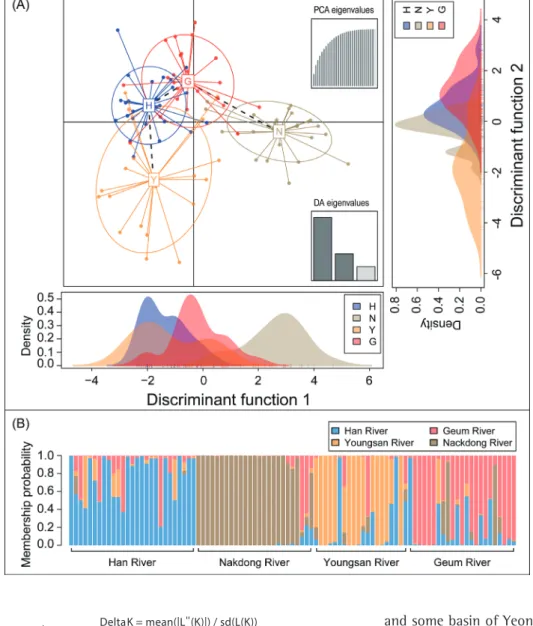
In DAPC, the discriminant function 1 (DF1) explained 60.79% of the genetic variation in 95 black -spotted pond frogs sampled and DF2 explained 25.80% of the genetic variation. The DF1 value showed that populations of frogs collected from the Han River, Geum River, and Yeongsan River were of the same group while populations collected from the Nakdong River were distinct from other popula-tions (Fig. 4A). Using 100% of the explanatory power of all
N, samples size; NA, mean number of alleles; NE, effective number of alleles; HO, observed heterozygosity; HE, expected heterozygosity; I, Shannon’s information index; FIS, inbreeding coefficient relative to the subpopulation; h, molecular diversity.
Table 2. Genetic diversity of seven nuclear microsatellite loci estimated for four populations of 95 black-spotted pond frogs Group Han Geum Youngsan Nakdong Overall 27 23 20 25 N 3.571 3.714 4.000 4.286 3.893 NA 1.965 2.059 2.489 2.236 2.187 NE 0.259 0.349 0.286 0.398 0.323 HO 0.336 0.422 0.402 0.397 0.389 HE 0.670 0.785 0.819 0.800 0.768 I 0.191 0.181 0.369 -0.024 0.179 FIS 0.342 0.405 0.412 0.430 0.397 h
genetic diversity and inbreeding coefficient. Population differentiation (FST), DAPC, and Nei’s genetic distance showed that these four populations were distinct. In par-ticular, it implied that the population of the Nakdong River was genetically separated from population from the other three river basins (Han River, Geum River, and Yeongsan River). Bayesian cluster structure anal-ysis (STRUCTURE) also showed that the population of Nakdong River was likely to have originated from other populations than the three populations that appeared to have a common genetic origin.
Like biodiversity, the high genetic diversity of species can increase resistance and resilience of organisms to environmental changes or disturbances, thereby serving as a biological insurance that guarantees the stability of the species over time and the ecosystem in turn (Hughes & Stachowicz, 2004; Spielman et al., 2004). Genetic diversi-ty can change due to habitat disturbance, population size, and/or population connectivity. In general, small popula-tions living in disturbed or isolated habitats often tend to show decreased genetic diversity with increased inbreed-ing and less gene flow (Banks et al., 2013; Young et al., 1996). The negative pattern of genetic diversity in the population from Han River suggests that this population might have experienced a habitat disturbance or popu-lation decline more recently compared to other popula-tions. On the other hand, the population of Geum River had an average pattern of genetic diversity, indicating that this population was more stable than the population of Han River. Inbreeding is generally known to reduce genetic diversity by causing loss of alleles (Willoughby et al., 2015). However, the population of Yeongsan River showed both high genetic diversity and inbreeding coef-ficient. This result might be because the Yeongsan River population is relatively large, but partially isolated. The population of Nakdong River showed a positive pattern of genetic diversity through high genetic diversity and low inbreeding probability, indicating that its genetic exchange might be active and that the population main-tained its stability.
Analyses for FST, DAPC, and Nei’s genetic distance showed that populations of frogs collected from four wa-tersheds were genetically separated. Among them, popu-lation of the Nakdong River was found to be more clearly separated from populations of Han River, Geum River, and Yeongsan River. Furthermore, STRUCTURE analysis showed that the population of the Nakdong River was more likely to have a different genetic origin than popu-lations of Han, Geum, and Yeongsan rivers. This pattern might be because Sobaek Mountains, including Jirisan (1,915 m), have restricted population distribution (Fig. 1). In fact, when the domestic territory is geographically divided, Fig. 3. Heatmap of paired FST values among black-spotted
pond frogs from four populations. The number onthe right represents paired FST value. All paired FST values were significant (p < 0.05).
discriminant functions of DAPC, the fine-scale genetic structure indicated that frogs from four watershed areas could be separated into independent populations accord-ing to their genetic variance (Fig. 4B).
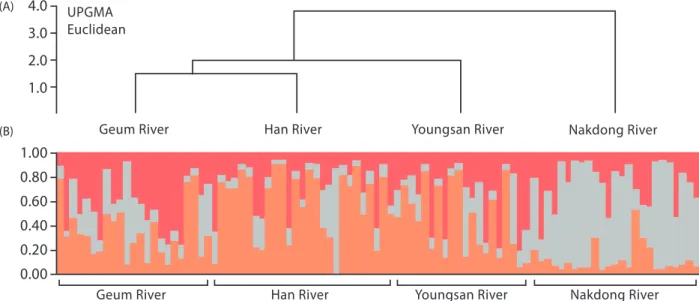
In the STRUCTURE harvester analysis, the most suitable K value for distinguishing these frog populations was 3 (Fig. 5). The UPGMA graph of Nei’s genetic distance showed that populations from Han River and Geum River were genetically similar while the population from Nak-dong River was genetically distinct from the other three populations (Fig. 6A). STRUCTURE analysis also showed that the population of Nakdong River was a genetically distinct K population from populations of Han, Geum, and Yeongsan Rivers. On the other hand, populations of Han, Geum, and Yeongsan Rivers appeared to have the same origin in the STRUCTURE clustering analysis (Fig. 6B).
Discussion
In this study, the genetic diversity and population structure of black-spotted pond frogs collected in four watershed areas in Korea were compared using seven microsatellite loci. The population with the lowest genetic diversity (I and h) and the highest inbreeding coefficient (FIS) was the population collected from the Han River. The population of the Nakdong River showed opposite results. In the population of Geum River, genetic diversity and inbreeding coefficient were similar to those of the entire population. The population of Yeongsan River had both high
Fig. 5. The most suitable K of black-spotted pond frogs obtained by the ΔK (delta K) method with STRUCTURE Harvester. The value of delta K was the highest at three (ΔK: 25.252).
and some basin of Yeongsan River, divided by the Sobaek Mountains is distinct from other areas, including the Han River basin and Geum River basin (Jeong & Lee, 2000). This biogeographic split is also supported by distinct fish communities from these regions which show a similar pat-tern (Watanabe et al., 2017; Yoon et al., 2012). If more de-tailed regional population sampling and the genetic struc-ture of various species are analyzed, it may be possible to refine the population range of domestic amphibians. In contrast, the genetic structure of the Japanese tree frog (Hyla japonica), another widely distributed amphibi-ans on the Korean peninsula, showed a different pattern. The genetic structure of Japanese tree frogs based on the haplotype network of the mitochondrial cytochrome b gene showed a high probability of having one population range in Korea (Dufresnes et al., 2016). The difference in these results might be due to differences in genetic analy sis techniques used or different ecological characteristics of
Fig. 4. Population genetic stru- cture by multivariate clustering methods (discriminant analysis of principal components, DAPC): (A) Discriminant function 1(DF1) explained 60.79% of the genetic variation in black-spotted pond frogs from four river basins (H: Han river, G: Geum river, Y: Youngsan river, N: Nakdong river), and (B) DF2 explained 25.80% of the genetic variation in these frogs. Fine-scale structures represent the probability that frogs are assigned to each group.
Fig. 6. Results for population clustering by Nei’s genetic distance and Bayesian clustering algorithms: (A) UPGMA (Euclidean) tree of genetic distance among black-spotted pond frogs in four river basins, (B) Population genetic structure obtained by Bayesian clustering algorithms (STRUCTURE analysis) among black-spotted pond frogs in four river basins.
Acknowledgments
This research was supported by the National Research Foundation of Korea (NRF) grant funded by the Korea government (MSIT) (No. 2018R1C1B3008645).
References
Banks, S.C., Cary, G.J., Smith, A.L., Davies, I.D., Driscoll, D.A., Gill, A.M., et al . (2013). How does ecological disturbance influence genetic diversity? Trends in Ecology and Evolution , 28, 670-679. doi:10.1016/
j.tree.2013.08.005
Beebee, T.J.C. (1996). Ecology and conservation of amphibians. Berlin: Springer Science & Business Media. Beebee, T.J.C. (2005). Conservation genetics of
amphibians. Heredity , 95, 423-427. doi:10.1038/ sj.hdy.6800736
Dufresnes, C., Litvinchuk, S.N., Borzée, A., Jang, Y., Li, J.T., Miura, I., et al. (2016). Phylogeography reveals an ancient cryptic radiation in East-Asian tree frogs (Hyla japonica group) and complex relationships between continental and island lineages. BMC Evolutionary Biology, 16, 253. doi:10.1186/s12862-016-0814-x Earl, D.A., and Vonholdt, B.M. (2012). STRUCTURE
HARVESTER: a website and program for visualizing STRUCTURE output and implementing the Evanno method. Conservation Genetics Resources, 4, 359-361. doi:10.1007/s12686-011-9548-7
Evanno, G., Regnaut, S., and Goudet, J. (2005). Detecting species. Population genetic analysis of a single locus of
relatively well-preserved mitochondrial DNA is commonly used for many taxa. However, it has lower variability than microsatellite analysis which analyzes the composition of a gene in a population using multiple loci (Sunnucks, 2000). Ecological characteristics of the black-spotted pond frog, a semi-aquatic frog that has high philopatry with gene flow depending on water source are different from those of the Japanese tree frog, a terrestrial amphibian that can alternately move between its habitat and the breed-ing ground. Thus, the difference observed might be due to different population genetic structures. In the future, it may be necessary to compare population genetic patterns among various species with different ecological charac-teristics using genetic markers of the same or similar vari-ability to identify differences and changes in the popula tion structure according to natural and artificial factors. Identifying the origin and extent of a population in an arti-ficially designated watersheds might help us define the spatial scale to protect and manage the population. In addition, this may be applicable to conservationgenet-ic studies that identify factors of population reduc tion by comparing composition patterns of genes in com-mon species with phylogenetically adjacent endangered amphibians.
Conflict of Interest
The authors declare that they have no competing interests.
the number of clusters of individuals using the software STRUCTURE: a simulation study. Molecular Ecology, 14, 2611-2620. doi:10.1111/j.1365-294X.2005.02553.x Excoffier, L., and Lischer, H.E.L. (2010). Arlequin suite ver
3.5: a new series of programs to perform population genetics analyses under Linux and Windows. Molecular Ecology Resources, 10, 564-567.
doi:10.1111/j.1755-0998.2010.02847.x
Finn, D.S., Encalada, A.C., and Hampel, H. (2016). Genetic isolation among mountains but not between stream types in a tropical high-altitude mayfly. Freshwater Biology, 61, 702-714. doi:10.1111/fwb.12740
Finn, D.S., Theobald, D.M., Black, W.C., and Poff, N.L. (2006). Spatial population genetic structure and limit-ed dispersal in a Rocky Mountain alpine stream insect. Molecular Ecology , 15, 3553-3566. doi:10.1111/
j.1365-294X.2006.03034.x
Garcia, V.O.S., Ivy, C., and Fu, J. (2017). Syntopic frogs reveal different patterns of interaction with the landscape: A comparative landscape genetic study of Pelophylax nigromaculatus and Fejervarya limno-charis from central China. Ecology and Evolution, 7,
9294-9306. doi:10.1002/ece3.3459
Garris, A.J., Tai, T.H., Coburn, J., Kresovich, S., and McCouch, S. (2005). Genetic structure and diversity in Oryza sativa L. Genetics, 169, 1631-1638. doi:10.1534/
genetics.104.035642
Gong, J., Lan, H., Fang, S.G., and Wan, Q.H. (2013). Development and characterization of 13 polymorphic microsatellite DNA markers for the pond green frog (Rana nigromaculata). Journal of Genetics, 92, 7-10. doi:10.1007/s12041-011-0004-y
Hammer, Ø., Harper, D.A.T., and Ryan, P.D. (2001). PAST: Paleontological statistics software package for educa-tion and data analysis. Palaeontologia Electronica, 4, 1-9.
Hatmaker, E.A., Staton, M.E., Dattilo, A.J., Hadziabdic, Ð., Rinehart, T.A., Schilling, E.E., et al. (2018). Population structure and genetic diversity within the endangered species Pityopsis ruthii (Asteraceae). Frontiers in Plant Science, 9, 943. doi:10.3389/fpls.2018.00943
Hughes, A.R., and Stachowicz, J. (2004). Genetic diversi-ty enhances the resistance of a seagrass ecosystem to disturbance. Proceedings of the National Academy of Sciences of United States of America, 101, 8998-9002.
doi:10.1073/pnas.0402642101
Jeong, H., and Lee, Y.I. (2000). Late Cambrian biogeogra- phy: conodont bioprovinces from Korea. Palaeogeogra-phy, Palaeoclimatology, Palaeoecology, 162, 119-136.
doi:10.1016/S0031-0182(00)00108-5
Jombart, T., Devillard, S., and Balloux, F. (2010). Discrim-inant analysis of principal components: a new method for the analysis of genetically structured populations. BMC Genetics, 11, 94. doi:10.1186/1471-2156-11-94 Lam, A., Toussaint, E.F., Kindler, C., Van Dam, M.H.,
Panjaitan, R., Roderick, G.K., et al. (2018). Stream flow alone does not predict population structure of diving beetles across complex tropical landscapes. Molecular Ecology, 27, 3541-3554. doi:10.1111/mec.14807 Luikart, G., and England, P.R. (1999). Statistical
analy-sis of microsatellite DNA data. Trend in Ecology and Evolution , 14, 253-256. doi:10.1016/S0169-5347(99)01632-8
Ma, D., Liu, H.T., Ji, Y.J., Shi, C.M., Yang, Y.H., and Zhang, D.X. (2015). Black-spotted pond frog (Pelophylax
nigro-maculatus) on the Chinese Loess Plateau represents a cryptic species: Evidence from molecular phylogeny and ecological niche modeling. Journal of Systematics and Evolution, 53, 339-350. doi:10.1111/jse.12156 Mullen, L.B., Woods, H.A., Schwartz, M.K., Sepulveda,
A.J., and Lowe, W.H. (2010). Scale-dependent genetic structure of the Idaho giant salamander (Dicamptodon aterrimus) in stream networks. Molecular Ecology, 19, 898-909. doi:10.1111/j.1365-294X.2010.04541.x Peakall, R., and Smouse, P.E. (2012). GenAlEx 6.5:
genetic analysis in Excel. Population genetic software for teaching and research–an update. Bioinformatics, 28, 2537-2539. doi:10.1093/bioinformatics/bts460
Pritchard, J.K., Stephens, M., and Donnelly, P. (2000). Inference of population structure using multilocus genotype data. Genetics, 155, 945-959.
Rousset, F. (2008). Genepop’007: a complete re-im-plementation of the genepop software for Windows and Linux. Molecular Ecology Resources, 8, 103-106. doi:10.1111/j.1471-8286.2007.01931.x
Spielman, D., Brook, B.W., Briscoe, D.A., and Frankham, R. (2004). Does inbreeding and loss of genetic diversity decrease disease resistance? Conservation Genetics, 5, 439-448. doi:10.1023/B:COGE.0000041030.76598.cd Sunnucks, P. (2000). Efficient genetic markers for
population biology. Trends in Ecology and Evolution, 15, 199-203. doi:10.1016/S0169-5347(00)01825-5 Wang, S., Zhu, W., Gao, X., Li, X., Yan, S., Liu, X., et al.
(2014). Population size and time since island isolation determine genetic diversity loss in insular frog
popula-tions. Molecular Ecology, 23, 637-648. doi: 10.1111/ mec.12634
Waraniak, J.M., Fisher, J.D., Purcell, K., Mushet, D.M., and Stockwell, C.A. (2019). Landscape genetics reveal
ape features and climate history in the northern leopard frog (Rana pipiens) in North Dakota. Ecology
and Evolution, 9, 1041-1060. doi:10.1002/ece3.4745 Watanabe, K., Tominaga, K., Nakajima, J., Kakioka, R.,
and Tabata, R. (2017). Japanese freshwater fishes: biogeography and cryptic diversity. In M. Motoka-wa, and H. Kajihara (Eds.), Species Diversity of Animals in Japan (pp. 183-227). Tokyo: Springer. doi:10.1007/978-4-431-56432-4_7
Willoughby, J.R., Fernandez, N.B., Lamb, M.C., Ivy, J.A., Lacy, R.C., and DeWoody, J.A. (2015). The impacts of inbreeding, drift and selection on genetic diversity in captive breeding populations. Molecular Ecology, 24, 98-110. doi:10.1111/mec.13020
Yoon, J.D., Jang, M.H., Kim, H.W., and Joo, G.J. (2012). Fish biodiversity monitoring in rivers of South Korea. In S. Nakano, et al. (Eds.), The Biodiversity Observa-tion Network in the Asia-Pacific Region (pp. 175-191).
Tokyo: Springer. doi:10.1007/978-4-431-54032-8_13 Young, A., Boyle, T., and Brown, T. (1996). The
popula-tion genetic consequences of habitat fragmentapopula-tion for plants. Trends in Ecology and Evolution, 11, 413-418. doi:10.1016/0169-5347(96)10045-8
Zane, L., Bargelloni, L., and Patarnello, T. (2002). Strategies for microsatellite isolation: a review. Molecular Ecology , 11, 1-16.