논문 2012-49SP-4-14
Time Stretched Pulse를 이용한 무향실 자유음장 분석
( Analysis of free field for Acoustic Anechoic Chamber based on Time
Stretched Pulse )
김 건 욱
**( Keonwook Kim )
요 약
Time Stretched Pulse (TSP)는 공간적으로 임펄스(Impulse)를 효율적으로 전달하고 분석하기 위해서 사용되어 진다. 하지만 발신기와 수신기의 전달함수를 포함시키지 않으면, 시간 영역에서의 분석은 직, 간접 신호의 중첩으로 공간의 자유음장 특성을 파 악하기 불가능하다. 일반적으로 공간의 자유음장(Free Field)은 표준 ISO 3745 Annex A에 의해서 평가되고 있는데, 일정 주파수 간격의 1/3 옥타브 밴드 신호를 연속적으로 발신 및 수신하여 거리별 신호 감소를 역자승 법칙(Inverse Square Law)을 적용하여 판단하고 있다. 본 논문은 자유음장 분석에서 TSP 신호를 적용하여 일반적인 ISO 3745의 1/3 옥타브 밴드 신호와 비교하였다. 역자승 모델 값과의 차이점을 분석한 결과 TSP 신호 또한 1/3 옥타브 밴드 신호와 유사한 결과를 보이고 있으며, 측정 시간 및 확장성에 대해서는 우수하게 판단되었다. 본 실험에서는 ISO 3745에 의해서 제한된 주파수 범위에서 자유음장과 반자유음장 (Hemi-free Field)을 검증 받은 무향실을 사용하였다.
Abstract
Time Stretched Pulse (TSP) is used for transmitting and analyzing the impulse signal over the designated spatial place. However, if transfer functions of transmitter and receiver are unknown, performance investigation of free field in temporal domain is barely possible due to the overlap between the direct and indirect signal from the space. Generally, the free field or hemi-free field is evaluated by the Annex A of ISO 3745 in which utilizing the inverse square law with one-third octave band signals. In this paper, the author performs analysis of free field via applying TSP with inverse square law and the results are compared with the one-third octave band signals. According to the analysis of deviation between the corresponding signal and inverse square law model, the proposed TSP method provides the comparable performance index to the one-third octave band signal with reduced measuring time. Provided that the pre-whitening can be implementable by employing the speaker and microphone transfer function, further analyses from TSP compression are able to be performed such as multipath separation from time domain data. The anechoic chamber used in this experiment is verified conformance with ISO 3745 for free field and hemi-free field condition for limited frequency of the signal.
Keywords: Time Stretched Pulse, Free Field, ISO 3745, Anechoic Chamber, Inverse Square Law
Ⅰ. Introduction
The anechoic chamber is fundamental environment to evaluate a range of acoustic parameters with high
*
평생회원-교신저자, 동국대학교 전자전기공학부 (Division of Electronics and Electrical Engineering, Dongguk University - Seoul)
접수일자: 2012년1월5일, 수정완료일: 2012년4월12일
accuracy. The chamber presents free field with the climate controlled indoor situations but expects the exclusive room at a great cost in order to isolate and absorb sound field. The lab-designed anechoic chamber with acoustic wedge or pyramid can be a solution to the sound experiments however free field must be evaluated by proper procedure. The qualification method includes inverse square law
which represents the natural spatial decreasing of carrier power over the distance.
The signal processing methods for estimating spatial response have progressed various ways. Upon the assumption of linearity and time-invariance of propagation medium, the known frequency spectra is sent to the diverse receiver locations in order to obtain the transfer function in time and frequency domain. The impulse signal is ideal choice for finding the system response however, there are acoustical implementation difficulties in creating high powered abrupt signal in instantaneous interval over the medium. Instead of sending the whole spectrum power simultaneously, time delayed or stretched sweep signal is utilized for the estimation. Berkhout et al. proposed the deconvolution method based on the sweep signal[1] and Aoshima stretched the signal known as Time Stretched Pulse (TSP) by modifying the group-delay over the frequency domain to send the flat spectrum signal efficiently[2]. Also Aoshima work was generalized and improved by Suzuki et al. for the measurement of long impulse responses[3]. The uncorrelated noise known as Maximum Length Sequences (MLS) was employed for the impulse response by Rife and Vanderkooy[4]. The FFT based general signal processing methods was surveyed and analyzed by Schoukens et al[5].
The annex A of ISO 3745[6] describes the criterion of ideal free field and hemi-free field condition for general purpose measurement in detail. Besides the standard methods, simulation and measurement methods for chamber are continuously investigated to understand the free field of the space. Wang and Cai proposed the useful mathematical insight to design an anechoic room by solving wave equations including the interference of first reflection[7]. Cunefare et al. evaluated the relative merits of continuous versus discrete traverses, of fixed versus optimal reference analysis of the traverse data, and of the use of pure tone versus broadband signals[8]. The signal type in terms of bandwidth and coherency was explored for
the performance measurement of anechoic chamber[9]. Spatial response was measured between pairs of microphones and compared with the inverse square law[10]. The numerical prediction of the free field quality by a frequency-dependent admittance matrix was performed for the low frequency range[11].
Among the numerous spatial field measurement methods, TSP, which is recently known as swept sine method, is versatile technique in order to transmit the band limited signal effectively. The stretching and compressing function of TSP provides the phase manipulation of the any given signal for improving the acoustical representation in time domain. Due to the short flight time of the signal, TSP has the limited capability for evaluating the free and hemi-free field condition in the medium profile chamber. The significant overlap between the direct and indirect path signal prohibits employing the conventional TSP method for field condition estimation.
The work presented in this paper performs analysis of free and hemi-free field by using TSP of Suzuki's work[3]. The typical TSP method performs the analysis over the temporal domain based on the signal path separation however this paper proposes TSP method over the spatial domain based on the signal spectral separation. The evaluation over spatial domain is achieved by the inverse square law and the results are compared with ISO 3745 which employs one-third octave band signals. The anechoic chamber used in this experiment is verified conformance with ISO 3745 for free field and hemi-free field condition for limited frequency of the signal[12].
Ⅱ. Anechoic chamber
1. Chamber configuration
The dimension of chamber frame is 3 m x 2.1 m x 2.1 m in length-width-height with 378 acoustic pyramids based on the open cell polyurethane foam. The taper and base length of the pyramid are 42 cm
and 8 cm, respectively and the base width of the pyramid is 30 cm by 30 cm which is consistent to the binding agent of the chamber frame. The whole formation and individual pyramid of the chamber are mounted and bound by rivet shelving structure using the angle posts and beams. At the end of the chamber north, the sound source is positioned to send acoustic signal and middle and south of the chamber are the most likely the working area over the equal height plane with speaker.
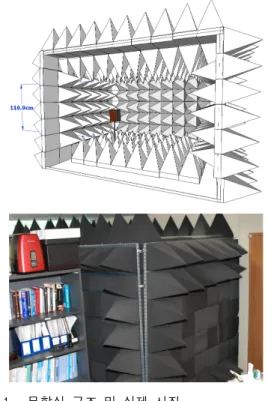
The illustration of chamber is given in Fig. 1 which shows the realized working space as 2.1 m2 in area and 1.1 m in height. Upon the near wall location for sound source, the chamber achieves roughly 1.1 m2 free field region for the receiver. The problem of low interior height can be handled by removing the pyramids on the floor for the instrumental setup and repositioning the pyramids back to the floor for the actual experiment. Also observe that, without the pyramids on the ground, the arrangement is for the hemi anechoic chamber experiments. The single layer of the pyramids for the chamber exterior is
그림 1. 무향실 구조 및 실제 사진
Fig. 1. Structure and picture of the anechoic chamber.
vulnerable to the intense level of noise outside however the chamber is situated in the tranquil laboratory room in order to minimize the ambient noise level for the experiments.
2. Measurement configuration
Assessing the free field performance requires to measure the precise relative position between the sound source and receiver. Instead of using the Cartesian system, cylindrical coordination is employed for determination of relative position with speaker position as origin. From the origin, laser level meter (Black & Decker; BDL220S) which is located on top of the speaker radiates the vertical laser surface for indicating the angle which is estimated by the protractor placed in front of the level meter. Note that the axis perpendicular to the speaker face is zero degree and clockwise rotation increases the angle. The distance of the circle is measured by the laser distance meter (Leica; DISTO D3a) which is installed beside the microphone. The distance meter is carefully positioned to measure the distance between the microphone end and the speaker driver with 1.0 mm accuracy. Once the angle surface is established for the certain degree, the microphone is precisely moved back and forth over the plane for the specific distance measured by the distance meter. The
그림 2. 각도와 거리를 측정하기 위한 스피커와 마이크 의 구성
Fig. 2. Speaker and microphone configuration for measuring the angle and distance.
configuration and actual picture of the measuring system is demonstrated at Fig. 2.
The performance of free and hemi-free field is evaluated according to the experimental arrangement of ISO 3745 annex A over the working area. Direct and indirect of signal propagation create unwanted emphasis or suppression of signal components over the spatial location for acoustic signal. Wide variation of magnitude and phase can be observed for distinct positions of source and receiver over the broadband of spectrum. The microphone operation grid is coordinated for five straight lines from the speaker for 0o, +5o, +10o, -5o, -10o angles and traverses the five straight paths with precise 5 cm distance beyond the near field. The overall positions of 220 working locations are investigated for free and hemi-free chamber which are easily interchangeable by simple labor.
Ⅲ. Conventional TSP method
The alternative method of impulse signal for flat power spectrum over the desired frequency range was proposed by Aoshima as TSP[2]. The basic idea of TSP is utilizing the frequency dependent group delay in order to generate sweep signal over the intended frequency range. With phase specified as a discrete function of k, the group delay of a system is defined as
∠ (1)
where H(k) is the frequency domain signal and ∠ is phase operator. TSP signal is generated at frequency domain with phase in terms of k square therefore the corresponding time domain signal is proportionally retarded and expanded to its frequency. According to the minus sign on the Eq. (1), the highest frequency component arrives first and the low frequency components come next.
Suzuki et al. generalized and optimized TSP for
precise measurement of the transfer functions over the range of frequency from d.c. to fs/2, where fs is
sampling frequency[3]. The stretching and compressing function is given as below continuously.
≤ ≤ ≤ ≤ (2)
≤ ≤ ≤ ≤ (3)Note that the equation above ignores to show the conjugate relationship which ensures pure real output since the equation only provides linear phase operation over the given signal. In the equation, the stretch parameter m is 1200 and the length of pulse
N is 4096. With 44.1 kHz sampling frequency, the
length of the impulse response is assumed to be less than N due to the small size of the chamber. In 4096 sample time, the acoustic signal transmits approximately 32 m which is greatly longer than the chamber length over axial, tangential, and oblique mode of propagation.
The general TSP procedure given by Suzuki's work[3] is listed below:
(1) Create weight function G(k) for band limited signal. G(k) is the window function for bandpass signal otherwise G(k) is all ones for allpass filter. Also observe that G(k) is designed for real output signal.
(2) Take inverse Fourier transform over {G(k)
H(k)} to obtain time domain data h(n) where n is
discrete time index and H(k) is stretching function given by Eq. (2).
(3) Transmit the time domain data h(n) and the record the data into r(n).
(4) Perform the Fourier transform on r(n) to obtain R(k).
{H-1(k)R(k)} to find the impulse response of the system. H-1(k) is the compressing function given by Eq. (3).
In the above procedure, the r(n) includes not only spatial information but also microphone and speaker characteristics in the experiment therefore it is difficult to divide the direct and indirect signal on time series data as shown in Fig. 3. The figure is depicted from the impulse signal which represents the bandwidth from 0 Hz up to 22.05 kHz (fs/2). The data
on the figure are continuously fluctuating over the long period of time hence extracting the direct path signal is challenging and problematic. If the transfer function of the input and output device is known and considered to the weight function G(k), TSP provides the improved representation of signal path. However the transfer function should be measured on the free field chamber which is in full conformance with ISO 3745 and cannot be estimated over the conventional free field chambers. TSP function is useful tool to investigate signal propagation over the large chamber due to the long flight time. For the small and medimum profile chamber with unknown device transfer function, TSP should be employed in alternative way. 1460 1480 1500 1520 1540 1560 1580 -15 -10 -5 0 5 Time in sample M agnit ud e
Impulse response of the time stretched function
그림 3. 일반적인 TSP를 이용한 챔버의 임펄스 반응 Fig. 3. Impulse response of the chamber with TSP.
Ⅳ. Proposed TSP method
TSP is the effective technique to create the band controlled sweep signal by manipulating weight
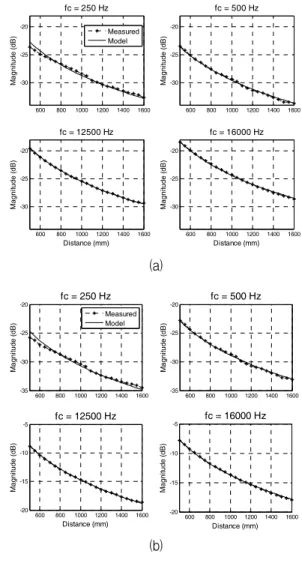
600 800 1000 1200 1400 1600 -30 -25 -20 fc = 250 Hz M a gni tude ( dB ) 600 800 1000 1200 1400 1600 -30 -25 -20 fc = 500 Hz M a gni tude ( dB ) 600 800 1000 1200 1400 1600 -30 -25 -20 fc = 12500 Hz Distance (mm) M agni tude (d B ) 600 800 1000 1200 1400 1600 -30 -25 -20 fc = 16000 Hz Distance (mm) M agni tude (d B ) Measured Model (a) 600 800 1000 1200 1400 1600 -35 -30 -25 -20 fc = 250 Hz M a gni tude ( d B ) Measured Model 600 800 1000 1200 1400 1600 -35 -30 -25 -20 fc = 500 Hz M a gni tude ( d B ) 600 800 1000 1200 1400 1600 -20 -15 -10 -5 fc = 12500 Hz Distance (mm) M agni tude ( dB ) 600 800 1000 1200 1400 1600 -20 -15 -10 -5 fc = 16000 Hz Distance (mm) M agni tude ( dB ) (b) 그림 4. 선택된 1/3 옥타브 노이즈 신호 (a) 및 TSP 신 호 (b)에 대한 측정된 음압 레벨 및 역자승 모 델 분포 곡선 (각도 0o 및 완전 무향)
Fig. 4. Sound pressure level & inverse square model distribution for selected 1/3 octave random. (a) TSP signal (b) over 0o of free field chamber
function G(k). TSP in the given experiment is utilized for sending full range of spectrum signal and the free field performance is measured by the inverse square law over the received TSP. Since the received TSP involves the entire range of spectrum, the recorded signal is divided into the one-third octave band signal by executing the filters according to the ANSI S1.11-2004[13]. The center frequencies of the one-third octave band are listed as 250 Hz, 500 Hz, 1 kHz, 2 kHz, 4 kHz, 5 kHz, 6.3 kHz, 8 kHz, 10 kHz, 12.5 kHz, and 16 kHz. The average power of the one-third octave band signal is compared with the inverse
square law model as below in order to determine the free field performance.
(4)
In the equation, Lp(ri) is the sound pressure level in
decibel at the distance ri. The a and r0 are model
parameters for amplitude and distance correspondingly.
Basically, the proposed method follows ISO 3745 technique except the choice of transmit signal and post processing with one-third octave filter bank. The suggested TSP procedures are listed below:
(1) Take inverse Fourier transform over H(k) to obtain time domain data h(n). Note that H(k) is modified for real h(n) and the h(n) is full band signal. (2) Transmit the time domain data h(n) and the record the data into r(n).
(3) Perform the convolution on r(n) with each one-third octave band filters.
(4) Compute the average power for each band and location. Compare the magnitude with the inverse square law from Eq. (4).
Note that the parameters of the Eq. (4) should be obtained by using the least square method prior to performing the above procedure (4). The devised TSP method allows to evaluate anechoic chamber field condition which is barely possible to estimate based on the conventional TSP technique. Comparing to ISO 3745, the benefit of the suggested TSP method is reducing measurement time because the one-third octave random noise must be long enough to achieve stable level. In ISO 3745 method, each one-third octave band signal is released for five seconds in order to achieve statistical steady condition however the single TSP, which represents the whole frequency range, is 4096 sample time which is approximately 93 ms for 44.1 kHz sampling. In this experiment, 30 TSPs are arranged and ensemble averaged to reduce the statistical variance from measurements.
Ⅴ. Results
The instrumental setup for TSP experiment is identical to ISO 3745 configuration. Since there is no performance criterion for free and hemi-free field measurement based on TSP, this paper exercises the overall analysis which provides comparison between the results of ISO 3745 and TSP in graphic-wise investigation.
1. Free chamber
Fig. 4b shows the selected plots for measured and model pressure level of TSP signal and the counterpart is demonstrated at Fig. 4a which illustrates the result of ISO 3745 procedure based on the one-third octave band random signal. In Fig. 4b, there is certain difference in bias value for each corresponding figure due to the frequency response of speaker and microphone. In Fig. 4a, the one-third octave band signal is individually controlled for proper volume level therefore the figures present more consistent bias than TSP results. However, TSP signal transmits the complete spectrum signal with single propagation; the volume of the each range of frequency is unified at the time of wave creation. Therefore, the received level of the signal in TSP is sorely determined by the gain of frequency band from the speaker and microphone.
In the decision of free field performance, the value and fluctuation of the bias does not play any important role. Actually, the coherency of decreasing ratio which is 6 dB drop as the distance double is essential decisive factor for free and hemi-free field condition. The Fig. 4b depicts the approximately identical graph in shape to the Fig. 4a except the bias values. The two low frequency bands involve the visible but not significant deviation between measured and model values in the Fig. 4b as similar to the Fig. 4a. In both of the figures, measured values correctly follow the model values in the high frequency bands and the given equivalence indicates
the satisfactory state in free field performance. In Fig. 4b, maximum absolute deviations over the entire distance based on TSP are 1.101 dB (250
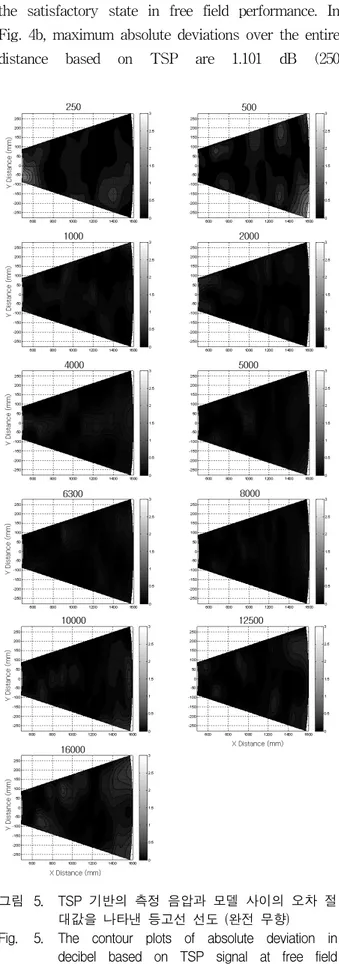
그림 5. TSP 기반의 측정 음압과 모델 사이의 오차 절 대값을 나타낸 등고선 선도 (완전 무향) Fig. 5. The contour plots of absolute deviation in
decibel based on TSP signal at free field chamber.
Hz), 0.330 dB (500 Hz), 0.184 dB (12.5 kHz), and 0.149 dB (16 kHz). Fig. 4a provides maximum absolute deviations over the entire distance based on one-third octave band signal as 0.942 dB (250 Hz), 0.338 dB (500 Hz), 0.178 dB (12.5 kHz), and 0.156 dB (16 kHz). Notice that the qualification of the anechoic chamber only considers the maximum deviation of measured sound pressure from theoretical levels using the inverse square law in ISO 3745.
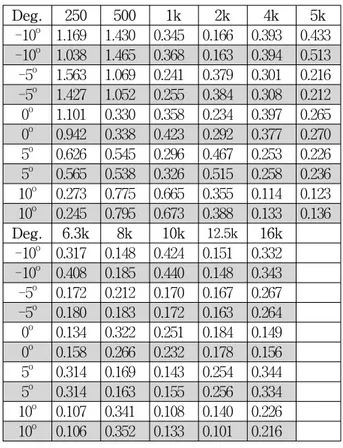
The insight of global characteristic over spectral and spatial domain can be explored by the contour plot given at Fig. 5. The contour plot presents the 0.4 m2 area out of the 2.2 m2 of entire chamber region. The gray representation of the contour plot indicates the absolute deviation in decibel between measured and model values. Note that most of area in the contour plots represents the below the 1 dB deviation. The absolute values of the maximum deviation for individual direction at the given frequency are illustrated as contour plot at Fig. 6 which shows the significant similarity in spatial distribution between TSP and one-third octave band signal. Table 1 also represents numerical results with the outcome of ISO 3745 which is placed with shaded cell. The numerical distribution of unshaded is relatively equal to the shaded values. Statistically, maximum and mean difference between two signal values is 0.159 dB and 0.027 dB respectively.
TSP signal (free field)
Angle (Degree) F requenc y (H z) -10 -5 0 5 10 250 500 1k 2k 4k 5k 6.3k 8k 10k 12.5k 16k 0 0.5 1 1.5 2 2.5
3 1/3 Octave band signal (free field)
Angle (Degree) F requ en cy (H z) -10 -5 0 5 10 250 500 1k 2k 4k 5k 6.3k8k 10k 12.5k 16k 0 0.5 1 1.5 2 2.5 3 그림 6. TSP (왼쪽) 및 1/3 옥타브 노이즈 신호(오른쪽) 의 각 방향 및 주파수(로그스케일)에 대한 최대 오차 절대값 등고선 선도 (완전 무향)
Fig. 6. The contour plot of maximum absolute deviation in decibel over the direction at the given frequency (log-scale) for TSP (left) and 1/3 octave band (right) signal at free field chamber.
Deg. 250 500 1k 2k 4k 5k -10o 1.169 1.430 0.345 0.166 0.393 0.433 -10o 1.038 1.465 0.368 0.163 0.394 0.513 -5o 1.563 1.069 0.241 0.379 0.301 0.216 -5o 1.427 1.052 0.255 0.384 0.308 0.212 0o 1.101 0.330 0.358 0.234 0.397 0.265 0o 0.942 0.338 0.423 0.292 0.377 0.270 5o 0.626 0.545 0.296 0.467 0.253 0.226 5o 0.565 0.538 0.326 0.515 0.258 0.236 10o 0.273 0.775 0.665 0.355 0.114 0.123 10o 0.245 0.795 0.673 0.388 0.133 0.136 Deg. 6.3k 8k 10k 12.5k 16k -10o 0.317 0.148 0.424 0.151 0.332 -10o 0.408 0.185 0.440 0.148 0.343 -5o 0.172 0.212 0.170 0.167 0.267 -5o 0.180 0.183 0.172 0.163 0.264 0o 0.134 0.322 0.251 0.184 0.149 0o 0.158 0.266 0.232 0.178 0.156 5o 0.314 0.169 0.143 0.254 0.344 5o 0.314 0.163 0.155 0.256 0.334 10o 0.107 0.341 0.108 0.140 0.226 10o 0.106 0.352 0.133 0.101 0.216 표 1. TSP (백색) 및 1/3 옥타브 노이즈 신호(회색)에 대해 각 방향의 최대 오차 절대값 (완전 무향) Table 1. Maximum absolute deviation in decibel over the
entire distance for TSP (unshaded) and 1/3 octave band (shaded) signal at free field chamber.
2. Hemi-free chamber
The hemi-free field is established by withdrawing the entire acoustic pyramids from the chamber floor. The absolute values of the maximum deviation for individual direction at the given frequency are provided as the contour plot at Fig. 7 that presents the substantial likeness in spatial distribution between TSP and one-third octave band signal. Table 2 develops the consolidation of absolute maximum deviation for the individual direction at the frequency. The numerical dispersion of TSP (unshaded) is fairly identical to the shaded values which show the results of ISO 3745. Statistically, maximum and mean difference between two signal values is 0.444 dB and 0.084 dB respectively.
TSP signal (hemi-free field)
Angle (Degree) F req ue nc y (H z) -10 -5 0 5 10 250 500 1k 2k 4k 5k 6.3k 8k 10k 12.5k16k 0 0.5 1 1.5 2 2.5
3 1/3 Octave band signal (hemi-free field)
Angle (Degree) F req uen cy (H z) -10 -5 0 5 10 250 500 1k 2k 4k 5k 6.3k8k 10k 12.5k16k 0 0.5 1 1.5 2 2.5 3 그림 7. TSP (왼쪽) 및 1/3 옥타브 노이즈 신호(오른쪽) 의 각 방향 및 주파수(로그스케일)에 대한 최대 오차 절대값 등고선 선도 (반무향)
Fig. 7. The contour plot of maximum absolute deviation in decibel over the direction at the given frequency (log-scale) for TSP (left) and 1/3 octave band (right) signal at hemi-free field chamber. Deg. 250 500 1k 2k 4k 5k -10o 1.354 2.223 0.961 0.357 0.222 0.207 -10o 1.457 2.228 1.296 0.327 0.182 0.125 -5o 1.355 2.238 1.143 0.939 1.041 0.778 -5o 1.259 2.369 1.550 0.906 0.894 0.660 0o 1.371 2.422 1.183 0.124 0.244 0.279 0o 1.453 2.613 1.535 0.155 0.178 0.229 5o 1.846 2.305 1.046 0.372 0.322 0.232 5o 1.911 2.526 1.421 0.378 0.218 0.178 10o 2.268 1.752 1.060 0.422 0.358 0.274 10o 2.337 1.881 1.504 0.376 0.339 0.127 Deg. 6.3k 8k 10k 12.5k 16k -10o 0.249 0.288 0.203 0.134 0.191 -10o 0.282 0.225 0.181 0.127 0.187 -5o 1.068 0.908 0.693 0.658 0.512 -5o 0.987 0.791 0.669 0.624 0.470 0o 0.184 0.235 0.082 0.127 0.255 0o 0.143 0.228 0.081 0.126 0.250 5o 0.433 0.282 0.224 0.126 0.218 5o 0.392 0.281 0.212 0.138 0.215 10o 0.210 0.273 0.220 0.164 0.215 10o 0.159 0.257 0.180 0.162 0.213 표 2. TSP (백색) 및 1/3 옥타브 노이즈 신호(회색)에 대해 각 방향의 최대 오차 절대값 (반무향) Table 2. Maximum absolute deviation in decibel over the
entire distance for TSP (unshaded) & 1/3 octave band (shaded) signal at hemi-free field chamber.
Ⅵ. Conclusions
TSP method is the effective technique to transmit the broadband acoustic signal over the airborne
medium by using the stretching and compressing the impulse or sinc function. This paper exploits the capability of TSP for sending desired band limited signal via stretching function. Once TSP signal is recorded by the receiver, the procedure of the free and hemi-free field evaluation follows ISO 3745 method via using the designated one-third octave filter bank. According to the analysis of plots and tables given above, the proposed TSP method provides the comparable performance index to ISO 3745. However, the value itself on the table requires the further mathematical analysis for quantity threshold in order to decide free field condition precisely. Provided that the pre-whitening can be implementable by employing the speaker and microphone transfer function, further analyses from TSP compression are able to be performed such as multipath separation from time domain data. In free and hemi-free field evaluation, TSP analysis can be defined as not only magnitude comparison but also the time and frequency domain analysis which is not shown here but the beneficiary advantage of TSP examination.
References
[1] A. J. Berkhout, D. de Vries, and M. M. Boone, “A new method to acquire impulse responses in concert halls,” J. Acoust. Soc. Am., Vol. 68, pp. 179-183, 1980.
[2] N. Aoshima, “Computer-generated pulse signal applied for sound measurement,” J. Acoust. Soc. Am., Vol. 69, pp. 1484-1488, 1981.
[3] Y. Suzuki, F. Asano, H. Y. Kim, and T. Sone, “An optimum computer-generated pulse signal suitable for the measurement of very long impulse responses,” J. Acoust. Soc. Am., Vol. 97, pp. 1119-1123, 1995.
[4] D. D. Rife, and V. John, “Transfer-Function Measurement /w. Maximum-Length Sequences,” J. Audio Eng. Soc., Vol 37, pp. 419-444, 1989. [5] J. Schoukens, R. Pintelon, E. van der Ouderaa,
and J. Renneboog, “Survey of excitation signals for FFT based signal analyzers,” IEEE Trans.
Instr. and Measur., Vol. 37, pp. 342-352, 1988. [6] International Organization for Standardization,
“Acoustics - Determination of sound power levels of noise sources using sound pressure - Precision methods for anechoic and hemi-anechoic rooms,” ISO 3745, 2003.
[7] J. Wang, and B. Cai, “Calculation of free-field deviation in an anechoic room,” J. Acoust. Soc. Am., Vol. 85, pp. 1206-1212, 1989.
[8] K. A. Cunefare, and et al. “Anechoic chamber qualification: traverse method, inverse square law analysis method, and nature of test signal,” J. Acoust. Soc. Am., Vol. 113, pp. 881-892, 2003. [9] K. A. Cunefare, J. Badertscher, and V.
Wittstock, “On the qualification of anechoic chambers; Issues related to signals and bandwidth,” J. Acoust. Soc. Am., Vol. 120, pp. 820-829, 2006.
[10] G. Alfageme, S. Bote, and B. Martin, “New measurement methods for anechoic chamber characterization,” AES 124th Conv. Amsterdam, Holand, 2008.
[11] S. Schneider, “Numerical prediction of the quality of an anechoic chamber in the low frequency range,” J Sound Vib., Vol. 320, pp. 990-1003, 2009.
[12] K. Kim, “Design and analysis of experimental anechoic chamber for localization,” J. Acoust. Soc. Kor, Vol. 31, No. 4, pp. 225-234, 2012. [13] Am. National Standards Institute, “Octave-Band
and Fractional-Octave-Band Analog and Digital Filters,” ANSI/ASA S111-2004(R2009), 2004. 저 자 소 개 김 건 욱(평생회원)-교신저자 1995년 동국대학교 전자공학과 학사 졸업. 1997년 플로리다 대학교 (University of Florida) 전자공학과(Dept. of ECE) 석사 졸업. 2001년 플로리다 대학교 전자공학과 박사 졸업. 2001년~2003년 플로리다 주립대 전자공학과 조교수 (Florida State Univ.) 2003년~현재 동국대학교 전자전기공학부
(조)부교수