Socioeconomic costs of liver disease in Korea
Sunmi Lee1, Woojin Chung2, and Kyung-Rae Hyun1
1Health Insurance Policy Research Institute, National Health Insurance Corporation; 2Graduate School of Public Health, Yonsei University, Seoul, Korea
Background/Aims: This study analyzed the scale and trends of the social and economic costs of liver disease in Korea for the past 5 years. Methods: The social aspects of socioeconomic costs were projected for viral hepatitis (B15-B19), liver cirrhosis, malignant neoplasm of the liver (C22) and other liver diseases (K70-K76), as representative diseases by dividing costs into direct and indirect from 2004 to 2008. Direct costs include hospitalization, outpatient, and pharmacy costs in the health-care sector, and transportation and caregiver costs. Indirect costs include the future income loss due to premature death and the loss of productivity resulting from absence from work. Results: The social and economic costs of liver disease were projected to be KRW 5,858 billion in 2004, KRW 5,572 billion in 2005, KRW 8,104 billion in 2006, KRW 6,095 billion in 2007, and KRW 5,689 billion in 2008. The future income loss resulting from premature death is thus greatest, from 73.9% to 86.1%, followed by the direct medical costs, from 9.0% to 18.1%. The productivity loss resulting from absence from work accounts for 3.3-5.5%, followed by the direct nonmedical costs such as transportation and caregiver costs, at 1.5-2.5%. Conclusions: Among the socioeconomic costs of liver disease in Korea, the future income loss resulting from premature death is showing a decreasing trend, whereas direct medical costs are increasing dramatically. (Korean J Hepatol 2011;17:274-291)
Keywords: Viral hepatitis; Liver cirrhosis; Malignant neoplasm of the liver; Costs; Korea
Received May 26, 2011; Revised September 20, 2011; Accepted October 4, 2011 Abbreviations: HCC, hepatocellular carcinoma
Corresponding author: Kyung-Rae Hyun
Health Insurance Policy Research Institute, National Health Insurance Corporation, 168-9 Yeomri-dong, Mapo-gu, Seoul 121-749, Korea Tel. +82-2-3270-9868, Fax. +82-2-3270-9840, E-mail; h7343@nhic.or.kr
Copyright Ⓒ 2011 by The Korean Association for the Study of the Liver The Korean Journal of Hepatology∙pISSN: 1738-222X eISSN: 2093-8047
See Editorial on Page 258
INTRODUCTION
As the human life span has been extended with the development of medicine, chronic diseases rather than acute ones have been increasing. Because it is hard to cure chronic liver disease completely and it should be controlled well for life, patients and their family members bear various burdens. Liver disease, one of the most representative chronic diseases, has showed a high prevalence rate in the East including South Korea and it includes chronic hepatitis, hepatic cirrhosis and hepatocellular carcinoma (HCC).
Liver disease ranked the eighth among causes of death in South Korea in 2009, and 6,868 died of liver disease for the one year.1 It recorded adds the cause of fifth in males and did third in persons in their 40s. Moreover, the mortality rate of
HCC showed the second highest level by following lung cancer and it did the highest in persons in their 40s and 50s.1
In particular, a study estimating socioeconomic costs of major cause of death in South Korea revealed that the loss of productivity caused by premature death due to chronic liver disease ranked second next to that of cancer.2 The high
mortality of liver disease in economically active persons in their 40s and 50s means that the importance of liver disease management should be recognized by considering that chronic liver disease influences not only individuals or families but also the productivity of a society.3
The cost of illness is one of the most initial economic evaluation methods in the healthcare and it aims to measure the economic burden of illness in a society in terms of the consumption of healthcare resources and the loss of productivity.4 In addition, studies on the cost of illness
Table 1. Categories of liver disease
Types of diseases (ICD-10 codes) Sub-types of diseases (ICD-10 codes)
Viral hepatitis (B15-B19) Acute hepatitis A (B15)
Acute hepatitis B (B16) Other acute viral hepatitis (B17) Chronic viral hepatitis (B18) Unspecified viral hepatitis (B19)
Liver cirrhosis and other liver diseases (K70-K76) Alcoholic liver disease (K70)
Toxic liver disease (K71) Hepatic failure, NEC (K72) Chronic hepatitis, NEC (K73) Fibrosis and cirrhosis of liver (K74) Other inflammatory liver diseases (K75) Other diseases of liver (K76)
Malignant neoplasm of liver (C22) Malignant neoplasm of liver and intrahepatic bile ducts (C22)
a monetary unit which is a universal language of decision- makers and policy-makers. However, their results can provoke a considerable difference by countries, a base year for estimation, types of disease, cost items, formulas for estimation and data for analysis among researchers and can have problem relating to validity or reliability.5,6 Nonetheless,
studies on the cost of illness have been utilized as important indexes to prioritize the economic burdens of specific diseases, to determine the priority of research and development in National Institutes of Health, Institute of Medicine, the national assembly and others.6
Most previous studies on the cost of illness have dealt with major health risks like specific diseases2,7,8 or smoking,9-12 alcohol-drinking13-15 and obesity16-18 and their relevant
diseases. But, even though liver disease exerts not a few negative effect in South Korea with recording a high mortality rate especially in economically active age groups as one of major death causes, there has been nearly no study analyzing the socioeconomic burden of liver disease precisely in the country. Therefore, this study aims to estimate the socioeconomic costs of major liver diseases (viral infection, liver cirrhosis and others and HCC) for the last five years (2004-2008) to provide basic data for the public awareness of the importance of prevention and management of liver disease.
MATERIALS AND METHODS
Materials
Studies on the cost of illness have been described by several researchers since 1960s.6,19-21 Generally, studies on
the cost of illness divide costs into direct, indirect and intangible ones and their viewpoints include a society, governmental institutions, employers, program providers and others. Most studies have measured the cost of illness from a societal perspective to consider its overall change comprehensively.22 This study selected viral hepatitis
(B15-B19), liver cirrhosis and others (K70-K76) and HCC (C22) (Table 1) as representative liver diseases, and estimated their socioeconomic costs in 2004 to 2008 by classifying them into direct and indirect costs.
Direct costs
The direct costs included direct medical costs and direct non-medical costs. The direct medical costs meant the sum of medical costs paid by outpatients and inpatients at medical institutions and at pharmacies to treat the liver disease. The total scale of treatment amount of Korean patients with liver disease can be investigated with health insurance data for items covered by the insurance at medical institutions and pharmacies. As the whole nation has been mandatorily insured through the national health insurance and a single system of health insurance claim data has been established in South Korea, various studies on cost of illness be conducted easily without an additional survey.23,24 This
study estimated the medical costs for items covered by the insurance by calculating the treatment amount of liver disease for inpatients and outpatients at medical institutions and at pharmacies by gender, age and year based on the National Health Insurance Statistical Yearbook (Appendix 1).25
payments was 15.2%26 in 2008, the exclusion of uninsured items underestimates the direct medical costs eventually not to reflect a socioeconomic loss related with liver disease. Therefore, for uninsured items, the medical costs among direct medical costs were estimated by applying the copayment rate of non-benefit (Appendix 2) for the total treatment amount for inpatients and outpatients at medical institutions and at pharmacies to the total treatment amount of liver disease by gender, age and year.26
The direct non-medical costs meant incidental expenses for the use of medical institutions or pharmacies, traffic costs for visits to clinics and costs of caregivers for inpatients. As the length of hospitalization and visiting days for medical service can be investigated as a whole, health insurance data are the most objective and comprehensive data to calculate direct non-medical costs. The traffic costs were estimated by multiplying the number of visit days of liver disease patients by gender and age by an average round-trip traffic cost per one visit. At this time, the number of visit days by gender and age was gained from the National Health Insurance Statistical Yearbook25 (Appendix 3) and the average round-trip traffic cost was calculated to be KRW 1,191, KRW 1,251, KRW 1,309, KRW 1,356 and KRW 1,475 in 2005 to 2008, respectively by applying the consumer price index of traffic costs27 to the average round-trip traffic cost per one visit to an outpatient clinic (KRW 1,475) in 2008 Korean Health Panel Survey.28 In addition, costs of caregivers were regarded as personnel expenses of caregivers and opportunity costs of guardians of inpatients. The number of hospitalization days due to liver disease by gender and age was obtained from the National Health Insurance Statistical Yearbook25 (Appendix 3) and the daily
average personnel expenses of caregivers (KRW 60,000) suggested by Korean caregiver societies was input as the personnel expenses of caregivers or the opportunity costs of guardians. The costs of caregivers of the patients were estimated by multiplying the personnel expenses by the number of hospitalization days.
Indirect costs
Indirect costs included lost earnings due to premature death caused by liver disease and loss of productivity following absences from work to visit medical institutions. The lost earnings due to premature death was estimated by
multiplying the human loss per person by the number of deaths due to liver disease by gender and age and the period from the year after death to the average life expectancy by gender and age. The number of deaths due to liver disease was secured from Annual Report on the Cause of Death Statistics (Appendix 4) published annually by Statistics Korea. The human loss per person was calculated with the probability of survival, employment rate, average annual income and wage growth rate by gender and age in each year from the year after death to the average life expectancy (Appendix 5). Therefore, the lost earnings due to premature death was estimated with the number of deaths by gender and age from Annual Report on the Cause of Death Statistics,29 the average life expectancy and the survival rate
by gender and age from Life Table,30 the employment rate by gender and age from Annual Report on the Economically Active Population Survey,31 the average annual real wage by gender and age from Basic Survey on Wage Structure32 and
the real wage growth rate of industry by gender and age from Survey Report on the Wages and Working Hours at Establishments.33 At this time, this study applied a discount rate to convert future costs after premature death into the present values in each year and it reflected an individual time preference or an interest rate. The future costs were changed into the present values by dividing them by 5% discount rate.
The loss of productivity following absences from work to visit medical institutions to treat liver disease was calculated by gaining the numbers of hospitalization days and visit days due to liver disease by gender, age and year from the National Health Insurance Statistical Yearbook25 (Appendix 3) and by multiplying the numbers by the average daily income by gender, age and year from Basic Survey on Wage Structure.32 Cost items for estimation,
major indexes to calculate each cost item and sources of indexes are summarized in Table 2.
Methods
Direct costs (DC) consisted of direct medical costs such as expenses of insured and uninsured items for inpatients and outpatients at medical institutions and at pharmacies to treat liver disease and direct non-medical costs like traffic costs to visit medical institutions and costs of caregivers for inpatients. Therefore, as shown in the following formulas for
Table 2. Categories related to liver disease and data sources Types
of costs Categories Estimation variables Data sources
Direct costs
Direct medical costs
Benefit sector* Treatment amount of hospitalization,
outpatient and pharmacy
National health insurance statistical yearbook,25
Survey on the benefit coverage rate of national
health insurance26
Non benefit sector
Treatment amount and non-benefit rate of hospitalization, outpatient and pharmacy
Direct non-medical costs
Transportation Outpatient visit day, Round-trip transportation cost
National health insurance statistical yearbook,25
Report of Korea health panel survey28
Care-giver Hospitalization day, Average daily
care-giver cost Indirect
costs
Future income loss due to premature death
Number of death, Survival rate, Employment rate, Average annual real wage, Growth rate of real wage, Discount rate
Annual report on the cause of death statistics,29 Life
tables for Korea,30 Annual report on the
economically active population survey,31 Basic
survey on wage structure,32 Survey report on
the wages and working hours at establishments33
Productivity loss resulting from absence from work
Hospitalization day, Outpatient visit day, Employment rate, Average daily wage
National health insurance statistical yearbook,25
Annual report on the economically active population
survey,31 Basic survey on wage structure32
*It is composed costs burdened by insurer and by beneficiary.
estimation, the direct medical costs were estimated by summing the total treatment amount of inpatients (IP) and outpatients (OP) and at pharmacies (P) based on the health insurance data by gender, age and disease (Appendix 1) and the value of multiplying the total treatment amount by the rate of uninsured out-of pocket payments to the total treatment amount of each group (α, β, γ) (Appendix 2). In addition, the traffic costs were obtained by multiplying the number of visit days (OV) by gender, age and disease (Appendix 3) by the average round-trip traffic costs per one visit to outpatient clinic (MT), and the costs of caregivers were done by multiplying the number of hospitalization days by gender, age and disease (IV) (Appendix 3) by the daily average personnel expenses of caregivers (MC).
×
× DC = direct costsi = 1, 2, …, n disease, j = 1, 2 gender, k = 0, 1, …, n age IPijk = total treatment amount of inpatients of i, j
and k in health insurance data
OPijk = total treatment amount of outpatients of i, j
and k in health insurance data
Pijk = total treatment amount at pharmacies of i,
j and k in health insurance data
α = rate of uninsured out-of pocket payments to total treatment amount of inpatients
β = rate of uninsured out-of pocket payments to total treatment amount of outpatients
γ = rate of uninsured out-of pocket payments to total treatment amount at pharmacies
OVijk = number of visit days of i, j and k
MTj = average round-trip traffic costs per one visit
to an outpatient clinic of j
IVijk = number of hospitalization days of i, j and k, MC =
daily average costs of caregivers
Indirect costs included the lost earnings due to premature death by liver disease and the loss of productivity following absences from work to visit medical institutions. The lost earnings due to premature death could be determined by how to measure the human value and methods for the measurement were gross loss of output or human capital approach and net loss of output approach. The former
converts the total labor income of premature deaths into the present value and the latter deducts future consumption from the estimate of the former.
Future income of premature deaths was estimated by applying the most common gross loss of output or human capital approach.34 So, the lost earnings of premature
deaths due to liver disease were calculated by multiplying the human loss by gender and age (Appendix 5) obtained with the survival rate by gender and age (S), the employment rate (E), the yearly average real wage (YW), the real wage growth rate (WR) and the discount rate (r) by the number of deaths due to liver disease by gender, age and disease (D) (Appendix 4).
× × × × ×
HCC = lost earnings due to premature death
i = 1, 2, …, n disease, j = 1, 2 gender, k = 0, 1, …, n age, τ
= years
Di,j,k = number of deaths of i, j and k
= probability of survival of a person with j and k in k+τ
= employment rate of a person with j and k in k+τ
= yearly average real wage of a person with j
and k in k+τ
= real wage growth rate in k+τ, r = discount rate
The loss of productivity following absences from work to visit medical institutions to treat liver disease (PLC) was estimated by multiplying the sum of the number of hospitalization days by gender, age and disease (IV) and a third of the number of visit days (OV) (Appendix 3) by the employment rate by gender and age (E) and the daily average wage by gender and age (DW). At this time, to revise the difference in the loss of productivity between outpatients and inpatients, the rate of physician productivity for outpatients to that for inpatients suggested by Noh et al14 and Jung and Ko2 was applied. The number of non
productive days was calculated by adding one third of the number of visit days to the number of hospitalization days.
××
PLC = loss of productivity following sick leave i = 1, 2, …, n disease, j = 1, 2 gender, k = 0, 1, …, n age IVijk = number of hospitalization days of i, j and k
OVijk = number of visit days of i, j and k
Ejk = employment rate of j and k
DWjk = daily average wage of j and k
RESULTS
Direct costs
The medical costs of inpatients and outpatients at medical institutions and at pharmacies to treat liver disease or the sum of benefits paid by the insurer, legal out-of pocket payments and uninsured out-of pocket payments, increased 1.8 times from KRW 588.7 billion in 2004 to KRW 1,032.2 billion in 2008. For the costs by gender, those of males became 1.7 times from KRW 417.5 billion to KRW 724.3 billion and those of females did 1.8 times from KRW 171.2 billion to KRW 307.9 billion, respectively for the same period. The medical costs of males and females accounted for 70.2% and 29.8% of the total costs, respectively in 2008 and the rate of males was 2.4 times higher than that of females. The rate of medical costs by age recorded the highest level or 27.0-28.7% in the patients in their 50s, and those in their 40s (21.3-23.5%), 60s (21.1-22.0%), 30s (10.7-11.0%) and 70s (8.4-9.5%) (Table 3).
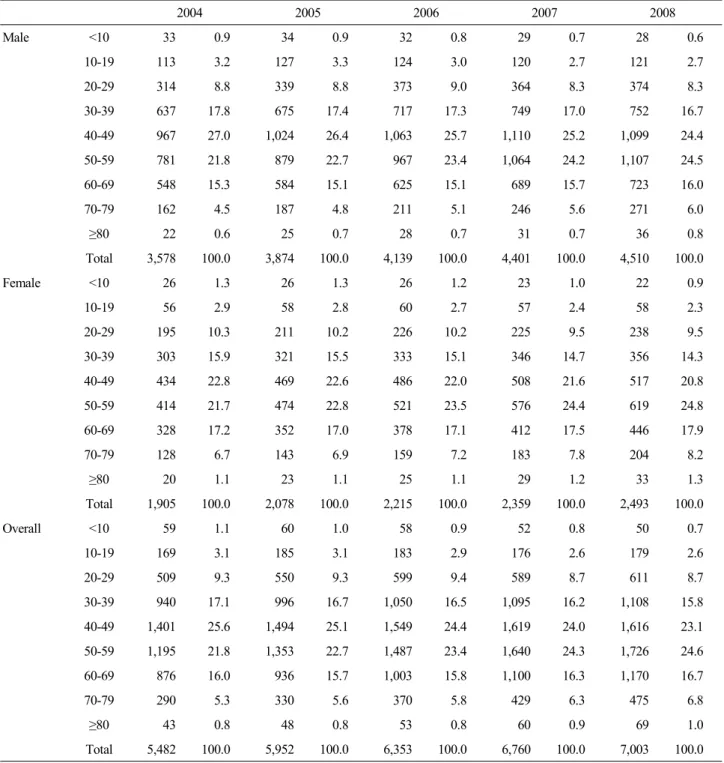
Traffic costs went up 1.3 times from KRW 5.5 billion in 2004 to KRW 7 billion in 2008. The traffic costs of males increased 1.3 times from 3.6 to KRW 4.5 billion and those of females did from KRW 1.9 billion to KRW 2.5 billion, respectively for the same period. The rate of traffic costs was found to be 1.8 times higher in males than in female by recording 64.4% and 35.6%, respectively in 2008. The traffic costs by age accounted for the largest portion or 23.1-25.6% in liver disease patients in their 40s, and those in their 50s (21.8-24.6%), 30s (15.8-17.1%), 60s (15.7-16.7%) and 20s (8.7-9.4%) (Table 4).
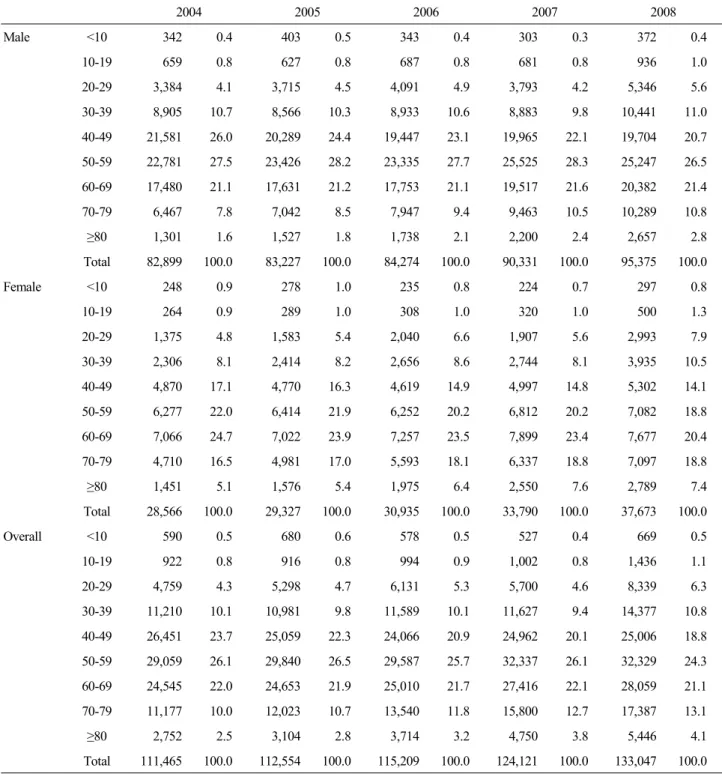
The personnel expenses of paid caregivers or the opportunity costs of guardians to care inpatients with liver disease increased 1.2 times from KRW 111.5 billion in 2004 to KRW 133 billion in 2008. The costs of males became higher 1.2 times from KRW 82.9 billion to KRW 95.4 billion and those of females did 1.3 times from KRW 28.6 billion to KRW 37.7 billion, respectively. In addition, the rates of
Table 3. Direct medical costs related to liver disease (units: KRW 1,000,000, %) 2004 2005 2006 2007 2008 Male <10 1,830 0.4 2,115 0.5 2,018 0.4 2,102 0.3 2,404 0.3 10-19 5,111 1.2 5,548 1.2 5,519 1.1 6,004 0.9 6,509 0.9 20-29 18,793 4.5 21,924 4.7 24,934 4.8 28,882 4.5 34,844 4.8 30-39 45,585 10.9 50,670 10.9 57,449 11.1 71,029 11.1 81,248 11.2 40-49 106,053 25.4 114,954 24.7 125,232 24.1 150,287 23.4 165,158 22.8 50-59 116,747 28.0 132,826 28.5 152,168 29.3 191,676 29.9 213,519 29.5 60-69 88,944 21.3 97,310 20.9 106,325 20.5 131,657 20.5 150,574 20.8 70-79 29,417 7.1 34,788 7.5 39,491 7.6 50,954 8.0 59,697 8.2 ≥80 5,027 1.2 5,862 1.3 6,616 1.3 8,528 1.3 10,323 1.4 Total 417,507 100.0 465,996 100.0 519,751 100.0 641,117 100.0 724,276 100.0 Female <10 1,408 0.8 1,480 0.8 1,381 0.7 1,567 0.6 1,828 0.6 10-19 2,429 1.4 2,560 1.4 2,770 1.3 2,971 1.1 3,697 1.2 20-29 10,337 6.0 12,062 6.4 14,363 6.8 16,209 6.1 20,141 6.5 30-39 17,502 10.2 19,902 10.5 21,594 10.2 26,630 10.0 32,187 10.5 40-49 32,148 18.8 35,605 18.8 39,874 18.8 48,513 18.3 54,439 17.7 50-59 42,147 24.6 46,485 24.5 52,795 24.9 68,222 25.7 79,026 25.7 60-69 40,348 23.6 43,799 23.1 48,180 22.7 60,805 22.9 68,949 22.4 70-79 20,207 11.8 22,729 12.0 25,425 12.0 32,237 12.2 38,227 12.4 ≥80 4,666 2.7 5,205 2.7 5,852 2.8 8,017 3.0 9,444 3.1 Total 171,193 100.0 189,828 100.0 212,232 100.0 265,171 100.0 307,939 100.0 Overall <10 3,238 0.6 3,595 0.6 3,400 0.5 3,669 0.4 4,232 0.4 10-19 7,541 1.3 8,108 1.2 8,289 1.1 8,974 1.0 10,206 1.0 20-29 29,130 5.0 33,985 5.2 39,296 5.4 45,091 5.0 54,985 5.3 30-39 63,087 10.7 70,573 10.8 79,043 10.8 97,659 10.8 113,435 11.0 40-49 138,201 23.5 150,559 23.0 165,106 22.6 198,800 21.9 219,598 21.3 50-59 158,894 27.0 179,311 27.3 204,962 28.0 259,898 28.7 292,544 28.3 60-69 129,291 22.0 141,109 21.5 154,505 21.1 192,462 21.2 219,524 21.3 70-79 49,624 8.4 57,517 8.8 64,916 8.9 83,190 9.2 97,924 9.5 ≥80 9,693 1.7 11,067 1.7 12,467 1.7 16,545 1.8 19,767 1.9 Total 588,700 100.0 655,824 100.0 731,984 100.0 906,288 100.0 1,032,215 100.0
costs of caregivers in male patients recorded 71.7% and 28.3%, respectively in 2008 and the rate of males was 2.5 times higher than that of females. The rate of costs of caregivers by age showed the highest level or 24.3-26.5% in the patients in their 50s, and those in their 60s (21.1-22.1%), 40s (18.8- 23.7%), 70s (10.0-13.1%) and 30s (9.4-10.8%) (Table 5).
Indirect costs
Indirect costs included the lost earnings due to premature
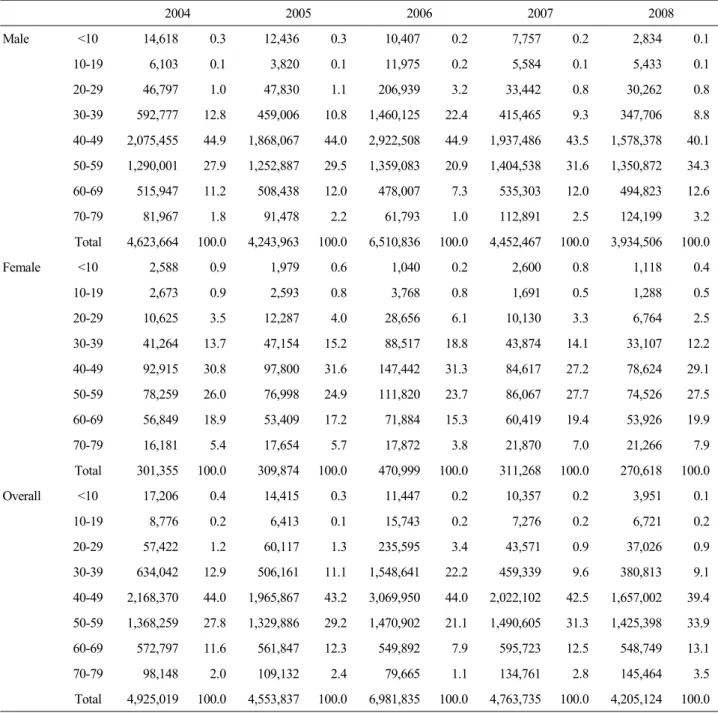
death caused by liver disease and the loss of productivity following absences from work. The lost earnings due to premature death reduced from KRW 4,925 billion in 2004 to KRW 4,205.1 billion in 2008 by 14.6% and the lost earnings of males declined from KRW 4,623.7 billion to KRW 3,934.5 billion by 14.9% and those of females did from KRW 301.4 billion to KRW 270.6 billion by 10.2%, respectively. The rates of lost earnings in males and females with liver disease were 93.6% and 6.4%, respectively in 2008, so the rate of males was 14.5 times higher than that of
Table 4. Transportation costs related to liver disease (units: KRW 1,000,000, %) 2004 2005 2006 2007 2008 Male <10 33 0.9 34 0.9 32 0.8 29 0.7 28 0.6 10-19 113 3.2 127 3.3 124 3.0 120 2.7 121 2.7 20-29 314 8.8 339 8.8 373 9.0 364 8.3 374 8.3 30-39 637 17.8 675 17.4 717 17.3 749 17.0 752 16.7 40-49 967 27.0 1,024 26.4 1,063 25.7 1,110 25.2 1,099 24.4 50-59 781 21.8 879 22.7 967 23.4 1,064 24.2 1,107 24.5 60-69 548 15.3 584 15.1 625 15.1 689 15.7 723 16.0 70-79 162 4.5 187 4.8 211 5.1 246 5.6 271 6.0 ≥80 22 0.6 25 0.7 28 0.7 31 0.7 36 0.8 Total 3,578 100.0 3,874 100.0 4,139 100.0 4,401 100.0 4,510 100.0 Female <10 26 1.3 26 1.3 26 1.2 23 1.0 22 0.9 10-19 56 2.9 58 2.8 60 2.7 57 2.4 58 2.3 20-29 195 10.3 211 10.2 226 10.2 225 9.5 238 9.5 30-39 303 15.9 321 15.5 333 15.1 346 14.7 356 14.3 40-49 434 22.8 469 22.6 486 22.0 508 21.6 517 20.8 50-59 414 21.7 474 22.8 521 23.5 576 24.4 619 24.8 60-69 328 17.2 352 17.0 378 17.1 412 17.5 446 17.9 70-79 128 6.7 143 6.9 159 7.2 183 7.8 204 8.2 ≥80 20 1.1 23 1.1 25 1.1 29 1.2 33 1.3 Total 1,905 100.0 2,078 100.0 2,215 100.0 2,359 100.0 2,493 100.0 Overall <10 59 1.1 60 1.0 58 0.9 52 0.8 50 0.7 10-19 169 3.1 185 3.1 183 2.9 176 2.6 179 2.6 20-29 509 9.3 550 9.3 599 9.4 589 8.7 611 8.7 30-39 940 17.1 996 16.7 1,050 16.5 1,095 16.2 1,108 15.8 40-49 1,401 25.6 1,494 25.1 1,549 24.4 1,619 24.0 1,616 23.1 50-59 1,195 21.8 1,353 22.7 1,487 23.4 1,640 24.3 1,726 24.6 60-69 876 16.0 936 15.7 1,003 15.8 1,100 16.3 1,170 16.7 70-79 290 5.3 330 5.6 370 5.8 429 6.3 475 6.8 ≥80 43 0.8 48 0.8 53 0.8 60 0.9 69 1.0 Total 5,482 100.0 5,952 100.0 6,353 100.0 6,760 100.0 7,003 100.0
females. The rate by age recorded the highest level or 39.4-44.0% in liver disease patients in their 40s, and those in their 50s (21.1-33.9%), 30s (9.1-22.2%), 60s (7.9-13.1%) and 70s (1.1-3.5%). This showed the premature deaths in economically active age groups provoked a significant social loss of productivity (Table 6).
The scale of loss of productivity following absences from work to treat liver disease went up 1.4 times from KRW 227.3 billion in 2004 to KRW 311.2 billion in 2008 and the
scale of males was raised 1.3 times from KRW 183.8 billion to KRW 247.6 billion and those of females was 1.5 times from KRW 43.5 billion to KRW 63.6 billion, respectively for the same period. The rates of loss of productivity in males and females accounted for 79.6% and 20.4%, respectively in 2008 and that of males was found to be 3.9 times higher than that of females. The loss of productivity by age recorded the highest level or 27.0-32.1% in liver disease patients in their 40s, and those in their 50s (26.7-30.0%), 60s
Table 5. Caregiver costs related to liver disease (units: KRW 1,000,000, %) 2004 2005 2006 2007 2008 Male <10 342 0.4 403 0.5 343 0.4 303 0.3 372 0.4 10-19 659 0.8 627 0.8 687 0.8 681 0.8 936 1.0 20-29 3,384 4.1 3,715 4.5 4,091 4.9 3,793 4.2 5,346 5.6 30-39 8,905 10.7 8,566 10.3 8,933 10.6 8,883 9.8 10,441 11.0 40-49 21,581 26.0 20,289 24.4 19,447 23.1 19,965 22.1 19,704 20.7 50-59 22,781 27.5 23,426 28.2 23,335 27.7 25,525 28.3 25,247 26.5 60-69 17,480 21.1 17,631 21.2 17,753 21.1 19,517 21.6 20,382 21.4 70-79 6,467 7.8 7,042 8.5 7,947 9.4 9,463 10.5 10,289 10.8 ≥80 1,301 1.6 1,527 1.8 1,738 2.1 2,200 2.4 2,657 2.8 Total 82,899 100.0 83,227 100.0 84,274 100.0 90,331 100.0 95,375 100.0 Female <10 248 0.9 278 1.0 235 0.8 224 0.7 297 0.8 10-19 264 0.9 289 1.0 308 1.0 320 1.0 500 1.3 20-29 1,375 4.8 1,583 5.4 2,040 6.6 1,907 5.6 2,993 7.9 30-39 2,306 8.1 2,414 8.2 2,656 8.6 2,744 8.1 3,935 10.5 40-49 4,870 17.1 4,770 16.3 4,619 14.9 4,997 14.8 5,302 14.1 50-59 6,277 22.0 6,414 21.9 6,252 20.2 6,812 20.2 7,082 18.8 60-69 7,066 24.7 7,022 23.9 7,257 23.5 7,899 23.4 7,677 20.4 70-79 4,710 16.5 4,981 17.0 5,593 18.1 6,337 18.8 7,097 18.8 ≥80 1,451 5.1 1,576 5.4 1,975 6.4 2,550 7.6 2,789 7.4 Total 28,566 100.0 29,327 100.0 30,935 100.0 33,790 100.0 37,673 100.0 Overall <10 590 0.5 680 0.6 578 0.5 527 0.4 669 0.5 10-19 922 0.8 916 0.8 994 0.9 1,002 0.8 1,436 1.1 20-29 4,759 4.3 5,298 4.7 6,131 5.3 5,700 4.6 8,339 6.3 30-39 11,210 10.1 10,981 9.8 11,589 10.1 11,627 9.4 14,377 10.8 40-49 26,451 23.7 25,059 22.3 24,066 20.9 24,962 20.1 25,006 18.8 50-59 29,059 26.1 29,840 26.5 29,587 25.7 32,337 26.1 32,329 24.3 60-69 24,545 22.0 24,653 21.9 25,010 21.7 27,416 22.1 28,059 21.1 70-79 11,177 10.0 12,023 10.7 13,540 11.8 15,800 12.7 17,387 13.1 ≥80 2,752 2.5 3,104 2.8 3,714 3.2 4,750 3.8 5,446 4.1 Total 111,465 100.0 112,554 100.0 115,209 100.0 124,121 100.0 133,047 100.0 (14.1-15.2%), 30s (13.9-15.4%) and 70s (5.7-7.9%) (Table 7). Overall costs
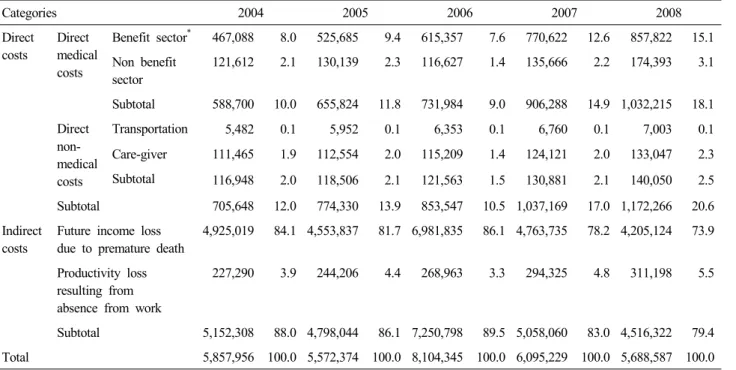
When all socioeconomic costs of liver disease for the last five years were put together, they recorded KRW 5,858 billion, KRW 5,572.4 billion, KRW 8,104.3 billion, KRW 6,095.2 billion and KRW 5,688.6 billion in 2004 to 2008, respectively. According to cost items, the lost earnings
caused by liver disease-related premature death accounted for the largest portion of the total socioeconomic costs or 73.9-86.1%, and the rates of direct medical costs, the loss of productivity following sick leave and direct non-medical costs such as traffic costs and costs of caregivers were 9.0-18.1%, 3.3- 5.5% and 1.5-2.5%, respectively. In particular, the rate of lost earnings out of the total socioeconomic costs slightly decreased from 2004 to 2008 but
Table 6. Future income loss due to premature death related to liver disease (units: KRW 1,000,000, %) 2004 2005 2006 2007 2008 Male <10 14,618 0.3 12,436 0.3 10,407 0.2 7,757 0.2 2,834 0.1 10-19 6,103 0.1 3,820 0.1 11,975 0.2 5,584 0.1 5,433 0.1 20-29 46,797 1.0 47,830 1.1 206,939 3.2 33,442 0.8 30,262 0.8 30-39 592,777 12.8 459,006 10.8 1,460,125 22.4 415,465 9.3 347,706 8.8 40-49 2,075,455 44.9 1,868,067 44.0 2,922,508 44.9 1,937,486 43.5 1,578,378 40.1 50-59 1,290,001 27.9 1,252,887 29.5 1,359,083 20.9 1,404,538 31.6 1,350,872 34.3 60-69 515,947 11.2 508,438 12.0 478,007 7.3 535,303 12.0 494,823 12.6 70-79 81,967 1.8 91,478 2.2 61,793 1.0 112,891 2.5 124,199 3.2 Total 4,623,664 100.0 4,243,963 100.0 6,510,836 100.0 4,452,467 100.0 3,934,506 100.0 Female <10 2,588 0.9 1,979 0.6 1,040 0.2 2,600 0.8 1,118 0.4 10-19 2,673 0.9 2,593 0.8 3,768 0.8 1,691 0.5 1,288 0.5 20-29 10,625 3.5 12,287 4.0 28,656 6.1 10,130 3.3 6,764 2.5 30-39 41,264 13.7 47,154 15.2 88,517 18.8 43,874 14.1 33,107 12.2 40-49 92,915 30.8 97,800 31.6 147,442 31.3 84,617 27.2 78,624 29.1 50-59 78,259 26.0 76,998 24.9 111,820 23.7 86,067 27.7 74,526 27.5 60-69 56,849 18.9 53,409 17.2 71,884 15.3 60,419 19.4 53,926 19.9 70-79 16,181 5.4 17,654 5.7 17,872 3.8 21,870 7.0 21,266 7.9 Total 301,355 100.0 309,874 100.0 470,999 100.0 311,268 100.0 270,618 100.0 Overall <10 17,206 0.4 14,415 0.3 11,447 0.2 10,357 0.2 3,951 0.1 10-19 8,776 0.2 6,413 0.1 15,743 0.2 7,276 0.2 6,721 0.2 20-29 57,422 1.2 60,117 1.3 235,595 3.4 43,571 0.9 37,026 0.9 30-39 634,042 12.9 506,161 11.1 1,548,641 22.2 459,339 9.6 380,813 9.1 40-49 2,168,370 44.0 1,965,867 43.2 3,069,950 44.0 2,022,102 42.5 1,657,002 39.4 50-59 1,368,259 27.8 1,329,886 29.2 1,470,902 21.1 1,490,605 31.3 1,425,398 33.9 60-69 572,797 11.6 561,847 12.3 549,892 7.9 595,723 12.5 548,749 13.1 70-79 98,148 2.0 109,132 2.4 79,665 1.1 134,761 2.8 145,464 3.5 Total 4,925,019 100.0 4,553,837 100.0 6,981,835 100.0 4,763,735 100.0 4,205,124 100.0
the rate of direct medical costs or costs paid by health insurance sharply increased (Table 8).
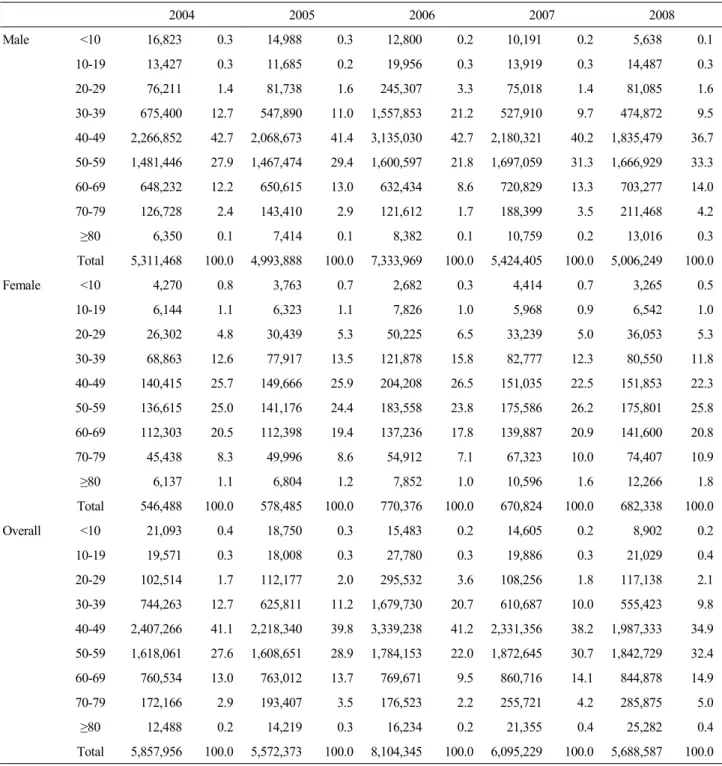
Analysis on the socioeconomic costs of liver disease by gender and age revealed that 88.0-90.7% of the total costs were incurred in males, and the rate of patients with liver disease in their 40s showed the highest (34.9-41.2%) and the rates of those in their 50s and 30s followed it by recording 22.0-32.4% and 9.8-20.7%, respectively. The costs of males were higher in those in their 40s (36.7-42.7%), 50s (21.8- 33.3%) and 30s (9.5-21.2%) in the order and those of females were higher in those in their 50s (23.8-26.2%), 40s
(22.3-26.5%) and 60s (17.8-20.9%) in the order (Table 9).
DISCUSSION
Liver disease is one of major death causes in South Korea and the number of deaths caused by it tends to be high in economically active age groups as a representative disease provoking a significant loss of productivity due to premature death. In 2001, liver disease ranked fifth among death causes in South Korea but its loss of productivity due to premature death was found to be the highest except cancer which is the
Table 7. Productivity loss resulting from absence from work related to liver disease (units: KRW 1,000,000, %) 2004 2005 2006 2007 2008 Male 10-19 1,441 0.8 1,563 0.8 1,651 0.8 1,530 0.7 1,488 0.6 20-29 6,923 3.8 7,930 4.0 8,970 4.2 8,537 3.6 10,259 4.1 30-39 27,496 15.0 28,973 14.7 30,629 14.3 31,784 13.5 34,725 14.0 40-49 62,796 34.2 64,339 32.7 66,780 31.1 71,473 30.3 71,140 28.7 50-59 51,136 27.8 57,456 29.2 65,044 30.3 74,256 31.5 76,184 30.8 60-69 25,313 13.8 26,652 13.5 29,724 13.8 33,663 14.3 36,775 14.9 70-79 8,715 4.7 9,915 5.0 12,170 5.7 14,845 6.3 17,012 6.9 Total 183,820 100.0 196,828 100.0 214,969 100.0 236,089 100.0 247,582 100.0 Female 10-19 722 1.7 823 1.7 920 1.7 929 1.6 999 1.6 20-29 3,770 8.7 4,296 9.1 4,940 9.2 4,768 8.2 5,917 9.3 30-39 7,488 17.2 8,126 17.2 8,778 16.3 9,183 15.8 10,965 17.2 40-49 10,048 23.1 11,022 23.3 11,787 21.8 12,400 21.3 12,971 20.4 50-59 9,518 21.9 10,805 22.8 12,170 22.5 13,909 23.9 14,548 22.9 60-69 7,712 17.7 7,816 16.5 9,537 17.7 10,352 17.8 10,602 16.7 70-79 4,212 9.7 4,489 9.5 5,863 10.9 6,696 11.5 7,613 12.0 Total 43,469 100.0 47,378 100.0 53,995 100.0 58,236 100.0 63,615 100.0 Overall 10-19 2,163 1.0 2,386 1.0 2,571 1.0 2,458 0.8 2,487 0.8 20-29 10,694 4.7 12,227 5.0 13,911 5.2 13,305 4.5 16,177 5.2 30-39 34,984 15.4 37,100 15.2 39,407 14.7 40,967 13.9 45,690 14.7 40-49 72,843 32.1 75,361 30.9 78,567 29.2 83,873 28.5 84,111 27.0 50-59 60,654 26.7 68,261 28.0 77,215 28.7 88,165 30.0 90,732 29.2 60-69 33,025 14.5 34,467 14.1 39,261 14.6 44,015 15.0 47,376 15.2 70-79 12,927 5.7 14,405 5.9 18,032 6.7 21,541 7.3 24,625 7.9 Total 227,290 100.0 244,206 100.0 268,963 100.0 294,325 100.0 311,198 100.0
number one death cause. Although liver disease leads to a considerable socioeconomic loss in the country like this, basic studies to establish liver disease-related health insurance policies are insufficient. Therefore, this study was conducted to provide basic data for policy making for the prevention and the management of liver disease in the future by estimating the socioeconomic costs of major liver diseases for the last five years from a societal perspective.
Liver diseases analyzed in this study were viral hepatitis (B15-B19), liver cirrhosis and other liver disease (K70-K76) and HCC (C22) and the costs of them were estimated by dividing them largely into direct and indirect costs. The directs costs contained the treatment amount covered and not covered by health insurance for inpatients and outpatients at medical institutions and at pharmacies, the traffic costs to
visit medical institutions and the personnel expenses of caregivers or the opportunity costs of guardians for inpatients. The indirect costs did the lost earnings caused by liver disease-related premature death and the loss of productivity following absences from work to visit medical institutions.
According to the results, the socioeconomic costs of liver disease were estimated to be KRW 5,858 billion, KRW 5,572.4 billion, KRW 8,104.3 billion, KRW 6,095.2 billion and KRW 5,688.6 billion from 2004 to 2008, respectively. By the cost items, the lost earnings caused by liver disease-related premature death accounted for the largest portion of the total costs or 73.9-86.1%, and the direct medical costs (9.0-18.1%), the loss of productivity following sick leave (3.3-5.5%) and the traffic costs and the costs of caregivers (1.5-2.5%) followed it in the order.
Table 8. Socioeconomic costs of liver disease (units: KRW 1,000,000, %) Categories 2004 2005 2006 2007 2008 Direct costs Direct medical costs Benefit sector* 467,088 8.0 525,685 9.4 615,357 7.6 770,622 12.6 857,822 15.1 Non benefit sector 121,612 2.1 130,139 2.3 116,627 1.4 135,666 2.2 174,393 3.1 Subtotal 588,700 10.0 655,824 11.8 731,984 9.0 906,288 14.9 1,032,215 18.1 Direct non-medical costs Transportation 5,482 0.1 5,952 0.1 6,353 0.1 6,760 0.1 7,003 0.1 Care-giver 111,465 1.9 112,554 2.0 115,209 1.4 124,121 2.0 133,047 2.3 Subtotal 116,948 2.0 118,506 2.1 121,563 1.5 130,881 2.1 140,050 2.5 Subtotal 705,648 12.0 774,330 13.9 853,547 10.5 1,037,169 17.0 1,172,266 20.6 Indirect costs
Future income loss due to premature death
4,925,019 84.1 4,553,837 81.7 6,981,835 86.1 4,763,735 78.2 4,205,124 73.9
Productivity loss resulting from absence from work
227,290 3.9 244,206 4.4 268,963 3.3 294,325 4.8 311,198 5.5
Subtotal 5,152,308 88.0 4,798,044 86.1 7,250,798 89.5 5,058,060 83.0 4,516,322 79.4
Total 5,857,956 100.0 5,572,374 100.0 8,104,345 100.0 6,095,229 100.0 5,688,587 100.0
*It is composed costs burdened by insurer and by beneficiary.
Out of the total socioeconomic costs of liver disease, 88.0-90.7% were incurred in males, and the costs by age showed higher rate in the patients in their 40s (34.9-41.2%), 50s (22.0-32.4%) and 30s (9.8-20.7%) in the order.
A study of Jung and Ko2 estimated the socioeconomic
costs of the top five diseases for death causes in South Korea by classifying the costs into direct and indirect costs. In their study, the direct costs included medical expenditures, traffic costs and costs of guardians and the indirect costs did costs of lost workdays due to illness and lost earnings due to premature death. They reported that the costs of cancer (malignant neoplasm) or number one death cause, cerebrova-scular disease, heart disease, diabetes and liver disease were KRW 7,735.8 billion, KRW 2,313.8 billion, KRW 2,141.7 billion, KRW 1,158.8 billion and KRW 2,620.1 billion, respectively. For liver disease, the lost earnings due to premature death accounted for 88.3% of the total costs and rates of the medical expenditures of inpatients and outpatients, the costs of lost workdays, the costs of caregivers and the traffic costs recorded 7.7%, 2.4%, 1.1% and 0.5%, respectively.
In the comparison of the results between their study and this one, the study of Jung and Ko2 showed that the socioeconomic
costs of liver disease were estimated to be KRW 2,620.1 billion in 2001 while this study found that the costs were
done to be KRW 5,858 billion in 2004, so the difference in the costs was significant. That is considered to result from not only the difference in the year of estimation and the methodologies but also the exclusion of the costs at pharmacies, which accounted for a considerable portion in the total costs, in the study of Jung and Ko.2 But, the finding that the rate of lost earnings due to premature death recorded the highest level among the socioeconomic costs of liver disease and the lost earnings by age showed the highest rates in economically active persons in their 30s, 40s and 50s, tended to be similar in both of the two studies and it led to a large influence on the loss of productivity in the society at large.
In addition, studies estimating the socioeconomic costs of disease have been reported continuously in Canada since 1986. A study calculating the socioeconomic costs by classifying total disease into 20 groups such as cardiovascular disease, musculoskeletal disease and cancer with the data in 1998 was published.34 The study in Canada34 largely divided the
costs of diseases into direct and indirect costs, and the direct costs included treatment amount at medical institutions, drug expenditures and doctor bills and the indirect costs contained death costs and costs of prevalence of short- and long-term disorder. According to its results, although it did not examine liver disease specifically, the direct and indirect
Table 9. Socioeconomic costs of liver disease stratified according to sex and age group (units: KRW 1,000,000, %) 2004 2005 2006 2007 2008 Male <10 16,823 0.3 14,988 0.3 12,800 0.2 10,191 0.2 5,638 0.1 10-19 13,427 0.3 11,685 0.2 19,956 0.3 13,919 0.3 14,487 0.3 20-29 76,211 1.4 81,738 1.6 245,307 3.3 75,018 1.4 81,085 1.6 30-39 675,400 12.7 547,890 11.0 1,557,853 21.2 527,910 9.7 474,872 9.5 40-49 2,266,852 42.7 2,068,673 41.4 3,135,030 42.7 2,180,321 40.2 1,835,479 36.7 50-59 1,481,446 27.9 1,467,474 29.4 1,600,597 21.8 1,697,059 31.3 1,666,929 33.3 60-69 648,232 12.2 650,615 13.0 632,434 8.6 720,829 13.3 703,277 14.0 70-79 126,728 2.4 143,410 2.9 121,612 1.7 188,399 3.5 211,468 4.2 ≥80 6,350 0.1 7,414 0.1 8,382 0.1 10,759 0.2 13,016 0.3 Total 5,311,468 100.0 4,993,888 100.0 7,333,969 100.0 5,424,405 100.0 5,006,249 100.0 Female <10 4,270 0.8 3,763 0.7 2,682 0.3 4,414 0.7 3,265 0.5 10-19 6,144 1.1 6,323 1.1 7,826 1.0 5,968 0.9 6,542 1.0 20-29 26,302 4.8 30,439 5.3 50,225 6.5 33,239 5.0 36,053 5.3 30-39 68,863 12.6 77,917 13.5 121,878 15.8 82,777 12.3 80,550 11.8 40-49 140,415 25.7 149,666 25.9 204,208 26.5 151,035 22.5 151,853 22.3 50-59 136,615 25.0 141,176 24.4 183,558 23.8 175,586 26.2 175,801 25.8 60-69 112,303 20.5 112,398 19.4 137,236 17.8 139,887 20.9 141,600 20.8 70-79 45,438 8.3 49,996 8.6 54,912 7.1 67,323 10.0 74,407 10.9 ≥80 6,137 1.1 6,804 1.2 7,852 1.0 10,596 1.6 12,266 1.8 Total 546,488 100.0 578,485 100.0 770,376 100.0 670,824 100.0 682,338 100.0 Overall <10 21,093 0.4 18,750 0.3 15,483 0.2 14,605 0.2 8,902 0.2 10-19 19,571 0.3 18,008 0.3 27,780 0.3 19,886 0.3 21,029 0.4 20-29 102,514 1.7 112,177 2.0 295,532 3.6 108,256 1.8 117,138 2.1 30-39 744,263 12.7 625,811 11.2 1,679,730 20.7 610,687 10.0 555,423 9.8 40-49 2,407,266 41.1 2,218,340 39.8 3,339,238 41.2 2,331,356 38.2 1,987,333 34.9 50-59 1,618,061 27.6 1,608,651 28.9 1,784,153 22.0 1,872,645 30.7 1,842,729 32.4 60-69 760,534 13.0 763,012 13.7 769,671 9.5 860,716 14.1 844,878 14.9 70-79 172,166 2.9 193,407 3.5 176,523 2.2 255,721 4.2 285,875 5.0 ≥80 12,488 0.2 14,219 0.3 16,234 0.2 21,355 0.4 25,282 0.4 Total 5,857,956 100.0 5,572,373 100.0 8,104,345 100.0 6,095,229 100.0 5,688,587 100.0
costs of the digestive disease including liver disease accounted for 4.2% (USD 3.54 billion) and 3.1% (USD 2.31) of the costs of total diseases and their sum recorded 7.3% (USD 5.85 billion). As the study in Canada found that the weight of direct costs incurred by visiting medical institutions directly to treat digestive disease were estimated to be larger than that of indirect costs such as death costs, the finding was different from that of Korean studies investigating only liver disease.
This study is meaningful as the latest study on estimation of the socioeconomic costs of liver disease for the longest period. Moreover, because it calculated the costs from a societal perspective, it included the extensive effect of liver disease on the society at large. In particular, all Koreans have been insured mandatorily and the country has established a single insurance claim system so that the total scale of healthcare utilization except uninsured items can be grasped when liver disease patients utilize medical institutions or
pharmacies. As this study used these health insurance data to estimate direct medical costs, direct non-medical costs (traffic costs, costs of caregivers) and the loss of productivity following sick leave, the validity and the reliability of results of this study were expected to be enhanced. However, for direct medical costs, uninsured items not paid by the health insurance system needed to be included to calculate actual costs exactly but this study gained the uninsured medical costs by estimating them with the rate of uninsured out-of pocket payments26 in South Korea published by National
Health Insurance Corporation every year since 2004. But, the data had a limitation that they did not include those about packs of prepared herb medicine in the oriental medicine and health improving agents like vitamin supplements at pharmacies. Although this study utilized the best available data and methodology to enhance the reliability and the utilization of the results, it had some limitations as follows.
First, in the process of investigating the healthcare utilization with the health insurance data related to liver disease, the data were extracted with only principal diagnosis as a standard with excluding liver disease as additional diagnosis, so the directs costs and the loss of productivity following sick leave could be underestimated. Second, costs of driving cars to visit outpatient clinics due to liver disease were excluded from the mean traffic costs so that the average round-trip traffic costs per one visit to an outpatient clinic could be underestimated. Third, for costs of caregivers for inpatients with liver disease, the nursing of guardians or paid caregivers might be determined by the severity of disease and the costs of caregivers could be incurred at home as well as at medical institutions. However, because of no data about the rate of the care-giving at home and the correlation between the severity of disease and the utilization rate of care-giving service, this study limited cases to calculate the costs of caregivers to inpatients at medical institutions, so the costs of caregivers was estimated on the assumption that the inpatients needed full-time care-giving. Fourth, in the process of estimating the future income loss due to premature death caused by liver disease and the loss of productivity following sick leave, this study analyzed only employees with income except unemployed persons (job seekers) and economically inactive population (housewives, students and persons waiting to enter the army) among the working-age group aged over 15 years to calculate the scale of objective and valid income loss. So, the exclusion of unpaid
productive activities of unemployed persons and economically inactive population could underestimate the loss of productivity following premature deaths and sick leave, but objective and valid data to investigate the rate of the population and the economic value of the unpaid activities were insufficient. Fifth, the loss of productivity following sick leave contained the decreased or lost income of employed liver disease patients due to hospitalization or visits to medical institutions. However, a simple rest at home or other places during sick leave by the severity of disease was excluded in this study because of no data about the population, so the loss of productivity following sick leave could be underestimated. Lastly, the health insurance data are collected based on claims submitted to National Health Insurance Corporation by healthcare providers to receive costs paid by the insurer among the total costs of patients. Therefore, validity issues related with diagnosis and the content of medical service in the health insurance data have been raised continuously and particularly up-coding of reporting wrong disease codes intentionally works as a factor hampering the reliability of studies using the data. However, despite these fundamental limitations of the health insurance data, this study is considered to have relatively less up-coding inducing factors by analyzing liver disease or one of comparatively severe diseases and some up-coding related errors within liver disease are thought not to influence the results of this study considerably because this study analyzed the total liver disease not a part of the disease.
In conclusion, the socioeconomic costs of liver disease, although they were slightly different by year, were as much as maximally KRW 8,104.3 billion in 2006. The lost earnings caused by liver disease-related premature deaths accounted for the largest portion or 73.9-86.1%. However, while the rate of lost earnings tended to reduce slightly from 2004 to 2008, the rate of direct medical costs paid by health insurance increased sharply. These findings meant that measures to improve the efficiency of the medical costs of liver disease are necessary.
Moreover, 88.0-90.7% out of the socioeconomic costs of liver disease were incurred in males, and the costs by age recorded the highest rate or 34.9-41.2% of the total costs in liver disease patients in their 40s and those in their 50s (22.0-32.4%) and 30s (9.8-20.7%) followed them in the order. That shows that liver disease provokes a significant loss in most economically active age groups, and if appropriate
measures for the management of liver disease are not prepared, not only the loss of productivity in the society at large but also various potential loss are expected to be raised. Lastly, the results of this study are considered to be useful for promoting the public awareness of the urgency of the prevention and the management of liver disease and for prioritizing disease-related policies in various health projects.
Acknowledgements
This study was supported by Health Insurance Policy Research Institute, National Health Insurance Corporation.
REFERENCES
1. Statistics Korea, Korean Statistical Information Service (KOSIS). Annual report on the cause of death statistics. 2010. KOSIS web site, <http://kosis.kr/abroad/abroad_01List.jsp>. Accessed 2011. 2. Jung YH, Ko SJ. An estimation of economic costs of 5 major
diseases. Health and Welfare Policy Forum 2003;79:55-65. 3. Kim DJ, Kim HS, Yim HJ, Suh JI, Cheong JY, Kim IH, et al.
Problems faced by Korean patients with chronic liver disease and the role of the Korean Association for the Study of the Liver- emphases on social discrimination, insufficiency of reimbursement coverage, and deficiency of the welfare system. Korean J Hepatol 2008;14:125-135. 4. Ettaro L, Songer TJ, Zhang P, Engelgau MM. Cost-of-illness studies
in diabetes mellitus. Pharmacoeconomics 2004;22:149-164. 5. Currie G, Kerfoot KD, Donaldson C, Macarthur C. Are cost of
injury studies useful? Inj Prev 2000;6:175-176.
6. Rice DP. Cost of illness studies: what is good about them? Inj Prev 2000;6:177-179.
7. Ontario Chronic Disease Prevention Alliance (OCDPA). Economic cost of chronic disease in Canada 1995-2003. OCDPA web site, <http://www.ocdpa.on.ca/OCDPA/docs/OCDPA_EconomicCosts.p df>. Accessed 2011.
8. American Diabetes Association. Economic costs of diabetes in the U.S. In 2007. Diabetes Care 2008;31:596-615.
9. Rehm J, Patra J, Popova S. Alcohol-attributable mortality and potential years of life lost in Canada 2001: implications for prevention and policy. Addiction 2006;101:373-384.
10. John RM, Sung HY, Max W. Economic cost of tobacco use in India, 2004. Tob Control 2009;18:138-143.
11. Park TK, Park SB. Study on the economic costs of smoking in Korea. Korean J Public Econ 2000;5:167-195.
12. Kim HJ, Park TK, Jee SH, Kang HY, Nam CM. Analysis of socioeconomic costs of smoking in Korea. Korean J Prev Med 2001;34:183-190.
13. Fenoglio P, Parel V, Kopp P. The social cost of alcohol, tobacco and illicit drugs in France, 1997. Eur Addict Res 2003;9:18-28. 14. Noh IC, Suh MH, Kim YR. Socioeconomic costs and policy issues
of alcohol drinking. Seoul; Korea Institute for Health and Social Affairs, 1997:80.
15. Chung WJ, Chun HJ, Lee SM. Socioeconomic costs of alcohol drinking in Korea. J Prev Med Public Health 2006;39:21-29. 16. Kouris-Blazos A, Wahlqvist ML. Health economics of weight
management: evidence and cost. Asia Pac J Clin Nutr 2007; 16(Suppl 1):329-338.
17. Colagiuri S, Lee CM, Colagiuri R, Magliano D, Shaw JE, Zimmet PZ, et al. The cost of overweight and obesity in Australia. Med J Aust 2010;192:260-264.
18. Jeong BG, Moon OR, Kim NS, Kang JH, Yoon TH, Lee SY, et al. Socioeconomic costs of obesity for Korean adults. Korean J Prev Med 2002;35:1-12.
19. Rice DP. Estimating the cost-of-illness. Am J Public Health Nations Health 1967;57:424-440.
20. Koopmanschap MA. Cost-of-illness studies. Useful for health policy? Pharmacoeconomics 1998;14:143-148.
21. Byford S, Torgerson DJ, Raftery J. Economic note: cost of illness studies. BMJ 2000;320:1335.
22. Drummond MF, Sculpher MJ, Torrance GW, O’Brien BJ, Stoddart GL. Methods for the economic evaluation of health care programmes. 3rd ed. New York: Oxford University Press, 2005:55-56.
23. Kim J, Hahm MI, Park EC, Park JH, Park JH, Kim SE, et al. Economic burden of cancer in South Korea for the year 2005. J Prev Med Public Health 2009;42:190-198.
24. Park CS, Kang HY, Kwon I, Kang DR, Jung HY. Cost-of-illness study of asthma in Korea: estimated from the Korea national health insurance claims database. J Prev Med Public Health 2006;39: 397-403.
25. National Health Insurance Corporation (NHIC), Health Insurance Review & Assessment Service (HIRA). National Health Insurance statistical yearbook. 2005-2009. NHIC web site. <http://www.nhic.or.kr/ portal/site/main/menuitem.74b68c0b767ded38b31148b4062310a0/ >, Accessed 2011.
26. Choi KC, Lee HY, Lee SM. Survey on the benefit coverage rate of national health insurance in 2008. 2009. National Health Insurance Corporation (NHIC). NHIC web site. < http://www.nhic.or.kr/portal/ site/main/menuitem.42a779d76d7f8c38b31148b4062310a0/>, Accessed 2011.
27. Statistics Korea, Korean Statistical Information Service (KOSIS). Annual report on the consumer price index. 2005-2009. KOSIS web site, <http://kosis.kr/abroad/abroad_01List.jsp>. Accessed 2011. 28. Korea Institute for Health and Social Affairs (KIHASA), National
Health Insurance Corporation (NHIC). A report of Korea health panel survey 2008 (1). KIHASA web site, < http://www.kihasa.re.kr/ html/jsp/public/public_01_01_view.jsp?bid=12&ano=870&content Type=1>. Accessed 2011.
29. Statistics Korea, Korean Statistical Information Service (KOSIS). Annual report on the cause of death statistics. 2005-2009. KOSIS web site, <http://kosis.kr/abroad/abroad_01List.jsp>. Accessed 2011. 30. Statistics Korea, Korean Statistical Information Service (KOSIS).
Life tables for Korea. 2005-2009. KOSIS web site, <http://kosis.kr/ abroad/abroad_01List.jsp>. Accessed 2011.
31. Statistics Korea, Korean Statistical Information Service (KOSIS). Annual report on the economically active population survey. 2005-2009. KOSIS web site, <http://kosis.kr/abroad/abroad_ 01List.jsp>. Accessed 2011.
32. Ministry of Employment and Labor(MOEL), Korean Statistical Information Service (KOSIS). Basic survey on wage structure. 2005-2009. KOSIS web site, <http://kosis.kr/abroad/abroad_ 02List.jsp?parentId=1211011,118>. Accessed 2011.
33. Ministry of Employment and Labor (MOEL), Korean Statistical Information Service (KOSIS). Survey report on the wages and working hours at establishments. 2004-2008. KOSIS web site, <http://kosis.kr/abroad/abroad_02List.jsp?parentId=1211011,118>. Accessed 2011.
34. Public Health Agency of Canada (PHAC). Economic burden of illness in Canada, 1998. PHAC web site, < http://www.phac-aspc.gc.ca/ publicat/ebic-femc98/pdf/ebic1998.pdf>. Accessed 2011.
Appendix 2. Ratio of treatment cost to nonbenefit cost (unit: %)* 2004 2005 2006 2007 2008 Inpatient 40.25 40.00 27.75 25.00 30.38 Outpatient 20.63 18.76 17.37 19.90 21.07 Pharmacy 2.04 2.77 1.42 1.32 2.04 *source: Choi et al (2009).26
Appendix 4. Deaths related to liver disease (units: persons)*
2004 2005 2006 2007 2008
Male Female Male Female Male Female Male Female Male Female
0-4 10 2 9 4 6 2 9 2 5 5 5-9 5 4 5 1 3 0 1 5 1 0 10-14 2 2 3 2 1 1 1 1 1 1 15-19 4 4 1 4 9 6 5 3 7 3 20-24 14 8 11 13 40 18 10 9 10 9 25-29 33 19 38 18 138 42 24 16 28 11 30-34 158 47 137 57 425 92 101 48 95 38 35-39 585 94 433 102 1,110 153 386 90 372 82 40-44 1,545 207 1,277 204 2,153 275 1,098 132 973 143 45-49 2,347 282 2,172 305 2,287 350 2,127 269 1,915 268 50-54 2,351 348 2,244 361 2,071 399 2,227 346 2,280 357 55-59 2,318 431 2,161 399 1,961 514 2,024 387 2,108 325 60-64 2,325 621 2,227 586 1,909 654 1,915 522 1,811 454 65-69 1,931 701 1,925 668 1,381 698 1,953 684 1,972 733 70-74 1,267 645 1,388 716 825 609 1,444 714 1,598 706 75-79 774 607 800 592 455 443 886 630 962 654 80-84 477 394 445 449 168 181 484 465 511 481 ≥85 182 285 202 277 52 71 271 295 284 339 Total 16,328 4,701 15,478 4,758 14,994 4,508 14,966 4,618 14,933 4,609
*source: Statistics Korea (2005-2009).29
Appendix 5. Human capital loss per capita stratified according to sex, age, and year (units: KRW 1,000)
2004 2005 2006 2007 2008
Male Female Male Female Male Female Male Female Male Female
0-4 968,308 425,852 875,773 392,670 1,150,825 520,012 770,284 353,901 461,151 223,537 5-9 986,965 434,057 910,882 407,977 1,167,408 527,504 824,514 378,469 527,880 255,883 10-14 1,005,981 442,420 946,390 423,881 1,184,229 535,105 881,750 404,742 604,265 292,909 15-19 1,022,649 447,124 980,551 436,326 1,198,926 538,834 940,491 428,866 689,770 331,648 20-24 1,020,378 426,258 996,153 421,658 1,196,189 515,191 982,463 426,849 766,912 347,817 25-29 985,190 379,732 970,326 378,070 1,152,840 461,484 984,042 393,007 806,887 330,310 30-34 898,009 328,001 892,466 329,099 1,054,007 400,784 932,171 349,329 795,551 300,466 35-39 770,756 274,979 777,687 278,387 911,866 337,546 832,425 301,180 731,529 264,508 40-44 623,103 220,161 635,710 224,194 745,922 272,020 702,206 247,549 628,695 221,439 45-49 474,120 167,878 486,310 170,704 575,661 207,534 548,408 193,086 504,782 175,218 50-54 332,101 121,448 341,122 121,998 404,743 148,854 396,079 140,823 368,474 128,652 55-59 219,686 83,515 225,548 82,599 265,609 101,998 258,137 96,491 242,292 87,991 60-64 143,247 53,320 145,084 52,639 169,758 65,432 165,948 62,381 156,550 57,132 65-69 94,716 33,862 96,278 33,777 111,470 41,679 111,374 40,726 107,156 38,183 70-74 55,125 19,779 56,567 19,920 64,770 24,310 66,364 24,364 65,880 23,573 75-79 15,663 5,640 16,204 5,729 18,367 6,923 19,258 7,101 19,671 7,069
29 2 The K or ean Jour nal of H epat ol ogy V ol . 17. N o. 4, D ecem ber 2011 Ap pe nd ix 1 . C ost of tre at m en t re la te d to liv er d ise as e (u nits: K R W 1 ,0 00 ,0 00 ) * 20 04 20 05 20 06 200 7 200 8 In pa tie nt O utp atie nt Ph ar m ac y In pa tie nt O utp atie nt Ph ar m ac y In pa tie nt O utp atie nt Ph ar m ac y In pa tie nt O utp atie nt Ph ar m ac y In pa tie nt O utp atie nt Ph M al e <1 0 581 75 7 99 800 76 1 88 807 77 2 81 91 3 73 3 80 1, 119 70 4 10-19 768 2, 53 9 953 793 2, 81 0 1, 071 984 2, 86 3 889 1, 00 5 2, 949 1, 196 1, 46 2 2, 861 20-29 3, 141 7, 93 3 4, 722 3, 413 8, 56 4 6, 786 4, 735 9, 94 8 7, 108 4, 99 4 10, 22 5 10, 244 8, 19 0 10, 37 3 30-39 10, 691 16 ,1 21 10 ,9 22 10, 522 17 ,1 60 15 ,1 40 13, 670 20 ,2 43 15 ,9 99 15 ,4 25 22 ,3 75 24, 594 19 ,4 09 22 ,7 32 40-49 38, 120 27 ,9 02 18 ,5 53 38, 807 30 ,0 68 24 ,2 42 44, 036 36 ,4 55 25 ,8 22 49 ,2 48 40 ,8 63 39, 214 53 ,5 01 41 ,3 71 50-59 49, 683 25 ,6 07 15 ,8 53 55, 049 30 ,0 60 19 ,5 15 65, 867 39 ,7 09 21 ,1 17 79 ,8 01 48 ,5 47 33, 276 84 ,3 94 51 ,9 23 60-69 40, 474 16 ,8 38 11 ,6 30 44, 237 19 ,1 72 12 ,2 67 51, 079 24 ,5 94 12 ,0 36 61 ,8 66 30 ,0 72 18, 029 67 ,7 33 33 ,9 44 70-79 14, 445 4, 81 5 3, 283 17, 320 5, 79 4 3, 560 21, 250 7, 31 0 3, 711 27 ,2 15 9, 19 1 5, 838 30 ,6 77 10 ,5 52 ≥80 2, 714 64 1 439 3, 249 71 3 452 4, 028 88 9 420 5, 22 5 1, 100 668 6, 10 3 1, 279 T ot al 160, 616 103 ,1 52 66 ,4 54 174, 191 115 ,1 02 83 ,1 22 206, 456 142 ,7 82 87 ,1 83 245 ,6 93 16 6, 05 4 133, 140 27 2, 58 9 17 5, 740 152 Fem al e <1 0 449 59 1 64 512 58 9 62 483 60 2 57 65 2 56 8 71 831 55 6 10-19 397 1, 28 2 320 460 1, 32 0 339 605 1, 43 2 312 66 4 1, 472 371 1, 16 5 1, 468 20-29 1, 926 4, 83 7 1, 765 2, 419 5, 24 8 2, 377 3, 834 5, 99 9 2, 390 4, 07 5 6, 322 3, 489 5, 89 3 6, 819 30-39 3, 542 7, 67 8 3, 207 4, 110 8, 31 8 4, 154 4, 761 9, 47 9 4, 326 5, 91 5 10, 38 2 6, 700 8, 41 9 10, 98 1 40-49 8, 696 11 ,5 85 5, 85 8 9, 073 12 ,8 41 7, 44 6 11, 217 14 ,9 71 7, 86 0 12 ,73 8 16, 62 9 12, 487 14 ,1 90 17 ,2 35 50-59 14, 364 12 ,0 89 7, 27 0 14, 837 13 ,9 42 8, 90 7 17, 382 17 ,8 33 9, 52 4 21 ,72 3 21, 43 7 15, 164 24 ,5 53 23 ,2 65 60-69 16, 120 9, 09 2 6, 636 17, 143 10 ,3 33 7, 32 4 20, 129 12 ,8 30 7, 30 2 24 ,68 5 15, 54 3 11, 165 26 ,1 48 17 ,5 65 70-79 9, 643 3, 26 2 2, 692 10, 799 3, 87 0 2, 933 13, 248 4, 70 1 2, 941 16 ,3 23 5, 93 4 4, 657 18 ,6 22 6, 82 9 ≥80 2, 639 46 3 399 2, 932 56 4 419 3, 646 66 5 408 5, 06 4 865 642 5, 68 1 1, 020 T ot al 57, 775 50 ,8 80 28 ,2 12 62, 285 57 ,0 25 33 ,9 61 75, 305 68 ,5 12 35 ,1 19 91 ,8 39 79 ,1 52 54, 744 10 5, 50 3 85, 73 8 O ver al l <1 0 1, 030 1, 34 8 164 1, 312 1, 35 0 151 1, 289 1, 37 4 138 1, 56 5 1, 301 151 1, 95 0 1, 260 10-19 1, 164 3, 82 1 1, 272 1, 253 4, 13 0 1, 410 1, 590 4, 29 4 1, 201 1, 66 8 4, 421 1, 567 2, 62 7 4, 329 20-29 5, 067 12 ,7 70 6, 48 7 5, 832 13 ,8 12 9, 16 3 8, 570 15 ,9 46 9, 49 8 9, 06 9 16 ,5 46 13, 733 14 ,0 83 17 ,1 92 30-39 14, 233 23 ,7 99 14 ,1 29 14, 632 25 ,4 78 19 ,2 94 18, 431 29 ,7 22 20 ,3 25 21 ,3 40 32 ,7 57 31, 294 27 ,8 28 33 ,7 14 40-49 46, 816 39 ,4 87 24 ,4 11 47, 880 42 ,9 08 31 ,6 88 55, 253 51 ,4 27 33 ,6 82 61 ,9 86 57 ,4 92 51, 700 67 ,6 91 58 ,6 06 50-59 64, 047 37 ,6 97 23 ,1 23 69, 887 44 ,0 01 28 ,4 23 83, 248 57 ,5 42 30 ,6 41 101 ,5 24 69 ,9 84 48, 440 10 8, 94 7 75, 18 8 60-69 56, 594 25 ,9 29 18 ,2 66 61, 380 29 ,5 06 19 ,5 91 71, 208 37 ,4 24 19 ,3 38 86 ,5 51 45 ,6 15 29, 194 93 ,8 82 51 ,5 09 70-79 24, 088 8, 07 7 5, 975 28, 119 9, 66 4 6, 493 34, 498 12 ,0 11 6, 65 2 43 ,53 7 15, 12 4 10, 496 49 ,2 99 17 ,3 81 ≥80 5, 353 1, 10 3 839 6, 182 1, 27 8 871 7, 674 1, 55 4 828 10 ,2 89 1, 96 5 1, 310 11 ,7 84 2, 29 9 T ot al 218, 391 154 ,0 31 94 ,6 66 236, 476 172 ,1 27 11 7, 08 3 281, 761 211 ,2 94 12 2, 30 1 337 ,5 31 24 5, 20 6 187, 884 37 8, 09 3 26 1, 478 218 * so ur ce : N at iona l h eal th i ns ur ance c or por at ion, H ea lth I ns ur an ce R evi ew & A ss es sm en t Ser vi ce (2 005 -2 009) . 25
S unm i Lee, et al . S oc ioec onom ic cost of l iv er di sease i n K Ap pe nd ix 3 . V isit da ys re la te d to liv er d ise as e (u nits: da ys ) * 20 04 20 05 20 06 20 07 20 08 In pa tie nt O utp atie nt In pa tie nt O utp atie nt In pa tie nt O utp atie nt In pa tie nt O utp atie nt In pa tie nt O utp M al e <1 0 5,6 92 27 ,6 80 6,7 11 26,8 91 5,7 22 24 ,3 78 5,0 53 21,1 38 6,2 03 10 -19 10,9 76 94,9 45 10,4 43 10 1,5 88 11 ,4 42 94 ,4 73 11 ,3 54 88 ,1 38 15 ,5 96 20 -2 9 56 ,39 6 263 ,4 65 61 ,9 21 270 ,8 12 68 ,1 84 284 ,9 69 63 ,2 17 268 ,2 83 89 ,1 05 253 30 -3 9 148 ,4 11 534 ,4 10 142 ,7 71 539 ,3 70 148 ,8 85 547 ,6 84 148 ,0 58 552 ,3 21 174 ,0 23 509 40 -4 9 359 ,6 87 811 ,6 13 338 ,1 57 818 ,8 65 324 ,1 17 812 ,3 81 332 ,7 51 818 ,8 76 328 ,4 08 745 50 -5 9 379 ,6 90 655 ,9 97 390 ,4 41 702 ,9 79 388 ,9 13 738 ,7 27 425 ,4 17 784 ,2 48 420 ,7 77 750 60 -6 9 291 ,3 27 460 ,2 81 293 ,8 47 466 ,7 25 295 ,8 84 477 ,4 45 325 ,2 86 507 ,8 13 339 ,6 98 490 70 -7 9 107 ,7 84 136 ,0 10 117 ,3 70 149 ,4 83 132 ,4 53 161 ,5 40 157 ,7 13 181 ,1 52 171 ,4 88 183 ≥80 21 ,6 88 18 ,7 53 25 ,4 56 19 ,9 91 28 ,9 72 21 ,3 30 36 ,6 70 23 ,1 21 44 ,2 81 Tot al 1, 381 ,6 51 3, 003 ,1 54 1, 387 ,1 17 3, 096 ,7 04 1, 404 ,5 72 3, 162 ,9 27 1, 505 ,5 19 3, 245 ,0 90 1, 589 ,5 79 3, 057 Fe m al e <1 0 4,1 33 21 ,4 46 4,6 30 21,0 39 3,9 11 19 ,7 32 3,7 38 16,9 14 4,9 52 10 -19 4,3 92 46 ,7 19 4,8 17 46,4 97 5,1 29 45 ,5 45 5,3 41 41,8 22 8,3 38 20 -2 9 22 ,91 8 164 ,0 36 26 ,3 83 169 ,0 51 34 ,0 04 172 ,9 58 31 ,7 89 165 ,8 90 49 ,8 79 161 30 -3 9 38 ,43 0 254 ,4 14 40 ,2 38 256 ,6 10 44 ,2 63 254 ,8 56 45 ,7 33 255 ,2 51 65 ,5 88 241 40 -4 9 81 ,17 1 364 ,5 87 79 ,4 97 375 ,1 08 76 ,9 86 371 ,7 08 83 ,2 77 374 ,9 21 88 ,3 63 350 50 -5 9 104 ,6 23 347 ,3 62 106 ,8 92 378 ,6 48 104 ,2 06 398 ,0 18 113 ,5 33 424 ,8 37 118 ,0 40 419 60 -6 9 117 ,7 64 275 ,2 89 117 ,0 39 281 ,5 58 120 ,9 51 289 ,2 45 131 ,6 42 303 ,6 33 127 ,9 46 302 70 -7 9 78 ,49 3 107 ,8 39 83 ,0 16 114 ,3 58 93 ,2 10 121 ,2 33 105 ,6 22 134 ,9 64 118 ,2 88 138 ≥80 24 ,1 78 17 ,1 51 26 ,2 71 18 ,1 08 32 ,9 23 19 ,0 47 42 ,4 95 21 ,4 01 46 ,4 82 Tot al 476 ,1 02 1, 598 ,8 43 488 ,7 83 1, 660 ,9 77 515 ,5 83 1, 692 ,3 42 563 ,1 70 1, 739 ,6 33 627 ,8 76 1, 690 O veral l <1 0 9,8 25 49,1 26 11,3 41 47,9 30 9,6 33 44 ,1 10 8,7 91 38,0 52 11,1 55 10 -1 9 15 ,36 8 141 ,6 64 15 ,2 60 148 ,0 85 16 ,5 71 140 ,0 18 16 ,6 95 129 ,9 60 23 ,9 34 121 20 -2 9 79 ,31 4 427 ,5 01 88 ,3 04 439 ,8 63 102 ,1 88 457 ,9 27 95 ,0 06 434 ,1 73 138 ,9 84 414 30 -3 9 186 ,8 41 788 ,8 24 183 ,0 09 795 ,9 80 193 ,1 48 802 ,5 40 193 ,7 91 807 ,5 72 239 ,6 11 751 40 -4 9 440 ,8 58 1, 176 ,2 00 417 ,6 54 1, 193 ,9 73 401 ,1 03 1, 184 ,0 89 416 ,0 28 1, 193 ,7 97 416 ,7 71 1, 095 50 -5 9 484 ,3 13 1, 003 ,3 59 497 ,3 33 1, 081 ,6 27 493 ,1 19 1, 136 ,7 45 538 ,9 50 1, 209 ,0 85 538 ,8 17 1, 169 60 -6 9 409 ,0 91 735 ,5 70 410 ,8 86 748 ,2 83 416 ,8 35 766 ,6 90 456 ,9 28 811 ,4 46 467 ,6 44 793 70 -7 9 186 ,2 77 243 ,8 49 200 ,3 86 263 ,8 41 225 ,6 63 282 ,7 73 263 ,3 35 316 ,1 16 289 ,7 76 321 ≥80 45 ,8 66 35 ,9 04 51 ,7 27 38 ,0 99 61 ,8 95 40 ,3 77 79 ,1 65 44 ,5 22 90 ,7 63 Tot al 1, 857 ,7 53 4, 601 ,9 97 1, 875 ,9 00 4, 757 ,6 81 1, 920 ,1 55 4, 855 ,2 69 2, 068 ,6 89 4, 984 ,7 23 2, 217 ,4 55 4, 748 * so ur ce : N at iona l h eal th i ns ur ance c or por at ion, H ea lth I ns ur an ce R evi ew & A ss es sm en t Ser vi ce (2 005 -2 009) . 25