An increased chloride level in
hypochloremia is associated with
decreased mortality in patients
with severe sepsis or septic shock
Hyung Jung Oh
1,2, Seung Jun Kim
3, Yong Chan Kim
4,5, Eun Jin Kim
4,5, In Young Jung
4,5,
Dong Hyun Oh
4,5, Su Jin Jeong
4,5, Nam Su Ku
4,5, Sang Hoon Han
4,5, Jun Yong Choi
4,5,
Young Goo Song
4,5, Dong-Ryeol Ryu
2,6,7& June Myung Kim
4,5Only a few observational studies investigated the association between hypochloremia and mortality in critically ill patients, and these studies included small number of septic patients. Also, no study has evaluated the effect of an increase in chloride (Cl−) concentration in hypochloremia on the mortality. A total of 843 Korean septic patients were divided into three groups based on their baseline Cl− level, and Cox analyses were performed to evaluate the 28-day mortality. Moreover, the change in Cl− level (ΔCl) from baseline to 24, 48, or 72 hour was determined, and Cox analyses were also conducted to evaluate the relationship of ΔCl with mortality. 301 (35.7%) patients were hypochloremic (Cl− < 97 mEq/L), and 38 (4.5%) patients were hyperchloremic (Cl−> 110 mEq/L). During the follow-up period, 119 (14.1%) patients died. Hypochloremia was significantly associated with an increased mortality after adjusting for several variables, but an 1 mEq/L increase of ΔCl within 24 hour in patients with hypochloremia was significantly related to a decreased mortality. Caution might be required in severe septic patients with hypochloremia considering their increased mortality rate. However, an increased Cl− concentration might decrease the mortality rate of such patients.
Chloride is the most abundant anion in plasma and interstitial fluid, accounting for approximately one-third of plasma tonicity, and it affects acid‒base changes1,2. Although chloride is a major electrolyte measured routinely in
daily practice, few studies have focused on chloride levels in critically ill patients3. Several studies have reported
the incidence of chloride alterations and the association thereof with patient outcomes4–7.
Intravenous fluid resuscitation to restore the effective circulatory volume is a mainstay of early therapy for severely ill septic patients7,8. During the salvage phase of shock, 0.9% saline is typically infused into these
patients9–11. However, because saline is rich in chloride12–14, these patients are susceptible to hyperchloremia
during the post-resuscitation phase14,15. Moreover, hyperchloremic metabolic acidosis induced by use of
chloride-rich solutions is associated with poor outcomes in critically ill patients5,14,16, particularly in those with
severe sepsis and septic shock15. Thus, whether a chloride-liberal or chloride-restricted solution leads to better
clinical outcomes in septic patients remains controversial17–19.
Hypochloremia is also independently associated with an increased risk of mortality in critically ill patients because of the occurrence of metabolic alkalosis20–22. However, only a few observational studies have evaluated
the association between hypochloremia and hospital mortality, and they included only a small number of septic patients in the intensive care unit6,7. Accordingly, we stratified 843 Korean patients into hypochloremia,
normo-chloremia, and hyperchloremia groups based on their baseline chloride level and assessed the 28-day mortality
1Ewha Institute of Convergence Medicine, Ewha Womans University Mokdong Hospital, Seoul, Korea. 2Research
Institute for Human Health Information, Ewha Womans University Mokdong Hospital, Seoul, Korea. 3Department
of Internal Medicine, International St. Mary’s Hospital, Catholic Kwandong University, College of Medicine, Incheon, Korea. 4Department of Internal Medicine, Yonsei University, College of Medicine, Seoul, Korea. 5AIDS research
institute, Yonsei University College of Medicine, Seoul, Korea. 6Department of Internal Medicine, School of Medicine,
Ewha Womans University, Seoul, Korea. 7Tissue Injury Defense Research Center, Ewha Womans University, Seoul,
Korea. Hyung Jung Oh and Seung Jun Kim contributed equally to this work. Correspondence and requests for materials should be addressed to N.S.K. (email: smileboy9@yuhs.ac)
Received: 21 March 2017 Accepted: 10 November 2017 Published: xx xx xxxx
rate in the three groups. Furthermore, we investigated the effect of an increased chloride level on the 28-day mortality rate.
Results
Baseline characteristics.
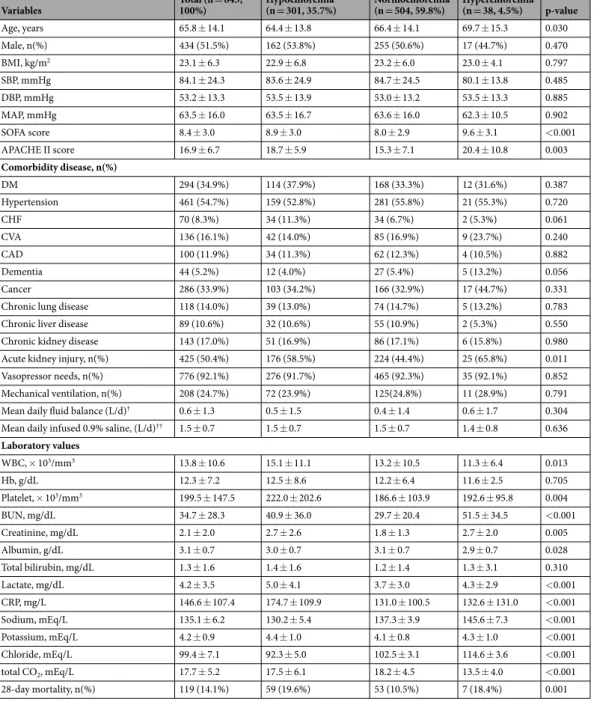
The mean age of the 843 patients was 65.8 ± 14.1 years, and 434 (51.5%) patients were male. The mean body mass index (BMI) was 23.1 ± 6.3 kg/m2, and the mean sequential organ failureassess-ment (SOFA) score, and acute physiology and chronic health evaluation (APACHE) II score were 8.4 ± 3.0 and 16.9 ± 6.7. The mean systolic blood pressure (SBP), diastolic blood pressure (DBP), and mean arterial pressure (MAP) were 84.1 ± 24.3, 53.2 ± 13.3, and 63.5 ± 16.0 mmHg, respectively. Of the 843 patients, 294 (34.9%) had diabetes mellitus, 461 (54.7%) had hypertension, 70 (8.3%) had congestive heart failure, 136 (16.1%) had cer-ebrovascular accidents, and 100 (11.9%) had a history of coronary arterial disease. Dementia, cancer, chronic pulmonary disease, chronic liver disease, and kidney disease were diagnosed in 5.2%, 33.9%, 14.0%, 10.6%, and 17.0% of the patients, respectively (Table 1).
Three hundred and one (35.7%) patients were in the hypochloremic group, and 38 (4.5%) were in the hyper-chloremic group. The patients in the hyperhyper-chloremic group had a significantly higher SOFA score (9.6 ± 3.1 vs. 8.9 ± 3.0 in the hypochloremic group and 8.0 ± 2.9 in the normochloremic group, P < 0.001) and APACHE II score (20.4 ± 10.8 vs. 18.7 ± 5.9 in the hypochloremic group and 15.3 ± 7.1 in the normochloremic group, P = 0.003), serum blood urea nitrogen (BUN) level, sodium concentration, and chloride concentration compared with the other two groups. Moreover, there were more occurrence of acute kidney injury (AKI) in hypochloremic and hyperchloremic groups compared with normochloremic group, but there were no significant differences among the three groups in vasopressor needs and mechanical ventilation. White blood cell and platelet counts and serum lactate, C-reactive protein (CRP), and potassium levels were highest in the hypochloremic group. Serum albumin and total CO2 levels were significantly highest in the normochloremic group. We investigated
“Net fluid accumulation for 72 hours” and calculated “Mean daily fluid balance”. Moreover, we examined the type and amount of fluid for 72 hours from the initial admission of emergency department (ED). Table 1 showed that mean daily fluid balance was 0.6 L and daily infused 0.9% saline was 1.5 L. However, there were no significant differences in mean daily fluid balance and daily infused 0.9% saline solution among the three groups (Table 1). In addition, although total infused fluid amount in hyperchloremic group for 48- and 72-hours were significantly increased compared with those in normochloremic group, there were no significant differences in 24-hour total infused fluid amount, 24-, 48-, and 72-hour infused 0.9% saline solution among the tree groups (Supplementary Tables 1 and 2).
Hypochloremia and 28-day mortality.
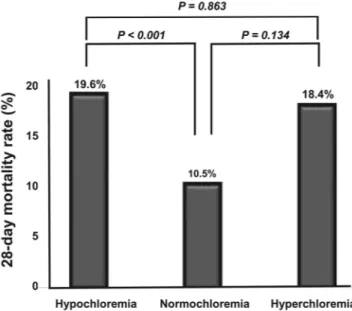
One hundred and nineteen (14.1%) patients died during the follow-up period. The 28-day mortality rate was significantly higher in the hypochloremic group (59 patients, 19.6%) and non-significantly higher in the hyperchloremic group (7 patients, 18.4%) compared with the nor-mochloremic group (53 patients, 10.5%) (Table 1 and Fig. 1). In addition, Kaplan-Meier analysis showed that the cumulative survival rate was significantly lower in the hypochloremia and hyperchloremia groups compared with the normochloremia group (Fig. 2). Univariate Cox proportional regression analyses of 28-day mortality revealed that the hypochloremic group had a hazard ratio (HR) of 1.699 [95% confidence interval (CI), 1.129–2.557; P = 0.011] compared with the normochloremic group, while no significant association was evident in the hyper-chloremic group (HR, 1.762; 95% CI 0.753–4.127; P = 0.192). Hypochloremia was also significantly associated with 28-day mortality after adjusting for age, sex, MAP, SOFA score, cerebrovascular accidents, serum BUN, albu-min, and lactate compared with normochloremic patients (HR, 1.484; 95% CI, 1.078–2.339, P = 0.034) (Table 2).The change of serum chloride concentration and 28-day mortality.
The effect of an 1 mEq/L increase in the chloride concentration on the 28-day mortality rate was investigated next. The ΔCl24h, ΔCl48h,and ΔCl72h values were calculated and subjected to univariate Cox proportional regression analyses to determine
their effects on 28-day mortality.
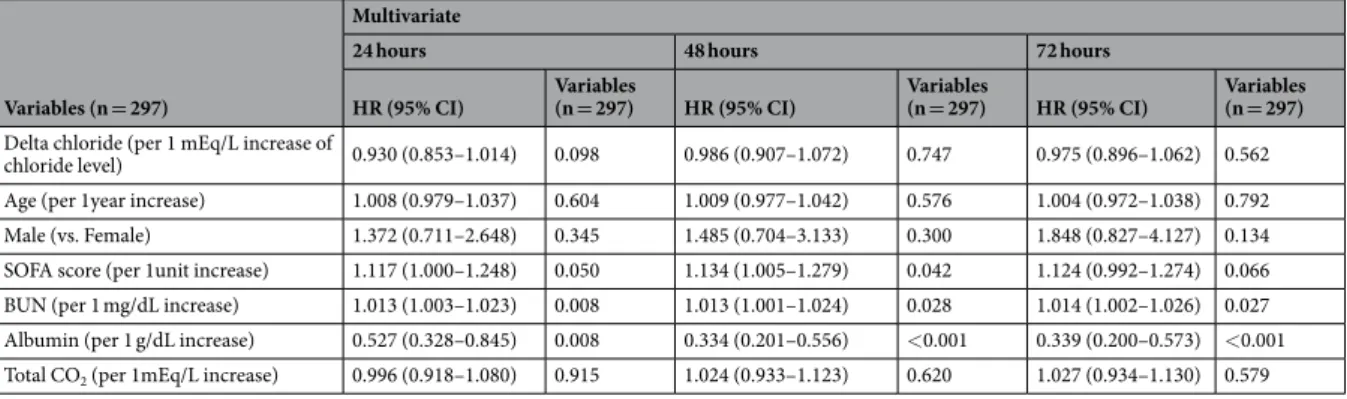
In the hypochloremic group, 28-day mortality was significantly decreased with each 1 mEq/L increase in the chloride concentration at 24 hour (HR, 0.914; 95% CI, 0.866–0.966; P = 0.001) and 48 hour (HR, 0.936; 95% CI, 0.888–0.987; P = 0.014), while there was no significant effect at 72 hour (HR, 0.961; 95% CI, 0.910–1.014; P = 0.258) (Table 3). In the normochloremic group, the 28-day mortality rate was significantly reduced by 12.1%, 9.7%, and 10.5% for each 1 mEq/L increase in the chloride concentration at 24, 48, and 72 hour, respectively (Table 4). However, the ΔCl values were not significantly associated with the 28-day mortality rate at any of the time points in the hyperchloremic group (Table 5). Then, multivariate Cox analyses were performed, when the variables had a significant HRs such as ΔCl24h, ΔCl48h in hypochloremic group and ΔCl24h, ΔCl48h, and △Cl72h
in normochloremic group. Tables 6 and 7 revealed that the 28-day mortality rate in the hypochloremic group was significantly decreased by 5.4% at 24 hour with an 1 mEq/L increase in the chloride level, after adjusting for age, sex, BMI, SBP, SOFA score, coronary arterial disease (CAD), serum albumin, and total CO2, whereas there was no
significant effect of an 1 mEq/L increase in the chloride level on 28-day mortality at 48 hour (Table 6). In addition, in normochloremic group, increase of chloride level was not significantly associated with 28-day mortality in any time (Table 7).
Discussion
The 28-day mortality rate was significantly increased by 48.4% in the hypochloremic group compared with the normochloremic group, while it was not significantly increased in the hyperchloremic group compared with the normochloremic group. In contrast, in the hypochloremic group, the 28-day mortality rate was significantly decreased by 5.4% with an 1 mEq/L increases in ΔCl24h.
Although the mechanism is unclear, hypochloremia is considered to be related to mortality in critically ill patients, possibly because of metabolic alkalosis20–22. However, the main factor responsible for mortality due to
hypochloremia and metabolic alkalosis is unclear7,23. Although their study population was different from ours,
Tani et al.7 reported that patients with metabolic acidosis had the highest mortality rate (metabolic acidosis,
Variables Total (n = 843, 100%) Hypochloremia (n = 301, 35.7%) Normochloremia (n = 504, 59.8%) Hyperchloremia (n = 38, 4.5%) p-value
Age, years 65.8 ± 14.1 64.4 ± 13.8 66.4 ± 14.1 69.7 ± 15.3 0.030 Male, n(%) 434 (51.5%) 162 (53.8%) 255 (50.6%) 17 (44.7%) 0.470 BMI, kg/m2 23.1 ± 6.3 22.9 ± 6.8 23.2 ± 6.0 23.0 ± 4.1 0.797 SBP, mmHg 84.1 ± 24.3 83.6 ± 24.9 84.7 ± 24.5 80.1 ± 13.8 0.485 DBP, mmHg 53.2 ± 13.3 53.5 ± 13.9 53.0 ± 13.2 53.5 ± 13.3 0.885 MAP, mmHg 63.5 ± 16.0 63.5 ± 16.7 63.6 ± 16.0 62.3 ± 10.5 0.902 SOFA score 8.4 ± 3.0 8.9 ± 3.0 8.0 ± 2.9 9.6 ± 3.1 <0.001 APACHE II score 16.9 ± 6.7 18.7 ± 5.9 15.3 ± 7.1 20.4 ± 10.8 0.003 Comorbidity disease, n(%) DM 294 (34.9%) 114 (37.9%) 168 (33.3%) 12 (31.6%) 0.387 Hypertension 461 (54.7%) 159 (52.8%) 281 (55.8%) 21 (55.3%) 0.720 CHF 70 (8.3%) 34 (11.3%) 34 (6.7%) 2 (5.3%) 0.061 CVA 136 (16.1%) 42 (14.0%) 85 (16.9%) 9 (23.7%) 0.240 CAD 100 (11.9%) 34 (11.3%) 62 (12.3%) 4 (10.5%) 0.882 Dementia 44 (5.2%) 12 (4.0%) 27 (5.4%) 5 (13.2%) 0.056 Cancer 286 (33.9%) 103 (34.2%) 166 (32.9%) 17 (44.7%) 0.331
Chronic lung disease 118 (14.0%) 39 (13.0%) 74 (14.7%) 5 (13.2%) 0.783
Chronic liver disease 89 (10.6%) 32 (10.6%) 55 (10.9%) 2 (5.3%) 0.550
Chronic kidney disease 143 (17.0%) 51 (16.9%) 86 (17.1%) 6 (15.8%) 0.980
Acute kidney injury, n(%) 425 (50.4%) 176 (58.5%) 224 (44.4%) 25 (65.8%) 0.011
Vasopressor needs, n(%) 776 (92.1%) 276 (91.7%) 465 (92.3%) 35 (92.1%) 0.852
Mechanical ventilation, n(%) 208 (24.7%) 72 (23.9%) 125(24.8%) 11 (28.9%) 0.791
Mean daily fluid balance (L/d)† 0.6 ± 1.3 0.5 ± 1.5 0.4 ± 1.4 0.6 ± 1.7 0.304
Mean daily infused 0.9% saline, (L/d)†† 1.5 ± 0.7 1.5 ± 0.7 1.5 ± 0.7 1.4 ± 0.8 0.636
Laboratory values WBC, × 103/mm3 13.8 ± 10.6 15.1 ± 11.1 13.2 ± 10.5 11.3 ± 6.4 0.013 Hb, g/dL 12.3 ± 7.2 12.5 ± 8.6 12.2 ± 6.4 11.6 ± 2.5 0.705 Platelet, × 103/mm3 199.5 ± 147.5 222.0 ± 202.6 186.6 ± 103.9 192.6 ± 95.8 0.004 BUN, mg/dL 34.7 ± 28.3 40.9 ± 36.0 29.7 ± 20.4 51.5 ± 34.5 <0.001 Creatinine, mg/dL 2.1 ± 2.0 2.7 ± 2.6 1.8 ± 1.3 2.7 ± 2.0 0.005 Albumin, g/dL 3.1 ± 0.7 3.0 ± 0.7 3.1 ± 0.7 2.9 ± 0.7 0.028 Total bilirubin, mg/dL 1.3 ± 1.6 1.4 ± 1.6 1.2 ± 1.4 1.3 ± 3.1 0.310 Lactate, mg/dL 4.2 ± 3.5 5.0 ± 4.1 3.7 ± 3.0 4.3 ± 2.9 <0.001 CRP, mg/L 146.6 ± 107.4 174.7 ± 109.9 131.0 ± 100.5 132.6 ± 131.0 <0.001 Sodium, mEq/L 135.1 ± 6.2 130.2 ± 5.4 137.3 ± 3.9 145.6 ± 7.3 <0.001 Potassium, mEq/L 4.2 ± 0.9 4.4 ± 1.0 4.1 ± 0.8 4.3 ± 1.0 <0.001 Chloride, mEq/L 99.4 ± 7.1 92.3 ± 5.0 102.5 ± 3.1 114.6 ± 3.6 <0.001 total CO2, mEq/L 17.7 ± 5.2 17.5 ± 6.1 18.2 ± 4.5 13.5 ± 4.0 <0.001 28-day mortality, n(%) 119 (14.1%) 59 (19.6%) 53 (10.5%) 7 (18.4%) 0.001
Table 1. Baseline characteristics at the time of ED admission among three groups (hypochloremia, normochloremia, and hyperchloremia)*. Data are expressed as mean (with standard deviation) or n (%). Abbreviations; ED, emergency department; BMI, body mass index; SBP, systolic blood pressure; DBP, diastolic blood pressure; MAP, mean arterial pressure; SOFA, sequential organ failure assessment; APACHE, acute physiology and chronic health evaluation; DM, diabetes mellitus; CHF, congestive heart failure; CVA, cerebrovascular accidents; CAD, coronary arterial disease; WBC, white blood cell; Hb, hemoglobin; BUN, blood urea nitrogen; CRP, C-reactive protein. *We investigated baseline demographic and laboratory data based on the time of patients’ ED admission, and stratified these data based on the hypochloremia, normochloremia, and hyperchloremia groups. Hypochloremia; chloride level less than 98 mEq/L at baseline. Normochloremia; chloride level between 98 to 110 mEq/L at baseline. Hyperchloremia; chloride level over 110 mEq/L at baseline.
†To quantify 72-hour cumulative fluid balance, we used the following formula: [∑daily (fluid intake (L)−
total output (L)], which was defined as “net fluid accumulation for 72 hours”. “Mean daily fluid balance” was calculated as the arithmetic mean of the daily fluid balance from the admission of ED to 72 hours. ††According
17.4%; metabolic alkalosis, 3.9%; normal, 6.27%; P = 0.027). Moreover, hypochloremic patients with metabolic acidosis had a higher mortality rate compared with those with metabolic alkalosis, suggesting that hypochloremia is associated with mortality independently of metabolic alkalosis.
Hypochloremia could be a sign of the severity of illness6 as a result of dysregulated homeostasis, including the
serum chloride concentration. The SOFA score was significantly increased in the hypochloremic group compared with the normochloremic group in the current study. However, the hypochloremic group was independently associated with an increased 28-day mortality rate compared with the normochloremic group even after adjusting for the SOFA score. In addition, an increase in chloride level at 24 hour was significantly related to a decreased 28-day mortality rate in the hypochloremic group.
Demonstrating that hypochloremia is a risk factor for mortality is problematic, because we did not show a causal link. Therefore, our results suggest an association between hypochloremia and a higher 28-day mortality rate in septic patients. The increase in the chloride concentration at 24 hour in the hypochloremic group was significantly associated with a decreased mortality rate.
In contrast, hyperchloremia was not significantly related to an increased 28-day mortality rate in this study. Unlike previous studies, the hyperchloremic group comprised only 38 (4.5%) patients, hampering identification of a significant association between hyperchloremia and an increased 28-day mortality rate. Thus, further studies involving larger populations are warranted to determine the relationship between hyperchloremia and mortality. Intravenous fluid resuscitation is considered essential for early therapy in severe septic patients4,7,8, and
chloride-rich solutions are typically used during the salvage phase of shock5,12–14. Such patients are susceptible
Figure 1. Hypochloremia and 28-day mortality. The 28-day mortality rate was significantly higher in the hypochloremic group (59 patients, 19.6%) compared with the normochloremic group (53 patients, 10.5%), whereas there was no significant difference in 28-day mortality rate between hyperchloremic group and normochloremic group.
Figure 2. Kaplan-Meier curve for 28-day mortality. The cumulative survival rate wassignificantly lower in the hypochloremia and hyperchloremia groups compared with the normochloremia group (Log rank P = 0.009).
to hyperchloremia during the post-resuscitation phase, and the consequent hyperchloremic metabolic acidosis leads to poor clinical outcomes in critically ill patients5,14–16. Therefore, several studies have investigated whether
a chloride-liberal or chloride-restricted solution leads to better clinical outcomes in septic patients. Some stud-ies reported a chloride-restricted solution to be superior18,19, while others suggested no significant difference in
clinical outcomes17,24,25. To our knowledge, no study has evaluated the influence of an increased chloride
con-centration on mortality in hypochloremic septic patients. An increase in the chloride level from baseline during follow-up was associated with all-cause hospital mortality5 and the development of AKI4; however, these studies
did not separate hypochloremic patients from normochloremic patients. Therefore, the analysis of the effect of elevated chloride levels on mortality in hypochloremic, normochloremic, and hyperchloremic patients was a strength of this study. Moreover, we report that an increased chloride level was independently associated with a decreased mortality rate in the hypochloremic group, suggesting that chloride-rich solutions could improve the clinical outcomes of hypochloremic patients.
This study had several limitations. First, this was a retrospective cohort study and thus was subject to selection bias. Second, the patients were arbitrarily classified into three groups according to our hospital reference, and the number of patients was distributed unevenly among the three groups. However, there are no established cut-off values for hypo-, normo-, or hyperchloremia5–7; most studies use cut-off values of 98 mEq/L for hypochloremia
and 110 mEq/L for hyperchloremia5,6. Third, we did not investigate acid‒base changes according to alteration of
the chloride level. Also, we analyzed only the change in chloride level within 72 hour; thus, our findings cannot be extrapolated beyond 72 hour. Despite these limitations, this study showed that hypochloremia is independently associated with an increased 28-day mortality rate, and that an increased chloride concentration is independently related to a decreased 28-day mortality rate in hypochloremic patients. In contrast a few previous studies pre-sented hypochloremia is significantly associated with adverse clinical outcomes, they did not provide the effect of change of serum chloride concentration. Moreover, this study may be a cornerstone to prove the importance of chloride fluid replacement in the septic patients who have hypochloremia at baseline.
In conclusion, septic critically ill patients with hypochloremia at baseline should be monitored closely. Moreover, such patients may benefit from an increased chloride level. Therefore, a randomized-controlled inter-ventional study involving a larger population is warranted to evaluate the association between an increased chlo-ride level and the mortality rate of hypochloremic patients.
Univariate Multivariate
HR (95% CI) p-value HR (95% CI) p-value
Group
Normochloremia Reference Reference
Hypochloremia 1.699 (1.129–2.557) 0.011 1.484 (1.078–2.339) 0.034 Hyperchloremia 1.762 (0.753–4.127) 0.192 1.354 (0.564–3.250) 0.497 Age (per 1year increase) 1.020 (1.003–1.037) 0.023 1.017 (0.997–1.038) 0.099 Male (vs. Female) 1.274 (0.840–1.932) 0.255 1.147 (0.744–1.768) 0.536 MAP (per 1 mmHg increase) 0.972 (0.956–0.988) 0.001 0.982 (0.966–0.998) 0.030 SOFA score (per 1unit increase) 1.220 (1.147–1.297) <0.001 1.124 (1.047–1.206) 0.001 CVA (vs. non-CVA) 1.797 (1.120–2.884) 0.015 1.883 (1.129–3.139) 0.015 BUN (per 1 mg/dL increase) 1.010 (1.008–1.013) <0.001 1.004 (1.001–1.008) 0.016 Albumin (per 1 g/dL increase) 0.369 (0.282–0.483) <0.001 0.411 (0.302–0.559) <0.001 Lactate (per 1 mg/dL increase) 1.163 (1.114–1.214) <0.001 1.115 (1.057–1.175) <0.001
Table 2. Univariate and multivariate Cox proportional hazards analyses for 28-day all-cause mortality. Abbreviations; HR, hazard ratio; CI, confidence interval; MAP, mean arterial pressure; SOFA, sequential organ failure assessment; CVA, cerebrovascular accidents; BUN, blood urea nitrogen.
Variables (n = 297) HR (95% CI) p-value
Delta chloride for 24 hours (ΔCl24h) 0.914 (0.866–0.966) 0.001 Delta chloride for 48 hours (ΔCl48h) 0.936 (0.888–0.987) 0.014 Delta chloride for 72 hours (ΔCl72h) 0.961 (0.910–1.014) 0.258
Table 3. Univariate Cox proportional hazards analyses for 28-day all-cause mortality per 1 mEq/L increase of chloride concentration in hypochloremic group. Abbreviations; HR, hazard ratio; CI, confidence interval. Definitions; The 24 hour delta chloride concentration (ΔCl24h) (mEq/L) was calculated by the following
formula: [Cl24h] − [Clat baseline], where Cl24h is the chloride concentration at 24 hour, and Clat baseline is the baseline
chloride concentration. The 48 hour delta chloride concentration (ΔCl48h) (mEq/L) was calculated by the
following formula: [Cl48h] − [Clat baseline], where Cl48h is the chloride concentration at 48 hour, and Clat baseline is the
baseline chloride concentration. The 72 hour delta chloride concentration (ΔCl72h) (mEq/L) was calculated by
the following formula: [Cl72h] − [Clat baseline], where Cl72h is the chloride concentration at 72 hour, and Clat baseline is
Materials and Methods
Study population.
A retrospective cohort study was conducted in Severance Hospital, a 2,400-bed tertiary teaching hospital at Yonsei University College of Medicine, South Korea. This study was approved by the institu-tional review board (IRB) of the Yonsei University Health System Clinical Trial Center (4-2017-0078). The need for informed consent from patients was waived because of the retrospective design of the study. All clinical inves-tigations were conducted in accordance with the guidelines of the 2013 Declaration of Helsinki.Data were collected from patients admitted to the ED for severe sepsis or septic shock from January 2010 to December 2015. The exclusion criteria were (a) age <18 years, (b) any contraindication for central venous catheterization, (c) pregnancy, (d) acute CVA e) acute coronary syndrome, (f) active gastrointestinal bleeding, (g) trauma, (h) drug overdose, (i) requirement for immediate surgery, (j) transfer to another institution, and (k) a do-not-resuscitate order. Severe sepsis and septic shock were defined according to standard criteria26. All patients
were included in the study only once.
Data collection.
Baseline characteristics, including demographic information and pre-existing chronic comorbidities, were collected at the time of admission to the ED. The SOFA27 and APACHE II28 scores weredeter-mined to assess disease severity based on the worst score obtained during the initial 24 hour of ED admission. In addition, the serum chloride concentration was measured by indirect potentiometry (ADVIA 1800 Chemistry System; Siemens Healthcare Diagnostic Inc., Oakville, ON, Canada). Chloride levels were determined at 24, 48, and 72 hour from baseline (time of admission to ED), and the change in chloride level relative to the baseline level was calculated for each time point.
Definitions.
(1) Hypochloremia was defined as a chloride concentration of <98 mEq/L at baseline. Normochloremia was defined as a chloride concentration of 98–110 mEq/L at baseline. Hyperchloremia was defined as a chlo-ride concentration of >110 mEq/L at baseline.
(2) The 24 hour delta chloride concentration (ΔCl24h) (mEq/L) was calculated by the following formula:
[Cl24h] − [Clat baseline], where Cl24h is the chloride concentration at 24 hour, and Clat baseline is the baseline
chlo-ride concentration.
(3) The 48 hour delta chloride concentration (ΔCl48h) (mEq/L) was calculated by the following formula:
[Cl48h] − [Clat baseline], where Cl48h is the chloride concentration at 48 hour, and Clat baseline is the baseline
chlo-ride concentration.
(4) The 72 hour delta chloride concentration (ΔCl72h) (mEq/L) was calculated by the following formula:
[Cl72h] − [Clat baseline], where Cl72h is the chloride concentration at 72 hour, and Clat baseline is the baseline
Variables (n = 498) HR (95% CI) p-value
Delta chloride for 24 hours (ΔCl24h) 0.879 (0.821–0.942) <0.001 Delta chloride for 48 hours (ΔCl48h) 0.903 (0.842–0.967) 0.004 Delta chloride for 72 hours (ΔCl72h) 0.895 (0.837–0.957) 0.001
Table 4. Univariate Cox proportional hazards analyses for 28-day all-cause mortality per 1 mEq/L increase of chloride concentration in normochloremic group. Abbreviations; HR, hazard ratio; CI, confidence interval. Definitions; The 24 hour delta chloride concentration (ΔCl24h) (mEq/L) was calculated by the following
formula: [Cl24h] − [Clat baseline], where Cl24h is the chloride concentration at 24 hour, and Clat baseline is the baseline
chloride concentration. The 48 hour delta chloride concentration (ΔCl48h) (mEq/L) was calculated by the
following formula: [Cl48h] − [Clat baseline], where Cl48h is the chloride concentration at 48 hour, and Clat baseline is the
baseline chloride concentration. The 72 hour delta chloride concentration (ΔCl72h) (mEq/L) was calculated by
the following formula: [Cl72h] − [Clat baseline], where Cl72h is the chloride concentration at 72 hour, and Clat baseline is
the baseline chloride concentration.
Variables (n = 48) HR (95% CI) p-value
Delta chloride for 24 hours (ΔCl24h) 1.089 (0.966–1.228) 0.161 Delta chloride for 48 hours (ΔCl48h) 0.983 (0.870–1.111) 0.787 Delta chloride for 72 hours (ΔCl72h) 0.920 (0.777–1.088) 0.330
Table 5. Univariate Cox proportional hazards analyses for 28-day all-cause mortality per 1 mEq/L increase of chloride concentration in hyperchloremic group. Abbreviations; HR, hazard ratio; CI, confidence interval. Definitions; The 24 hour delta chloride concentration (ΔCl24h) (mEq/L) was calculated by the following
formula: [Cl24h] − [Clat baseline], where Cl24h is the chloride concentration at 24 hour, and Clat baseline is the baseline
chloride concentration. The 48 hour delta chloride concentration (ΔCl48h) (mEq/L) was calculated by the
following formula: [Cl48h] − [Clat baseline], where Cl48h is the chloride concentration at 48 hour, and Clat baseline is the
baseline chloride concentration. The 72 hour delta chloride concentration (ΔCl72h) (mEq/L) was calculated by
the following formula: [Cl72h] − [Clat baseline], where Cl72h is the chloride concentration at 72 hour, and Clat baseline is
chloride concentration.
(5) AKI is defined as any of the followings; Increase in serum creatinine by ≥0.3 mg/dL within 48 hours or increase in serum creatinine to ≥1.5 times baseline, which is known or presumed to have occurred within the prior 7 days or urine volume <0.5 mL/kg/h for 6 hours29.
(6) Net fluid accumulation was measured by the formula: [∑daily (fluid intake (L) − total output (L)]30.
(7) Mean daily fluid balance was also calculated as the arithmetic mean of the daily fluid balance from the admission of ED to 72 hours31.
(8) According to our policy of the solution for severe sepsis, we usually use 0.9% saline.
Study outcomes.
The observation period ended 28 days after ED admission, and the primary outcome was the 28-day all-cause mortality rate.Statistical analysis.
Statistical analysis was performed using SPSS for Windows, version 22.0 (SPSS Inc., Chicago, IL, USA). The patients were classified into hypochloremia, normochloremia, and hyperchloremia groups based on their baseline chloride levels. Continuous variables are presented as means ± standard deviation and categorical variables as numbers and percentages. The baseline characteristics of the groups were compared by analysis of variance for continuous variables and the χ2 test for categorical variables.Kaplan-Meier survival curves were assessed using the log-rank test to compare the differences in 28-day mor-tality among groups. A Cox model was fit to evaluate the influence of the chloride level on 28-day mormor-tality and the effect of an increased chloride level at 24, 48, or 72 hour from baseline on 28-day mortality. First, we selected variables using the threshold of P-value < 0.2 from univariate analysis (Supplementary Table 3), and then confirmed new variables for adjustment of multivariate Cox analysis after assessing colinearity between the selected variables. Finally, MAP, SOFA score, CVA, serum BUN, albumin, and lactate were chosen to adjust for multivariate Cox analysis including age and sex to evaluate the effect of hypochloremia or hyperchloremia on 28-day mortality. With the same way, we performed multivariate Cox analyses for the effects of increase of chloride level on the mortality; BMI, SBP, SOFA score, CAD, serum albumin and total CO2 were selected for
Variables (n = 297)
Multivariate
24 hours 48 hours
HR (95% CI) p-value HR (95% CI) p-value
Delta chloride (per 1 mEq/L increase of chloride level) 0.946 (0.888–0.997) 0.023 0.961 (0.907–1.018) 0.174
Age (per 1year increase) 1.033 (0.998–1.069) 0.065 1.039 (1.002–1.078) 0.041
Male (vs. Female) 1.082 (0.542–2.160) 0.823 1.103 (0.530–2.297) 0.793
BMI (per 1 kg/m2 increase) 1.028 (1.003–1.054) 0.028 1.034 (1.007–1.060) 0.012 SBP (per 1 mmHg increase) 0.987 (0.971–1.003) 0.107 0.994 (0.978–1.009) 0.435 SOFA score (per 1unit increase) 1.129 (1.014–1.257) 0.026 1.113 (0.992–1.248) 0.067
CAD (vs. non-CAD) 2.165 (0.959–4.891) 0.063 2.279 (0.990–5.248) 0.053
Albumin (per 1 g/dL increase) 0.427 (0.261–0.699) 0.001 0.376 (0.227–0.622) <0.001 Total CO2 (per 1mEq/L increase) 0.925 (0.871–0.982) 0.011 0.912 (0.855–0.972) 0.004
Table 6. Multivariate Cox proportional hazards analyses for 28-day all-cause mortality per increase of chloride concentration for 24 & 48 hours in hypochloremic group. Abbreviations; HR, hazard ratio; CI, confidence interval; BMI, body mass index; SBP, systolic blood pressure; SOFA, sequential organ failure assessment; CAD, coronary arterial disease.
Variables (n = 297)
Multivariate
24 hours 48 hours 72 hours
HR (95% CI) Variables (n = 297) HR (95% CI) Variables (n = 297) HR (95% CI) Variables (n = 297)
Delta chloride (per 1 mEq/L increase of
chloride level) 0.930 (0.853–1.014) 0.098 0.986 (0.907–1.072) 0.747 0.975 (0.896–1.062) 0.562 Age (per 1year increase) 1.008 (0.979–1.037) 0.604 1.009 (0.977–1.042) 0.576 1.004 (0.972–1.038) 0.792 Male (vs. Female) 1.372 (0.711–2.648) 0.345 1.485 (0.704–3.133) 0.300 1.848 (0.827–4.127) 0.134 SOFA score (per 1unit increase) 1.117 (1.000–1.248) 0.050 1.134 (1.005–1.279) 0.042 1.124 (0.992–1.274) 0.066 BUN (per 1 mg/dL increase) 1.013 (1.003–1.023) 0.008 1.013 (1.001–1.024) 0.028 1.014 (1.002–1.026) 0.027 Albumin (per 1 g/dL increase) 0.527 (0.328–0.845) 0.008 0.334 (0.201–0.556) <0.001 0.339 (0.200–0.573) <0.001 Total CO2 (per 1mEq/L increase) 0.996 (0.918–1.080) 0.915 1.024 (0.933–1.123) 0.620 1.027 (0.934–1.130) 0.579
Table 7. Multivariate Cox proportional hazards analyses for 28-day all-cause mortality per increase of chloride concentration for 24, 48 & 72 hours in normochloremic group. Abbreviations; HR, hazard ratio; CI, confidence interval; SOFA, sequential organ failure assessment; BUN, blood urea nitrogen.
adjustment including age and sex in hypochloremic group (Table 6), and SOFA score, serum BUN, albumin, and total CO2 were adjusted for multivariate Cox analysis including age and sex in normochloremic group (Table 7).
The results are presented as hazard ratios (HRs) with 95% confidence intervals (CIs). To confirm the assumption of proportionality, a time-dependent covariate analysis was performed, the results of which were not statistically significant, suggesting that the proportional hazards assumption was reasonable. All tests were two-sided, and a P value of <0.05 was considered to indicate statistical significance.
References
1. Berend, K., van Hulsteijn, L. H. & Gans, R. O. Chloride: the queen of electrolytes? EurJ Intern Med 23, 203–211 (2012).
2. Wolfe, L. A., Kemp, J. G., Heenan, A. P. & Ohtake, P. J. Acid-base regulation and control of ventilation in human pregnancy. Can J
Physiol Pharmacol 76, 815–827 (1998).
3. Yunos, N. M., Bellomo, R., Story, D. & Kellum, J. Bench-to-bedside review: Chloride in critical illness. Crit Care 14, 226 (2010). 4. Suetrong, B., Pisitsak, C., Boyd, J. H., Russell, J. A. & Walley, K. R. Hyperchloremia and moderate increase in serum chloride are
associated with acute kidney injury in severe sepsis and septic shock patients. Crit Care 20, 315 (2016).
5. Neyra, J. A. et al. Association of Hyperchloremia With Hospital Mortality in Critically Ill Septic Patients. Crit Care Med 43, 1938–1944 (2015).
6. Kimura, S. et al. Association of serum chloride concentration with outcomes in postoperative critically ill patients: a retrospective observational study. J Intensive Care 2, 39 (2014).
7. Tani, M., Morimatsu, H., Takatsu, F. & Morita, K. The incidence and prognostic value of hypochloremia in critically ill patients.
ScientificWorldJournal 2012, 474185 (2012).
8. Dellinger, R. P. et al. Surviving sepsis campaign: international guidelines for management of severe sepsis and septic shock: 2012.
Crit Care Med 41, 580–637 (2013).
9. Hahn, R. G. Should anaesthetists stop infusing isotonic saline? Br J Anaesth 112, 4–6 (2014).
10. Hammond, N. E. et al. Resuscitation fluid use in Australian and New Zealand Inte-nsive Care Units between 2007 and 2013.
Intensive Care Med 41, 1611–1619 (2015).
11. Finfer, S. et al. Resuscitation fluid use in critically ill adults: an international cro-sssectional study in 391 intensive care units. Crit
Care 14, R185 (2010).
12. Soni, N. British Consensus Guidelines on Intravenous Fluid Therapy for Adult Surgical Patients (GIFTASUP): Cassandra’s view.
Anaesthesia 64, 235–238 (2009).
13. Myburgh, J. A. & Mythen, M. G. Resuscitation fluids. N Engl J Med 369, 1243–1251 (2013).
14. O’Dell, E., Tibby, S. M., Durward, A. & Murdoch, I. A. Hyperchloremia is the dominant cause of metabolic acidosis in the postresuscitation phase of pediatric meningococcal sepsis. Crit Care Med 35, 2390–2394 (2007).
15. Noritomi, D. T. et al. Metabolic acidosis in patients with severe sepsis and septic shock: a longitudinal quantitative study. Crit Care
Med 37, 2733–2739 (2009).
16. Moviat, M. et al. Stewart analysis of apparently normal acid-base state in the critically ill. J Crit Care 28, 1048–1054 (2013). 17. Schneider, A. G. et al. Safetyevaluation of a trial of lipocalin-directed sodium bicarbonate infusion for renal protection in at risk
critically ill patients. Crit Care Resusc 15, 126–133 (2013).
18. Yunos, N. M. et al. Association between a chloride-liberal vs chloride-restrictive intravenous fluid administration strategy and kidney injury in critically ill adults. JAMA 308, 1566–1572 (2012).
19. Zhou, F. et al. Effects of fluid resuscitation with 0.9% saline versus a balanced electrolyte solution on acute kidney injury in a rat model of sepsis*. Crit Care Med 42, e270–278 (2014).
20. Fencl, V. & Rossing, T. H. Acid-base disorders in critical care medicine. Annu Rev Med 40, 17–29 (1989).
21. Lavie, C. J., Crocker, E. F. Jr., Key, K. J. & Ferguson, T. G. Marked hypochloremic metabolic alkalosis with severe compensatory hypoventilation. South Med J 79, 1296–1299 (1986).
22. Khanna A & Kurtzman NA. Metabolic alkalosis. J Nephrol 19 Suppl 9, S86–96 (2006).
23. Terzano, C. et al. Mixed acid-base disorders, hydroelectrolyte imbalance and lactate production in hypercapnic respiratory failure: the role of noninvasive ventilation. PLoS One 7, e35245 (2012).
24. Valette, X. et al. Sodium Bicarbonate Versus Sodium Chloride for Preventing Contrast-Associated Acute Kidney Injury in Critically Ill Patients: A Randomized Controlled Trial. Crit Care Med 45, 637–644 (2017).
25. Solomon, R. et al. Randomized Trial of Bicarbonate or Saline Study for the Prevention of Contrast-Induced Nephropathy in Patients with CKD. Clin J Am Soc Nephrol 10, 1519–1524 (2015).
26. Mervyn, S. et al. The Third International Consensus Definitions for Sepsis and Septic Shock (Sepsis-3). JAMA 315(8), 801–810 (2016).
27. Vincent, J. L. et al. The SOFA (Sepsis-related Organ Failure Assessment) score to describe organ dysfunction/failure. On behalf of the Working Group on Sepsis-Related Problems of the European Society of Intensive Care Medicine. Intensive Care Med 22(7), 707–710 (1996).
28. Knaus, W. A., Zimmerman, J. E., Wangner, D. P. & Lawrence, D. E. APACHE-acute physiology and chronic health evaluation: a physiologically based classification system. Crit Care Med 9(8), 591–597 (1981).
29. KIDO Clinical Practice Guideline for Acute Kidney Injury. Kidndy Int Suppl 2, 1, https://doi.org/10.1038/kisup.2012.1 (2012). 30. Bouchard, J. et al. Fluid accumulation, survival and recovery of kidney function in critically ill patients with acute kidney injury.
Kidney Int 76, 422–427 (2009).
31. Payen, D. et al. A positive fluid balance is associated with a worse outcome in patients with acute renal failure. Crit Care 12, R74 (2008).
Acknowledgements
This research was supported by Basic Science Research Program through the National Research Foundation of Korea (NRF) funded by the Ministry of Science, ICT & Future Planning (2010-0027945) and (NRF-2017R1D1A1A02017503). Statistical advises were reviewed by the statistician Hye Ah Lee, Ph.D at the Clinical Trial Center, Ewha Womans University Mokdong Hospital, Seoul, Republic of Korea, and Seulbi Lee, MSc at the Department of Medical Science, School of Medicine, Ewha Womans University, Seoul, Republic of Korea.
Author Contributions
Conceived and designed the experiments: H.J.O., S.J.K. and N.S.K. Performed the experiments: Y.C.K., E.J.K., I.Y.J., D.H.O., and S.J.J. Analyzed the data: S.H.H., J.Y.C., Y.G.S., D.R.R. and J.M.K. Wrote the paper: H.J.O., S.J.K. and N.S.K.
Additional Information
Supplementary information accompanies this paper at https://doi.org/10.1038/s41598-017-16238-z. Competing Interests: The authors declare that they have no competing interests.
Publisher's note: Springer Nature remains neutral with regard to jurisdictional claims in published maps and institutional affiliations.
Open Access This article is licensed under a Creative Commons Attribution 4.0 International License, which permits use, sharing, adaptation, distribution and reproduction in any medium or format, as long as you give appropriate credit to the original author(s) and the source, provide a link to the Cre-ative Commons license, and indicate if changes were made. The images or other third party material in this article are included in the article’s Creative Commons license, unless indicated otherwise in a credit line to the material. If material is not included in the article’s Creative Commons license and your intended use is not per-mitted by statutory regulation or exceeds the perper-mitted use, you will need to obtain permission directly from the copyright holder. To view a copy of this license, visit http://creativecommons.org/licenses/by/4.0/.